Optical conductivity of V4O7 across its metal-insulator transition
Abstract
The optical properties of a V4O7 single crystal have been investigated from the high temperature metallic phase down to the low temperature antiferromagnetic insulating one. The temperature dependent behavior of the optical conductivity across the metal-insulator transition (MIT) can be explained in a polaronic scenario. Charge carriers form strongly localized polarons in the insulating phase as suggested by a far-infrared charge gap abruptly opening at TMIT 237 K. In the metallic phase instead the presence of a Drude term is indicative of fairly delocalized charges with a moderately renormalized mass m∗ 5me. The electronic spectral weight is almost recovered on an energy scale of 1 eV, which is much narrower compared to VO2 and V2O3 cases. Those findings suggest that electron-lattice interaction rather than electronic correlation is the driving force for V4O7 metal-insulator transition.
pacs:
71.30.+h, 78.30.-j, 62.50.+pI. INTRODUCTION
Vanadium oxides are the archetypal metal-insulator transition (MIT) systems and their properties have been triggering a huge attention for decades both theoretically and experimentally. Besides the popular V2O3 and VO2, where the vanadium valency is three and four respectively, several mixed valence compounds have been synthesized giving rise to the vanadium-oxide Magnéli phase Eyert-04 . This series of compounds is defined by the formula VnO2n-1=V2O3+(-2)VO2, where 39. Except for V7O13, all of them undergo a metal-insulator transition accompanied by structural transformationsBaldassarre-07 ; Cava-13 ; Eyert-03 ; Eyert2-03 . Moreover a long-range antiferromagnetic ordering occurs at Néel temperatures TN much lower than TMIT, thus suggesting that the insulating state is not related to the magnetic order.
In V4O7 the MIT occurs at the temperature TMIT 237 K with a resisitivity jump of one order of magnitude Andreev-09 and a small thermal hysteresis (less than 1 K) Okinaka-70 . As a matter of fact the entire temperature range from room temperature to 150 K is the range of the continuous transition where resistivity changes over three orders of magnitude. The antiferromagnetic order instead appears at TN 34 K. The crystal structure of V4O7 consists of rutile-like blocks (as in VO2) extending in two dimensions and four VO6 octahedra wide in the third dimension Marezio-72 ; Marezio-78 . The shear planes among rutile blocks recall the V2O3 local structure Dernier . The resulting lattice is triclinic, belonging to a P space group, and showing four and seven independent V and O sites respectively. The V sites are split into two groups: V3 and V4 at the shear plane, V1 and V2 located at the center of the rutile blocks. While the environment of V1 and V2 is VO2-like, the local structure is V2O3-like around V3 and V4 octahedra which are connected by face sharing. These cations form two independent chains, V3-V1-V1-V3 (3113) and V4-V2-V2-V4 (4224), running parallel to the pseudorutile -axis. At variance with VO2 and V2O3, this low-symmetry crystal structure does not change at the MIT, except for a small contraction of the cell volume reducing from 441.33 Å3 in the metallic phase to 440.12 Å3 in the insulating one (at 120 K) Marezio-78 . The electron count in V4O7 provides an average valence of V3.5+ for the metallic cations. In presence of charge ordering the average valence of 3.5 should correspond to a 2V3+ and 2V4+ ion distribution formula unit. As a matter of fact, X-ray diffraction data Marezio-78 show that the metallic state is characterized by an almost complete metal cation disorder. On the other hand, data in the insulating state analyzed in terms of a bond-length summation method Marezio-78 , suggest a high degree of charge ordering, nearly corresponding (at 120 K) to a 83 of V3+ and V4+ ordered cations along the 3113 and 4224 chains respectively. A Local Density Approximation (LDA)+U electronic band calculation (where U is the local electron Hubbard repulsion of -electrons in vanadium ions) is in agreement with this picture Botana-11 suggesting the importance of charge ordering in establishing the MIT and the insulating phase of V4O7.
Despite the interesting behavior of V4O7 unveiling aspects related to the physics of both VO2 and V2O3, its properties have only been investigated with transport measurementsAndreev-09 ; Kacki to the best of our knowledge. These data suggest a strong role played by electron-lattice interaction in driving the MIT. Moreover, the temperature dependence of the dc conductivity in the insulating phase has been explained in terms of a small polaron hopping among V3+ and V4+ ordered lattice sites Andreev-09 . However a complete understanding of V4O7 electrodynamics in a broad frequency range is still lacking in literature. In this paper we fill this gap by presenting an optical study from the far-infrared to the visible range of a high quality V4O7 single crystal. We experimentally demonstrate that the optical conductivity in the metallic state of V4O7 is characterized by mobile charge carriers having a moderately renormalized mass m∗ 5me due to a polaronic effect. A charge gap abruptly opens at the MIT in concomitance with a strong spectral weight transfer from the Drude term to a mid-infrared absorption. This suggests that at the MIT mobile polarons transform in strongly localized ones in agreement with diffraction data.
II. METHODS
A stoichiometric single crystal of V4O7 was synthesized from a mixture of V2O5 and V2O3 (1:3) through gas transport in TeCl4 vapors at a temperature of 1300 K. An X-ray diffraction analysis confirmed the absence of other vanadium oxide phases in the crystals. The sample showed a well reflecting mirror-like surface, thus no polishing process was used to perform reflectivity measurements. The near-normal incidence reflectance R() data from the far-infrared to the visible range were collected using a Bruker Michelson interferometer and a helium flux optical cryostat working at a vacuum better than 10-6 mbar. BESSY-II storage ring radiation was exploited for the low-frequency part due to the small size of the crystal. A gold or silver (depending on the spectral range) coating was evaporated in situ over the sample surface and used as a reference. Measurements were perfomed between 10 and 300 K, thus allowing to probe all the phases that the sample undergoes, from the antiferromagnetic state to the metallic one. Low-frequency reflectance data were extrapolated with standard methods (Hagen-Rubens or constant lines). Since no temperature dependence is found above 15000 cm-1, the same standard 1/ high-frequency extrapolation was used both for the insulating and the metallic phase. The complex optical conductivity +i of the sample was thus obtained through Kramers-Kronig transformations. Due to the triclinic lattice structure, the reflectance was measured with unpolarized radiation and the optical conductivity cannot be related to a specific axis of the crystal.
III. RESULTS AND DISCUSSION
The reflectance R() of V4O7 is shown on a logarithmic scale for selected temperatures in the upper panel of Fig. 1. In the insulating phase from 10 to 200 K it is nearly constant at 0.5 for approaching zero frequency and then shows several phonon lines in the far-infrared range 50-800 cm-1. At 230 K R() increases to 0.7 and the intensity of the vibrational peaks is fairly reduced. Crossing TMIT 237 K the reflectance becomes metallic like approaching 1 at low frequencies. All curves (both in the insulating and in the metallic phases) merge around 8000 cm-1.
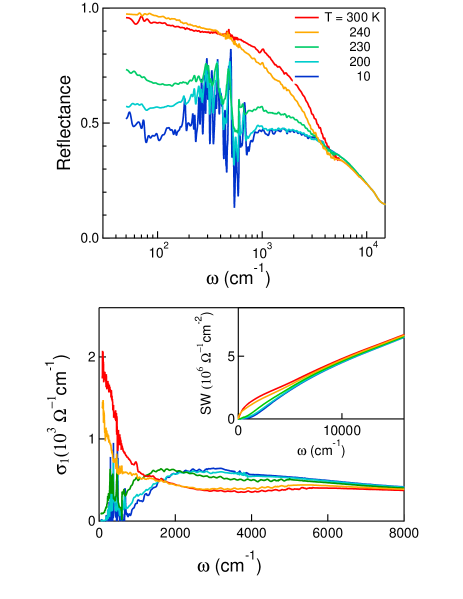
The real part of the optical conductivity is shown in the bottom panel of Fig.1 on a linear scale up to 8000 cm-1. In the insulating phase it shows a gap region followed by a mid-infrared (MIR) band centered at about 2500 cm-1, varying little up to 230 K, where it starts to shift towards lower frequencies. In the metallic phase this band is strongly depleted in favor of a Drude metallic contribution. The main temperature dependent changes of occur below 8000 cm-1 (1 eV), as it is pointed out by the behavior of the spectral weight (SW)
| (1) |
(shown in the inset of Fig.1), proportional to the number of carriers taking part to the optical absorption up to a cutoff frequency . This marks a major difference with respect to VO2 and V2O3 where the MIT, which is mainly due to electronic correlations, induces a SW redistribution covering a broader spectral range up to the near-ultraviolet Basov_VO2 ; Baldassarre-08 ; Lupi-NC . This behavior of the SW may imply that charge localization and ordering in V4O7 is mainly induced by the electron-lattice interaction.
In order to take a deeper look at the MIT, we will separately discuss the insulating and the metallic phases of V4O7 in the next two subsections.
III A. Insulating phase
The optical conductivity in the insulating phase is characterized by a far-infrared gap which starts to open when approaching TMIT 237 K (see the bottom panel of Fig.1). The opening of this gap accompanies the appearance of a broad MIR absorption peaked around 1500 cm-1 near TMIT and hardening to 2500 cm-1 at 10 K. We estimated the width of the insulating gap by fitting the edge of the mid-infrared absorption with the following equation:
| (2) |
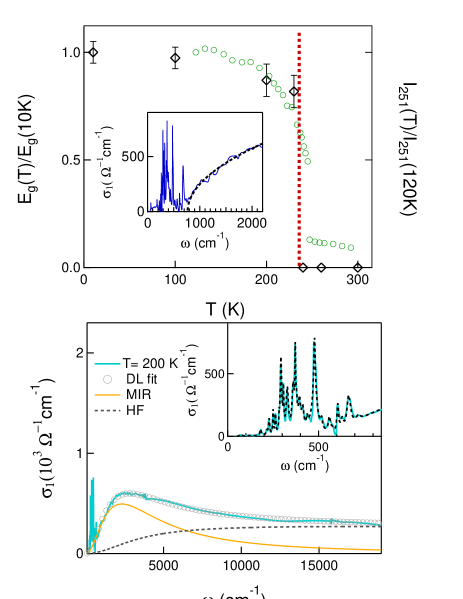
Here we assume a behavior of similar to that of a semiconductor in the presence of direct band to band transitions Lo Vecchio-13 . The curves thus obtained, reported as a dashed line in the inset of Fig.2 (upper panel) for T=100 K, nicely fit the rising edge of the optical conductivity at all temperatures with 1/2. The value of the gap Eg(T) corresponds to the intersection between Eq. 2 and the frequency axis. The ratio Eg(T)/Eg(10 K) is plotted by empty diamond symbols in the upper panel of Fig.2. At 10 K the gap Eg(10 K) is approximately 800 cm-1, then it smoothly decreases when raising the temperature up to 230 K. When crossing the transition temperature (vertical dotted line), the gap abruptly closes. This is a clear signature of the first-order nature of the transition.
In order to associate this gap to the charge ordering process, we report the behavior of the (251) X-ray diffraction peak intensity I251(T)/I251(120 K) T in the same figure with open circles. This peak, which shows a discontinuous variation at TMIT, has been proved to be particularly sensitive to the establishing of charge ordering in V4O7 Marezio-72 . The temperature dependent behavior of Eg(T) looks very similar to that of I251(T) clearly showing a correlation between the charge order (as measured by diffraction) and the gap opening. This strongly suggests that the MIT as observed in the low-energy electrodynamics of V4O7 is determined by the charge ordering process.
The optical conductivity can be also analysed in terms of a Drude-Lorentz (DL) model:
| (3) |
where is the plasma frequency, the scattering time, and are the strength and the spectral width of the Lorentz oscillators peaked at finite frequencies . In the insulating phase, plotted in the bottom panel of Fig.2 for T= 200 K, the Drude contribution is absent, and we used one Lorentzian oscillator to reproduce the MIR absorption at about 2500 cm-1 and one overdamped oscillator centered around 15000 cm-1 to describe the high-frequency temperature independent background.
As discussed in the introduction, the insulating state corresponds to a V3+ and V4+ charge ordering in the 1221 and 4334 vanadium chains running along the pseudorutile -axis. The oxygen octhaedra surrounding the vanadium 3+ and 4+ ions show very different V-O distances. V4+ cations, distributed in the 1331 chains, have an average V(1)-O (V(3)-O) distance of 1.946 Å(1.959 Å) at 120 K. The corresponding distances for the V3+ cations in the 2442 chains are instead 1.989 Å(2.009 Å) for V(2)-O (V(4)-O). Therefore, the localized holes in the V(1)-O and V(2)-O octahedra should be more properly described in terms of small polarons. In this scenario, is then natural to associate the MIR absorption to the photo-induced hopping of those polarons among the V3+ and V4+ lattice sites. In other words, the energy cost for a 3+ 4+ polaron charge fluctuation in the charge ordered state is of the order of 0.3 eV. It is also worth noticing that the MIR band at 100 K (not shown) has the same characteristic energy of that at 10 K. This implies that the magnetic order at TN does not further localize the charge carriers, thus confirming its irrelevant role in the low energy electrodynamics of V4O7.
The MIR band observed in the insulating phase of V4O7 looks very similar to that measured in other charge ordered polaron materials like V3O5 Baldassarre-07 and Fe3O4 Gasparov . In particular, the MIR bands in the insulating charge ordered states of V4O7 and V3O5 are centered around 2500 and 3200 cm-1 respectively. This similarity suggests that the ordering of charge carriers in V4O7 is mainly due to electron-lattice interaction possibly supported by a further localization energy gain related to electronic correlation.
The far-infrared part of the optical conductivity is characterized by strong phonon absorptions. The primitive cell of V4O7 (P crystal symmetry) contains two formula units, corresponding to 22 atoms located at the Wyckoff positions 2i Marezio-78 ; Eyert-04 . This symmetry admits three acoustic modes, 33 Raman Ag phonons and 30 Au infrared modes. (see the inset in the bottom panel of Fig.2) can be reasonably fitted through 30 Lorentz oscillators both above and below the magnetic transition at TN=34 K. This further suggests, in agreement with the previous findings, that the magnetic ordering does not play an important role in the low energy electrodynamics of V4O7.
III B. Metallic phase
The metallic optical conductivity is reported in Fig.3 from far-infrared to visible frequencies. at 300 K consists of a nearly flat background extending up the visible and an absorption in the infrared, particularly evident below 2000 cm-1. The intensity of this term decreases approaching TMIT thus transferring spectral weight towards higher frequencies. A DL fit of the optical conductivity provides a Drude contribution (characterized by a =7400 cm-1 and a scattering rate =450 cm-1), plus two Lorentz oscillators, one in the mid-infrared at about 1500 cm-1 and another centered aroud 15000 cm-1. This last oscillator reproduces the high-frequency temperature independent background also present in the insulating phase.
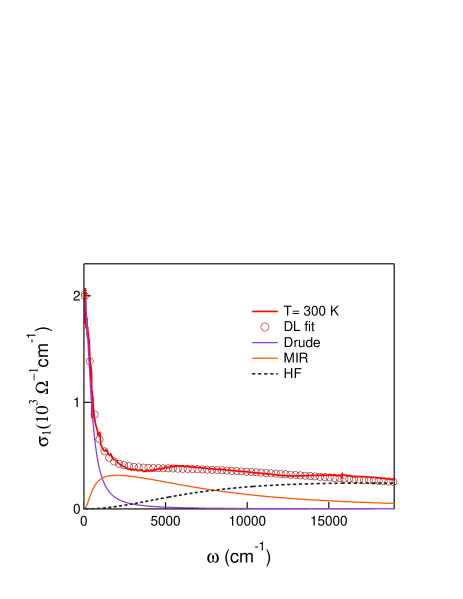
The Drude term indicates a fairly coherent low energy electrodynamics in V4O7. This is at variance with V3O5 where most of the spectral weight in the metallic phase is located in the MIR range, indicating instead an incoherent charge transport. However, some degree of short range charge disproportion V3+-V4+ and octahedra distortion persists at room temperature in V4O7 as observed by diffraction data Marezio-72 . Then, the low energy transport in the metallic phase could be related to mobile polarons rather than free charge carriers. Thus, their coherent propagation corresponds to the Drude behavior at low frequency, meanwhile their fast exchange among V3+-V4+ sites determines the MIR absorption at about 1500 cm-1. Indeed for a short-range charge ordering one can expect a lower energy cost for a charge fluctuation and this explains the softening of the MIR frequency across the MIT Ciuchi-99 .
The MIR and Drude intensities at 300 K can be used to estimate the polaronic mass m∗. Indeed, the ratio m∗/me=(/ 5, where me is the bare electron mass Van ; Devreese ; Perucchi-Nano , suggests an intermediate electron-phonon coupling as observed, for instance, in lightly doped cuprates Lupi-PRB98 . This is at variance with the metallic phase of V3O5, where m∗/m 15 indicating less mobile polarons and an incoherent charge-transport.
IV. CONCLUSIONS
In this paper we investigated the optical properties of a V4O7 single crystal across its metal to insulator transition at TMIT 237 K. The metallic optical conductivity is characterized by a mid-infrared absorption superimposed to a robust Drude term which indicates a fairly coherent charge transport. However, in agreement with X-ray diffraction measurements, a certain degree of local charge order associated with distorted V-O octahedra persists at room temperature. Thus, the low energy transport in the metallic phase could be related to mobile polarons rather than free charge carriers. The mid-infrared absorption then corresponds to the incoherent part of polaron conductivity and is probably related to fast V3+/V4+ charge fluctuations.
The insulating state is instead characterized by a charge gap in the far-infrared which discontinuously opens for TTMIT in concomitance with the establishing of the charge ordering state as observed by X-ray diffraction. This gap accompanies a mid-infrared absorption at higher energy than the metallic state, representing the photoinduced hopping of strongly localized polarons among V3+ to V4+ long-range ordered lattice sites. All these experimental observations finally suggest that in V4O7 electron-lattice interaction is the mainly driving force for charge ordering, possibly supported by a further localization energy gain related to electronic correlation.
ACKNOWLEDGEMENTS
We gratefully acknowledge discussions with Francesco Capitani. This study was supported by the Branch of Physical Sciences of the Russian Academy of Sciences within a research program. The research leading to these results has received funding from the European Community’s Seventh Framework Programme (FP7/2007-2013) under grant agreement n. 312284.
References
- (1) U. Schwingenschlögl and V. Eyert, Ann. Phys. 13, 475 (2004).
- (2) J. M. Allred, R. J. Cava, J. Solid State Chem. 198, 10 (2013).
- (3) L. Baldassarre, A. Perucchi, E. Arcangeletti, D. Nicoletti, D. Di Castro, P. Postorino, V. A. Sidorov, and S. Lupi, Phys. Rev. B 75, 245108 (2007).
- (4) U. Schwingenschlögl, V. Eyert and U. Eckern, Europhys. Lett. 61, 361 (2003).
- (5) U. Schwingenschlögl, V. Eyert and U. Eckern, Europhys. Lett. 64, 682 (2003).
- (6) V. N. Andreev and V. A. Klimov, Physics of the Solid State 51, 2235 (2009).
- (7) H. Okinaka, K. Nagasawa, K. Kosuge, Y. Bando, S. Kachi, and T. Takada, J. Phys. Soc. Japan 28, 789 (1970).
- (8) M. Marezio, D. B. McWhan, P. D. Dernier, and J. P. Remeika, Phys. Rev. Lett. 28, 1390 (1972).
- (9) J. L. Hodeau and M. Marezio, J. Solid State Chem. 23, 253 (1978).
- (10) P. Dernier, J. Phys. Chem. Solids 31, 2569 (1970).
- (11) A. S. Botana, V. Pardo, D. Baldomir, A. V. Ushakov, and D. I. Khomskii, Phys. Rev. B 84, 115138 (2011).
- (12) S. Kacki, K. Kosuge, and 0. Okimaka, J. Solid State Chem. 6, 258 (1973).
- (13) M. M. Qazilbash, A. A. Schafgans, K. S. Burch, S. J. Yun, B. G. Chae, B. J. Kim, H. T. Kim and D. N. Basov, Phys. Rev. B 77, 115121 (2008).
- (14) L. Baldassarre, A. Perucchi, D. Nicoletti, A. Toschi, G. Sangiovanni, K. Held, M. Capone, M. Ortolani, L. Malavasi, M. Marsi, P. Metcalf, P. Postorino, and S. Lupi, Phys. Rev. B 77, 113107 (2008).
- (15) S. Lupi, L. Baldassarre, B. Mansart, A. Perucchi, A. Barinov, P. Dudin, E. Papalazarou, F. Rodolakis, J. -P. Rueff, J. -P. Itié, S. Ravy, D. Nicoletti, P. Postorino, P. Hansmann, N. Parragh, A. Toschi, T. Saha-Dasgupta, O. K. Andersen, G. Sangiovanni, K. Held, and M. Marsi, Nat. Commun. 1, 105 (2010).
- (16) I. Lo Vecchio, A. Perucchi, P. Di Pietro, O. Limaj, U. Schade, Y. Sun, M. Arai, K. Yamaura, and S. Lupi, Scientific Reports 3, 2990 (2013).
- (17) L. V. Gasparov, D. B. Tanner, D. B. Romero, H. Berger, G. Margaritondo and L. Forro, Phys. Rev. B 62, 7939 (2000).
- (18) S. Ciuchi and F. de Pasquale, Phys. Rev. B 59, 5431 (1999).
- (19) J. L. M. van Mechelen, D. van der Marel, C. Grimaldi, A. B. Kuzmenko, N. P. Armitage, N. Reyren, H. Hagemann, and I. I. Mazinet, Phys. Rev. Lett. 100, 226403 (2008).
- (20) J. T. Devreese and A. S. Alexandrov, Rep. Prog. Phys., 72, 066501 (2009).
- (21) A. Perucchi, L. Baldassarre, A. Nucara, P. Calvani, C. Adamo, D. G. Schlom, P. Orgiani, L. Maritato, and S. Lupi, Nano Lett. 10, 4819 (2010).
- (22) S. Lupi, M. Capizzi, P. Calvani, B. Ruzicka, P. Maselli, P. Dore, and A. Paolone, Phys. Rev. B 57, 1248 (1998).