Inhomogeneous ordering in weakly coupled Heisenberg chains with random bonds
Abstract
Long range magnetic ordering in the quasi-one-dimensional random-bond antiferromagnet BaCu2(Si1-xGex)2O7 is studied in SR experiments as a function of disorder strength. Compared to the disorder-free parent materials, the saturation ordered moment is found to be considerably reduced. Moreover, even in weakly disordered species, the magnetically ordered state is shown to be highly inhomogeneous. The results are interpreted in terms of weakly coupled random spin chains, governed by the “infinite randomness“ fixed point.
I Introduction
Arbitrary weak disorder can qualitatively alter one-dimensional spin systems. A case in point is the Heisenberg antiferromagnetic chain with random bond strengths. Even though all exchange constants remain antiferromagnetic, the ground state and low energy excitations are quite distinct from those in Bethe’s uniform spin chain.Bethe (1931) Regardless of the details of disorder, the system flows to the “infinite randomness” fixed point, represented by the so-called Random Singlet (RS) phase.Ma et al. (1979); Dasgupta and Ma (1980); Fisher (1994); Motrunich et al. (2000) In the latter, all strong bonds are eliminated via a decimation procedure. What remains is a collection of non-interacting effective antiferromagnetic dimers. The distribution of dimer strengths diverges at and is universal in this limit. As a result, and all low-temperature thermodynamic properties and correlation functions acquire universal scaling forms.
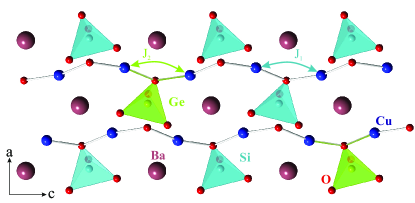
While the RS state is by now very well understood theoretically, experimental realizations are few. The first was quinolinium-(TCNQ)2, where the pioneering work of Tippie and Clark reported signs of RS physics in bulk properties.Tippie and Clark (1981) The only other potential candidate is BaCu2(Si1-xGex)2O7.Masuda et al. (2004, 2006); Shiroka et al. (2011); Casola et al. (2012) The disorder-free compounds with and are well-characterized chain systems.Tsukada et al. (1999); Zheludev et al. (2000, 2001); Kenzelmann et al. (2001); Zheludev et al. (2002) The crystal structure is visualized in Fig. 1.Oliveira (1993) The -carrying Cu2+ are bridged by superexchange interactions via O2- ions, forming chains along the axis of the orthorhombic structure. The corresponding antiferromagnetic exchange constants are K and K, for and , respectively.Tsukada et al. (1999) For the disordered derivatives , the average values of changes almost linearly with .Yamada et al. (2001) However, due to the difference in the ionic radii of Si and Ge, the exchange constants are randomly distributed in the chains. A recent comparison of bulk measurements with numerical simulations has convincingly demonstrated that the distribution of s is, to a good approximation, a simple bimodal one. In fact, it is just a spatially random distribution of the values in the two parent compounds.Shiroka et al. (2011); Casola et al. (2012) The randomness of the distribution reveals itself in an unusual behavior of the low temperature magnetic susceptibility.Yamada et al. (2001); Masuda et al. (2004); Shiroka et al. (2011) Unfortunately, an early inelastic neutron scattering confirmation of RS physics in BaCu2(Si1-xGex)2O7 Masuda et al. (2004) was later shown to be erroneous.Masuda et al. (2006); Zheludev et al. (2007) However, recent detailed macroscopic and NMR studies,Shiroka et al. (2011); Casola et al. (2012) as well as theoretical work,Herbrych et al. (2013) have firmly confirmed that for , BaCu2(Si1-xGex)2O7 indeed demonstrated all the key features of the RS state.
Due to weak inter-chain interactions, all BaCu2(Si1-xGex)2O7 materials order magnetically, with Néel temperatures ranging from 1 K to 10 K.Tsukada et al. (1999); Yamada et al. (2001); Kenzelmann et al. (2001) Therefore, all previous work aiming to probe RS physics was focused on the paramagnetic phase, to avoid the effects of 3-dimensional order. In contrast, the present paper focuses on the low-temperature ordered phase. We use a range of SR experiments to demonstrate that even in weakly disordered samples, the 3-dimensionally ordered state is highly unusual. Not only is the ordered moment considerably reduced compared to the parent compounds, it is also highly inhomogeneous. We argue that this inhomogeneity is not a simple reflection of the weak structural disorder, but represents the intrinsic “infinitely random” nature of the RS state in individual chains.
II Experimental
Single crystal samples of BaCu2(Si1-xGex)2O7 with , , , , , and were grown using the floating zone method. Some of the crystals were from the batch already used in previous studies Tsukada et al. (1999); Zheludev et al. (2000, 2001); Kenzelmann et al. (2001); Zheludev et al. (2002); Masuda et al. (2004, 2006); Zheludev et al. (2007). Crystallographic characterization structure was performed on a Bruker AXS single crystal diffractometer with an APEX II CCD detector, with over 3000 Bragg intensities collected for each sample. Calorimetric measurements were performed with a Quantum Design PPMS in the temperature range 50 mK–250 K. These data were collected on small fragments of masses ranging between 7.5 mg and 22.4 mg. The main focus of this paper is on the SR experiments. These were performed on the GPS, Dolly and LTF spectrometers at the Swiss Muon Source at the Paul Scherrer Institut. The samples were powders, obtained from parts of the as-grown single crystals. The samples were glued with GE-varnish on a silver plate for LTF, or wrapped in silver polyester foil for the Dolly and GPS experiments. The SR data were collected in zero field, in weak transversal fields (wTF) of 3 mT or 5 mT, and various longitudinal fields. The spectra were analyzed using musrfit,Suter and Wojek (2012) a tool to analyse time-differential SR data.
III Results and data analysis
III.1 Crystallographic characterization
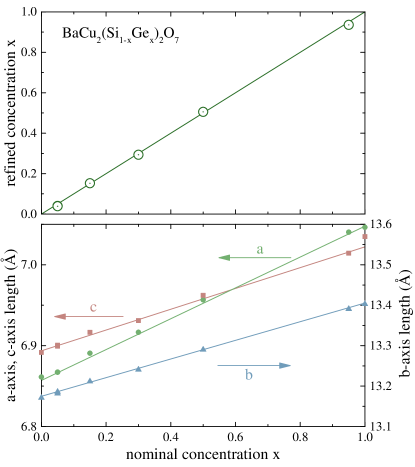
In all samples, single crystal X-ray diffraction at room temperature is consistent with the orthorhombic space group Pnma. The measured -dependence of the lattice parameters in BaCu2(Si1-xGex)2O7 is monotonic and linear (Fig. 2, bottom), in agreement with previous studies.Oliveira (1993); Yamada et al. (2001) A structural refinement confirmed that the actual Ge content in our samples is in excellent agreement with the nominal one (Fig. 2, top). Moreover, small samples taken from different parts of the as-grown crystalline rods showed no detectable composition variation.
III.2 Specific heat
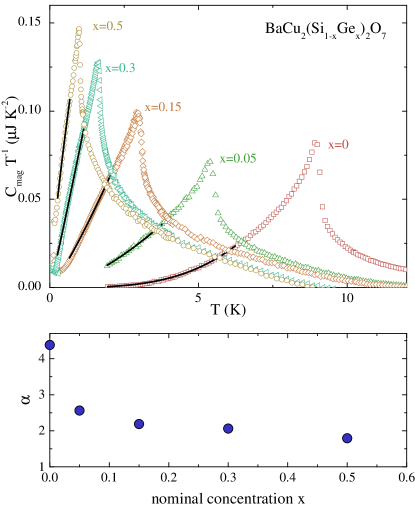
The main subject of this study being magnetic ordering in BaCu2(Si1-xGex)2O7, specific heat measurements were used as the most straightforward indicator of the corresponding phase transitions. The focus of these measurements was on Si-rich samples with . The magnetic contribution Cmag was estimated by subtracting a Debye lattice term, extrapolated down to low temperature from the range between 14 K and 25 K. As shown in Fig. 3, top panel, a pronounced lambda-anomaly is observed in all samples studied. The feature remains sharp and well defined across the entire concentration range. Its position was associated with the Néel temperature , and is tabulated in Tab. 1 and plotted against concentration in Fig. 4 (right axis). The two end materials show the maximal , while the lowest value is observed for . Note that our data on well-characterized single crystals are in contradiction with an earlier work on polycrystalline samples.Yamada et al. (2001) In the latter, two transitions were claimed for the low concentration regime, and the magnitude of the lambda-anomaly was found to substantially decrease with increasing disorder. We suspect that the discrepancy is due to sample inhomogeneities in the polycrystal experiments.
A striking feature of the measured temperature dependencies of the specific heat is the change in the low-temperature asymptotic in disordered samples, as compared to that in the parent material. To quantify this behavior, the data in the ranges (, ), () and ( and ) were fit to a power law (lines in the top panel of Fig. 3). The lower bound was imposed to avoid a Shottky-like contribution seen in all samples at the lowest temperatures, possibly due to nuclear spins.111In principle the nuclear contribution to specific heat could give additional information on the system. Unfortunately, due the unreasonably large time constants, the required detailed measurements at the lowest temperatures were not feasible. The fitted exponent is plotted against Ge concentration in the bottom panel of Fig. 3. We see that with increasing , the exponent rapidly crosses over from in the parent material to in the disordered compounds. Both these limiting values are distinct from expectations for a conventional antiferomagnet. The latter has a linear spin wave dispersion. The result is a density of spin wave states which is quadratic with energy, and a Debye-like contribution to specific heat with . The observed large value of in the disorder-free material is most likely related to the small anisotropy gap previously observed in these compounds.Zheludev et al. (2001) In contrast, a reduction of with the introduction of disorder clearly indicates a proliferation of low-energy states compared to simplest spin wave model.
III.3 SR
III.3.1 Weak transversal field experiments
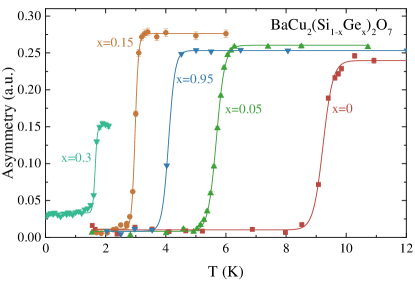
The SR technique is used to accurately determine the magnetic volume fraction and the ordering temperature. The volume fraction is proportional to the initial asymmetry measured of the SR spectra.Yaouanc and Réotier (2011) For five of our Si-rich samples the measured the temperature dependence of the asymmetry is plotted in Fig. 5. Magnetic ordering is marked by a sharp step-like increase. At elevated temperatures, the sample is completely in the paramagnetic phase. The observed variation of asymmetry in this regime is an instrument effect. For low temperatures, our results indicate that all samples are entirely ordered. For this is immediately apparent in the data collected on the Dolly and GPS instruments: at low temperatures the asymmetry is almost zero. For the we observe some residual asymmetry. This is, however, due to the about 20% background in the LTF instrument, where these data were taken.
To determine the ordering temperatures, the data were analyzed using an empirical sigmoidal function:
| (1) |
Here , are the asymmetry below and above respectively and is the apparent step width. Note that non-zero step widths are intrinsic to the technique. On the other hand, a particularly broad step would indicate a distribution of transition temperatures. The results of the fits are summarized in Tab. 1, and plotted in Fig. 4. The excellent agreement with the calorimetric measurements is apparent. The step width is quite narrow and does not show any increase when deviates from zero or unity. All this testifies the quality and homogeneity of our samples.
| (K), from | (K) from SR | (K) | |
|---|---|---|---|
| 0 | 8.9(1) | 9.23(1) | 0.163(10) |
| 0.05 | 5.4(1) | 5.68(1) | 0.139(4) |
| 0.15 | 2.94(6) | 2.97(1) | 0.057(3) |
| 0.3 | 1.63(4) | 1.65(1) | 0.038(3) |
| 0.5 | 0.98(4) | – | – |
| 0.95 | 4.0(1) | 4.09(1) | 0.108(11) |
| 1 | 8.7(1) | – | – |
III.3.2 Zero field SR
The magnitude of the ordered magnetic moments was studied in zero field SR experiments. Typical SR spectra collected in a series of BaCu2(Si1-xGex)2O7 samples at the lowest accessible temperature are shown in Fig. 6. Static internal fields due to magnetic order produce clear asymmetry oscillations, with at least two different frequencies in end compounds. The component of the internal field that is parallel to the incoming muon spin causes a finite non oscillating asymmetry at late times (“tail”). The immediate effect of disorder, even at very low concentration is the suppression of oscillations. The and materials still show at least two frequencies, but these are already heavily damped. At higher concentrations the spectra change to a more Gaussian-like shape, with the relaxation times decreasing towards .
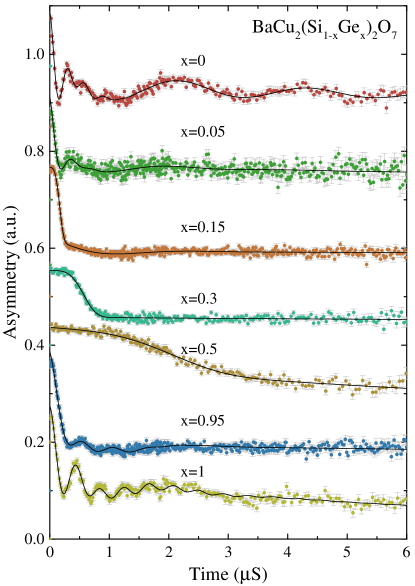
For a quantitative analysis, let us first focus on the regimes and , where damped oscillations are visible. The pure material is known to order in a commensurate, nearly collinear antiferromagnetic structure.Tsukada et al. (1999) Thus, the multitude of observed precession frequencies is due to different muon stopping sites. An adequate description of the data can be obtained assuming three distinct sites. For this model, the asymmetry as a function of time is empirically given by:Yaouanc and Réotier (2011)
| (2) | |||||
The parameters , and represent the muon fractions stopped at the different muon sites (site populations), respectively. Their ratio is not temperature dependent and was fit globally in each end-compound. For the disordered samples, the ratio was assumed to be the same as in the corresponding parent compounds. In Eq. 2, is the fraction of the muons which stop in a paramagnetic part of the sample, or possibly in the sample holder. Its value tends to be very small below . The corresponding parameters and were fit to spectra above and kept fixed at low temperatures. reflects the spin fluctuations of the muons with a polarization component parallel to the local magnetic field. We found it to be negligibly small and temperature independent. This implies that critical fluctuations are faster or slower than the accessible SR time window.
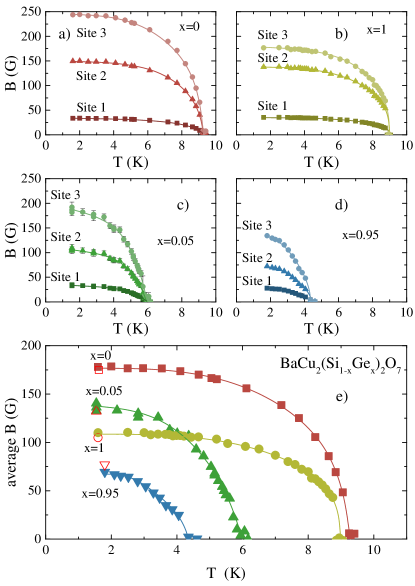
The parameter tended to 0 in the initial fits, and was later fixed to , as appropriate for a simple commensurate antiferromagnetic structure. The parameters , and are the mean precession frequencies at the three different muon sites in our model. They are related to the local internal magnetic fields on sites through with . The width of the corresponding field distributions are described by the relaxation rates , and . The latter were found to vary only slightly below . Upon introduction of disorder the relaxation rates increase considerably. Assuming that all the internal fields are proportional to the static ordered magnetic moment, the ratios were treated as temperature-independent parameters in each sample. The temperature dependence of the three internal fields for , 0.05, 0.95 and 1 are shown in Fig. 7 (a-d). They show typical order-parameter behavior. Within each sample, the saturation fields at the three sites are rather different. Their ratios are concentration-dependent. Fig. 7 (e) shows the temperature evolutions of the mean site-fields. These were calculated taking the respective populations of the three muon sites into account. One immediately sees that the saturation mean field and the ordering temperature decrease with disorder.
For the sample, the functional shape of the SR ZF-spectra changes and the three-site model is not applicable any more. As seen in Fig. 6, the spectrum at this concentration shows a fast decay at early times, followed by a slow and weak oscillation. Denoting the oscillating fraction as A1, and that with the fast decay as A2, for this concentration we used the following empirical fitting function:
| (3) | |||||
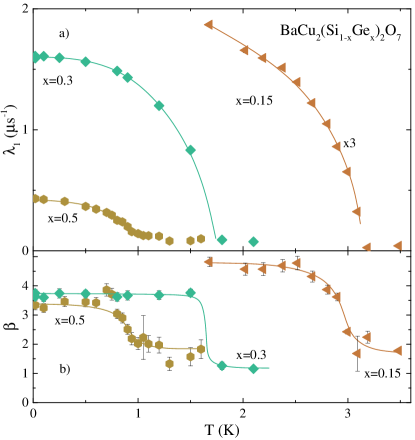
In these measurements, the background contribution was negligible. The ratio was fit globally with the resulting value of 1:1.336(4). In Eq. 3, is the frequency of oscillations. The phase was a global fit parameter for all temperatures yielding . The parameter is the damping rate of the oscillations. is temperature independent and negligibly small as in the previously described concentrations. In Eq. 3 the second term represents all muons that stop in rather different magnetically environments. The stretched exponential is an attempt to account for the corresponding broad distribution of internal magnetic fields, which leads to a superposition of multiple harmonic precession. The temperature dependency of the parameters and are shown in Fig. 8. Upon lowering the temperature, a strong increase of is observed at the transition point. Simultaneously, changes in a step-like fashion from , to . The high-temperature value is in agreement with our expectation for the paramagnetic phase,Yaouanc and Réotier (2011) while the high value at low temperature signals a broad unconvential distribution of local fields. The oscillation frequency increases below the ordering temperature, as expected.
For stronger disorder, in samples with and , the oscillatory contribution becomes indiscernible. The corresponding data were analyzed using only the stretched exponential function:
| (4) | |||||
As for , the stretch exponential describes the superposition of a distribution of oscillating frequencies. The second term is again related to the muon spin component parallel to the internal field. The non-negligible background contribution is due to muons stopped in the 3He-dilution refrigerator used in this run. A global fit for each sample gives and , for and . The temperature dependence of and are shown in Fig. 8. The exponent increases upon cooling through . Its saturation values at the lowest temperature are rather similar: for and for , respectively. In contrast, the relaxation rates are about 4 times shorter for , as compared to .
III.3.3 Fourier inversion
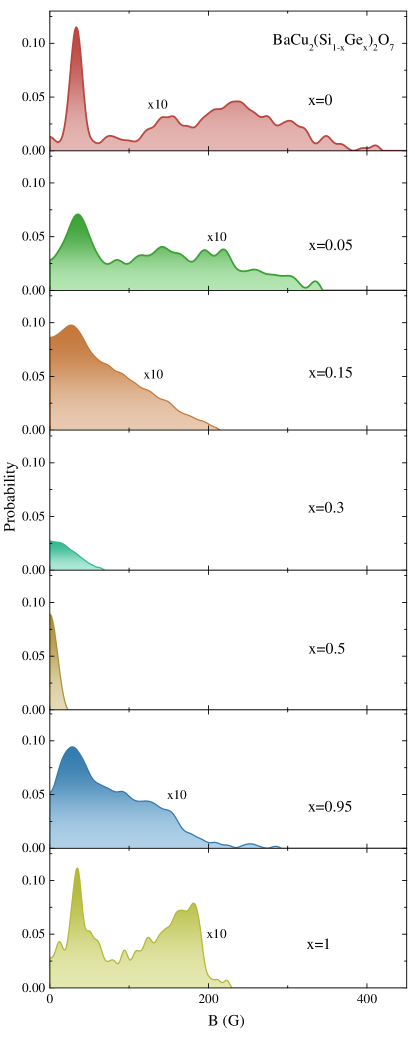
Additional information was obtained using an alternative, model-independent method to analyze the zero-field SR data. It is based on the fact that the muon time-spectra are temporal Fourier transforms of the probability distribution of the muon spin Larmor precession frequencies in the sample.Yaouanc and Réotier (2011) Thus, a Fourier transform of the measured spectra will yield the probability distribution of the modulus of internal fields. Before applying this procedure to our data, we subtracted the “tail” and background contributions determined in model fits, as described above. The result of the subsequent Fourier inversion is shown in Fig. 9. Both parent materials show two well pronounced peaks. A third maximum can be identified as a shoulder of the higher-field peak. The central positions of these features correspond to the fitted field values in our model-based data analysis. At 5% disorder on both ends we see a broadening of all features and a shift to smaller fields. At further higher concentrations the peaks merge and the probability weight builds up at very small fields. For and the probability maxima are actually at zero field.
IV Discussion
It is clear from the above that chemical disorder in BaCu2(Si1-xGex)2O7 does not eliminate the well-defined magnetic ordering transitions at low temperatures. On the other hand, it has two obvious and rather drastic effects on the ordered state. First, disorder tends to suppress the average spontaneous static magnetization and the ordering temperature. Second, it results in a broad distribution of magnitudes of local fields (static moments) in the sample. We shall address these two aspects of the observed behavior separately.
IV.1 Average ordered moment
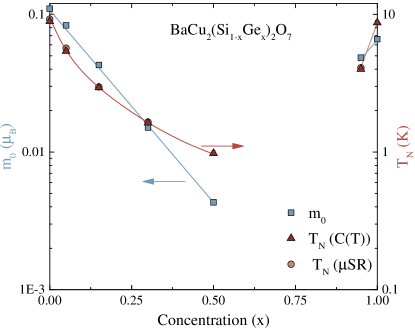
Despite the fact that several muon sites are involved, we shall make the assumption that the average ordered moment is proportional to the average local field seen by the muons. Implicitly, we are assuming that the muon stopping sites are the same across the Ge concentration range. In application to our data, the mean local field is readily obtained from the measured probability distribution shown in Fig. 9. For , a ,a moment of can be estimated from chain-Mean-Field (MF) theory, using the known values of and .Tsukada et al. (1999); Schulz (1986) Note the strong suppression of by quantum fluctuations enhanced by the system’s one-dimensionality. Using the chain-MF estimate as a “calibration point” for the measured mean local fields in other samples, in Fig. 4 we plot the saturation moment as a function of Ge concentration. Note the logarithmic -axis in this graph. As a consistency check, for the pure Ge sample, our procedure yields . This is only about 12% off the chain-MF estimate . One can thus hope that a 20% accuracy of our method holds for the entire Ge-concentration range.
Our analysis reveals a drastic suppression of the ordered moment already at very low levels of chemical randomness. This behavior emphasizes the quantum nature of the spin chains involved. In contrast, a classical antiferromagnet with fully saturated Néel sublattices would not be affected by bond disorder at all. Its ground state would remain the fully polarized two-sublattice state. In our case though, on the Si-rich end the decrease of is exponential. A similar (but somewhat less drastic) behavior was observed in the organic weakly coupled spin chain material Cu(py)2Cl1-xBrx (CPX)Thede et al. (2012). At the same time, these trends totally contradict chain-MF calculations for bond-disordered chains, where both and were predicted to increase.Joshi and Yang (2003)
IV.2 Distribution of ordered moment
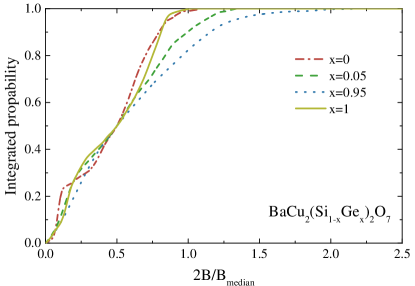
The most important result of this work is the study of the distribution of ordered moments in samples with bond randomness. This kind of analysis was not possible for our previous experiments on CPX.Thede et al. (2012) In the case of BaCu2(Si1-xGex)2O7, already the fact that the data are described by a stretched exponential relaxation with a large exponent indicates a very unconventional distribution of local fields. In fact, a substantial broadening of the field distribution is already present at very small disorder levels. The most unbiased way to visualize this, is by integrating the measured probability distributions, as shown in Fig. 10. Here the scale of the axis for each material is chosen so as to have their median field points coincide. We see that the magnitudes of local fields in both weakly disordered samples with and have a much broader relative distribution than in the parent material. In particular, the proportion of relatively large fields is substantially increased by disorder.
As mentioned above, the ordered moment in weakly coupled spin chains is suppressed by quantum spin fluctuations. Any bond strength disorder will modulate the strength of these quantum fluctuations in a spatially random manner. The result will be an inhomogeneous spatial distribution of ordered moments. However, it is clear that at least in our low-disorder samples, the inhomogeneity is not confined to the rare and isolated substitution sites. Indeed, for and , the vast majority of muons rest in a relatively homogeneous environment, similar to that in the corresponding parent compound. Rather, the broad distribution, as well as a disproportionate prevalence of relatively large local fields (moments), is due to the RS nature of the individual chains.
Consider a single random-bond chain. In the ordered phase, at the MF level, it is subject to a staggered field generated by neighbouring chains. The RS ground state can be viewed as a collection of non-interacting effective spin dimers.Ma et al. (1979); Dasgupta and Ma (1980); Fisher (1994) The probability distribution of the corresponding dimer coupling strengths is peaked at zero, i.e., there is an abundance of very weak effective dimers, that also will tend to involve physically distant spins.Ma et al. (1979); Dasgupta and Ma (1980); Fisher (1994) Each such dimer will get polarized by the staggered mean field. The resulting induced moment will be proportional to the dimer’s susceptibility, which, at low temperatures, is inversely proportional to . Thus, the distribution of magnetic moments will echo the distribution of inverse exchange constants. It will be very broad, and will have a disproportionate number of large moments. These are due to the particularly weak dimers in the RS state. Unfortunately, to date, neither the probability distribution nor the spatial distribution of ordered moments in weakly coupled RS chains have been addressed theoretically or numerically.
The inhomogeneous ground state will undoubtedly affect the low-energy excitations. A hint of this phenomenon is present in our calorimetry data. In the presence of disorder, quasimomentum ceases to be a good quantum number and the entire spin wave excitation picture breaks down. The observed decrease in the effective power law exponent signals a disproportional abundance of low-energy excitations. A decrease of specific heat is directly related to a modification. At this point we can only speculate that this is a consequence of the RS nature of the individual chains too. Undoubtedly more insight will come from further theoretical studies.
V Conclusion
In summary, even weak bond strength disorder strongly affects magnetic ordering in weakly coupled quantum spin chains. The average ordered moment is drastically suppressed. At the same time the distribution of local static moments is highly inhomogeneous, with a disproportionate number of relatively large moments. The thermodynamics of the ordered state is also affected. All this appears to be a direct consequence of “infinite disorder” in individual random-bond chains.
References
- Bethe (1931) H. Bethe, Z. Phys. 71, 205 (1931).
- Ma et al. (1979) S.-k. Ma, C. Dasgupta, and C.-k. Hu, Phys. Rev. Lett. 43, 1434 (1979).
- Dasgupta and Ma (1980) C. Dasgupta and S.-k. Ma, Phys. Rev. B 22, 1305 (1980).
- Fisher (1994) D. S. Fisher, Phys. Rev. B 50, 3799 (1994).
- Motrunich et al. (2000) O. Motrunich, S.-C. Mau, D. A. Huse, and D. S. Fisher, Phys. Rev. B 61, 1160 (2000).
- Tippie and Clark (1981) L. C. Tippie and W. G. Clark, Phys. Rev. B 23, 5846 (1981).
- Masuda et al. (2004) T. Masuda, A. Zheludev, K. Uchinokura, J.-H. Chung, and S. Park, Phys. Rev. Lett. 93, 077206 (2004).
- Masuda et al. (2006) T. Masuda, A. Zheludev, K. Uchinokura, J.-H. Chung, and S. Park, Phys. Rev. Lett. 96, 169908(E) (2006).
- Shiroka et al. (2011) T. Shiroka, F. Casola, V. Glazkov, A. Zheludev, K. Prsa, H.-R. Ott, and J. Mesot, Phys. Rev. Lett. 106, 137202 (2011).
- Casola et al. (2012) F. Casola, T. Shiroka, V. Glazkov, A. Feiguin, G. Dhalenne, A. Revcolevschi, A. Zheludev, H.-R. Ott, and J. Mesot, Phys. Rev. B 86, 165111 (2012).
- Tsukada et al. (1999) I. Tsukada, Y. Sasago, K. Uchinokura, A. Zheludev, S. Maslov, G. Shirane, K. Kakurai, and E. Ressouche, Phys. Rev. B 60, 6601 (1999).
- Zheludev et al. (2000) A. Zheludev, M. Kenzelmann, S. Raymond, E. Ressouche, T. Masuda, K. Kakurai, S. Maslov, I. Tsukada, K. Uchinokura, and A. Wildes, Phys. Rev. Lett. 85, 4799 (2000).
- Zheludev et al. (2001) A. Zheludev, M. Kenzelmann, S. Raymond, T. Masuda, K. Uchinokura, and S.-H. Lee, Phys. Rev. B 65, 014402 (2001).
- Kenzelmann et al. (2001) M. Kenzelmann, A. Zheludev, S. Raymond, E. Ressouche, T. Masuda, P. Böni, K. Kakurai, I. Tsukada, K. Uchinokura, and R. Coldea, Phys. Rev. B 64, 054422 (2001).
- Zheludev et al. (2002) A. Zheludev, E. Ressouche, I. Tsukada, T. Masuda, and K. Uchinokura, Phys. Rev. B 65, 174416 (2002).
- Oliveira (1993) J. Oliveira, Ph.D. thesis, Ruprecht-Karls-Universität (1993).
- Yamada et al. (2001) T. Yamada, Z. Hiroi, and M. Takano, Journal of Solid State Chemistry 156, 101 (2001), ISSN 0022-4596, URL http://linkinghub.elsevier.com/retrieve/pii/S0022459600989680.
- Zheludev et al. (2007) A. Zheludev, T. Masuda, G. Dhalenne, A. Revcolevschi, C. Frost, and T. Perring, Phys. Rev. B 75, 054409 (2007).
- Herbrych et al. (2013) J. Herbrych, J. Kokalj, and P. Prelovšek, Phys. Rev. Lett. 111, 147203 (2013), ISSN 0031-9007.
- Suter and Wojek (2012) A. Suter and B. Wojek, Physics Procedia 30, 69 (2012), ISSN 1875-3892.
- Yaouanc and Réotier (2011) A. Yaouanc and P. D. Réotier, Muon spin rotation, relaxation and resonance (Oxford University Press, 2011).
- Schulz (1986) H. J. Schulz, Phys. Rev. B 34, 6372 (1986).
- Thede et al. (2012) M. Thede, F. Xiao, C. Baines, C. Landee, E. Morenzoni, and A. Zheludev, Phys. Rev. B 86, 180407 (2012).
- Joshi and Yang (2003) A. Joshi and K. Yang, Phys. Rev. B 67, 174403 (2003).