A prompt extra component in the high energy spectrum of GRB 131108A
The high-fluence GRB 131108A at redshift z=2.4, was detected by the Mini-Calorimeter (MCAL, 0.35–100 MeV) and the Gamma-Ray Imaging Detector (GRID, 30 MeV – 30 GeV) onboard the AGILE satellite. The burst emission consisted of a very bright initial peak, lasting 0.1 s, followed by a fainter emission detected for 25 s with the MCAL and 80 s with the GRID. The AGILE spectra, when compared with those reported at lower energies, indicate the presence of a prominent high-energy component with peak energy in the 10–20 MeV region. Contrary to other GRBs, this high-energy component is present also during the initial peak, with power law photon index of about –1.6 below 10 MeV and –2.350.2 above 30 MeV.
Key Words.:
–1 Introduction
Despite the large number of observations obtained in the last few years by the Fermi and AGILE satellites, the emission of -ray bursts (GRBs) in the high-energy band (E ¿ 50 MeV) is still difficult to interpret.
A typical property of the GRBs emission in this band is its long duration, which can be one order of magnitude longer than that observed in the hard X-ray band.
Moreover, the onset of the high-energy emission is often delayed with respect to that at lower energies.
On longer time scales, the high-energy -ray light-curves decay with time as a power-law t-a, with (Ackermann et al., 2013).
Such a power-law decay is similar to that of the afterglow observed at longer wavelengths and suggests an external shock origin also for the high-energy -rays.
Also from the spectral point of view the high-energy -ray emission shows some peculiarities.
AGILE and Fermi observations have shown that several bursts exhibit a significant deviation from the Band law (Band et al., 1993), which was previously believed to give an adequate description of GRB emission also at high energies.
In fact, while for some GRBs the spectrum of the prompt emission can be fitted by a single Band function from tens of keV up to tens of GeV, in most cases the presence of an additional hard component at energies above some tens of MeV is required (Zhang et al., 2011).
The Gamma-Ray Imaging Detector (GRID, Tavani et al., 2009) on board the AGILE satellite is particularly suited for the observation of GRBs thanks to its large field of view (FOV), which covers one fifth of the sky in the 30 MeV – 30 GeV energy range, with a very short deadtime of 100 s.
The AGILE Mini-Calorimeter (MCAL), besides being exploited as part of the GRID, can be used to autonomously detect and study GRBs in the 0.35–100 MeV range with excellent timing (Labanti et al., 2009; Marisaldi et al., 2008).
AGILE has contributed to increase the number of high-energy observations revealing, so far, 6 GRBs with emission above
30 MeV (Giuliani et al., 2008, 2010; Del Monte et al., 2011; Longo et al., 2012).
Here we present the results obtained for the very energetic GRB 131108A with both the GRID and the MCAL instruments.
2 GRB 131108A
GRB 131108A was discovered by the Fermi/LAT instrument on November 8th, 2013 at 20:41:55.76 UTC (Racusin et al., 2013).
The burst spectrum at E 100 MeV is consistent with a power law with photon index –2.660.12 and an average flux of (101.3)10-9 erg cm-2 s-1
during the firsts 1500 s after the trigger time (Vianello et al., 2013) 111see also : http://www.asdc.asi.it/grblat.
At lower energies, GRB 131108A was detected with the Fermi Gamma-Ray Burst Monitor (GBM) in the range 10–1000 keV (Younes, 2013) and with the Konus/Wind instrument in the range 20 keV–10 MeV (Golenetskii et al., 2013). The spectra obtained by these two instruments are consistent with a Band function, with parameters E keV, , and for the Fermi/GBM and E keV, and for Konus/Wind.
The fluences measured by these two instruments were (3.65 erg cm-2 (Fermi/GBM) and (4.15 erg cm-2 (Konus/Wind).
The Swift satellite started to observe the Fermi error region of GRB 131108A 65 minutes after the trigger time (Evans, 2013; Stroh & Kennea, 2013a, b) and discovered the X-ray afterglow, with flux decaying as t-a, with =1.9, at the coordinates R.A.= 10h 26m 0.43s, Dec.=+09∘ 39′ 44.9.
A bright optical counterpart, with visual magnitude of 18.5, was found with the CAHA telescope about 7 hr after the GRB trigger(Gorosabel et al., 2013). Shortly later, an optical spectrum was obtained with the GTC telescope at the Roque de los Muchachos Observatory. Several absorption lines corresponding to Lyman-alpha and highly ionized metals were identified, giving a redshift =2.40 (de Ugarte Postigo et al., 2013; Xu et al., 2013). The optical afterglow rapidly faded below magnitude 20 in the following hours (Troja et al., 2013; Volnova et al., 2013).
At radio wavelengths a source consistent with the location of GRB 131108A was detected by the Very Large Array, with flux 200 Jy at 19 GHz about 2.6 days after the burst (Corsi et al., 2013).
3 Data analysis
The events collected by the AGILE/GRID detector are reconstructed and processed on board in order to reduce the Earth albedo photons and the particle background in the data transmitted to ground (Cocco et al., 2002; Longo et al., 2002; Giuliani et al., 2006).
The downloaded data are then reprocessed by the on-ground analysis software, which assigns to each event an arrival direction, an energy, and a flag related to the probability that the event was produced either by a gamma photon or a charged particle.
The events are hence divided into four classes: P (particles), L (limbo), S (single tracks) and G (gammas) in which the
residual contamination of the background is progressively reduced (Bulgarelli et al., 2010, 2012).
Similarly to what was done for other GRBs observed by AGILE (Giuliani et al., 2008, 2010; Del Monte et al., 2011), for the spectral and light curve analysis of GRB 131108A the events of the L, S and G classes were used.
This allows us to obtain an effective area larger than that used in the standard analysis of other -ray sources (based on G events only), especially at low energies. In the case of GRBs, the large source flux during short time intervals makes the background negligible compared to the signal.
Since November 2009 AGILE is observing the -ray sky in “spinning mode”.
In this operating mode, the satellite rotates around an axis perpendicular to the GRID field of view direction with a period of 7 minutes.
The sky position of GRB 131108A at the time of its onset was in the GRID FOV,
at an off-axis angle of 40∘, and it crossed the FOV during the following 110 s.
The smallest off-axis angle, 15∘, was reached at T0+50 s (here and in the following we define T0 = 20:41:55 UTC ).
During this first transit, the GRID detected 71 events (L+S+G class) with arrival direction within 20∘ from the burst position.
This corresponds to an excess of 5.5 above the background level (Giuliani et al., 2013).
In the following rotations of the satellite, the GRB region was observed again with the GRID several times, but no significant emission from the position of GRB 131108A was detected.
MCAL triggered on GRB 131108A and delivered, for every photon detected in the time interval [ T0–1.4 s, T0+32.8 s], energy information in the 0.35 - 100 MeV range and a time tag with 2 microsec accuracy.
4 Results
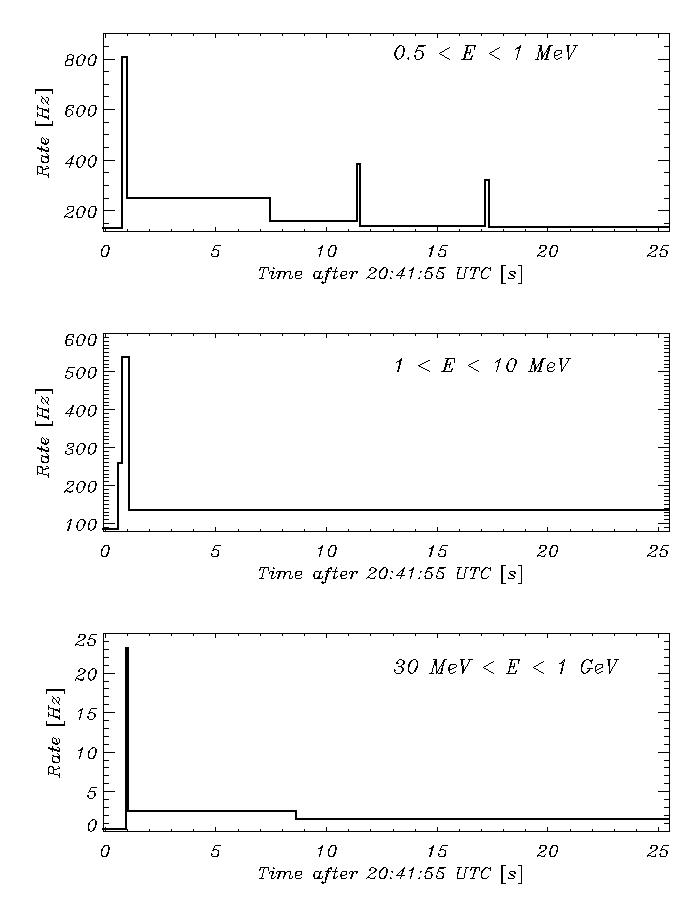
The light curves of GRB 131108A obtained with the MCAL and the GRID are shown in figure 1 for different energy bands.
The binning of these light curves was determined using the Bayesan block method (Scargle et al., 2013), which provides an objective representation of the data with a minimum number of a priori assumptions. GRB 131108A is characterized by a short (0.1 s) initial spike, visible at all energies, followed by a long tail of emission, which in the lower MCAL range remains above the background level for about 25 s.
We first extracted a spectrum from the MCAL data in the time interval from T0 to T s. A power-law fit in the energy range 0.5 E 10 MeV, gives a photon index of –1.900.13 and a fluence of (1.720.36)10-5 erg cm-2 in the range 0.4 - 20 MeV (, corresponding to a null hypothesis probability of 0.11).
We then examined the MCAL spectra corresponding to the initial pulse (from T0+0.79 s to T0 + 1.08 s) and to the tail (from T0 + 1.08 s to T s).
Power law fits gave a photon index of –1.540.08 () for the pulse and of –1.710.11 () for the tail.
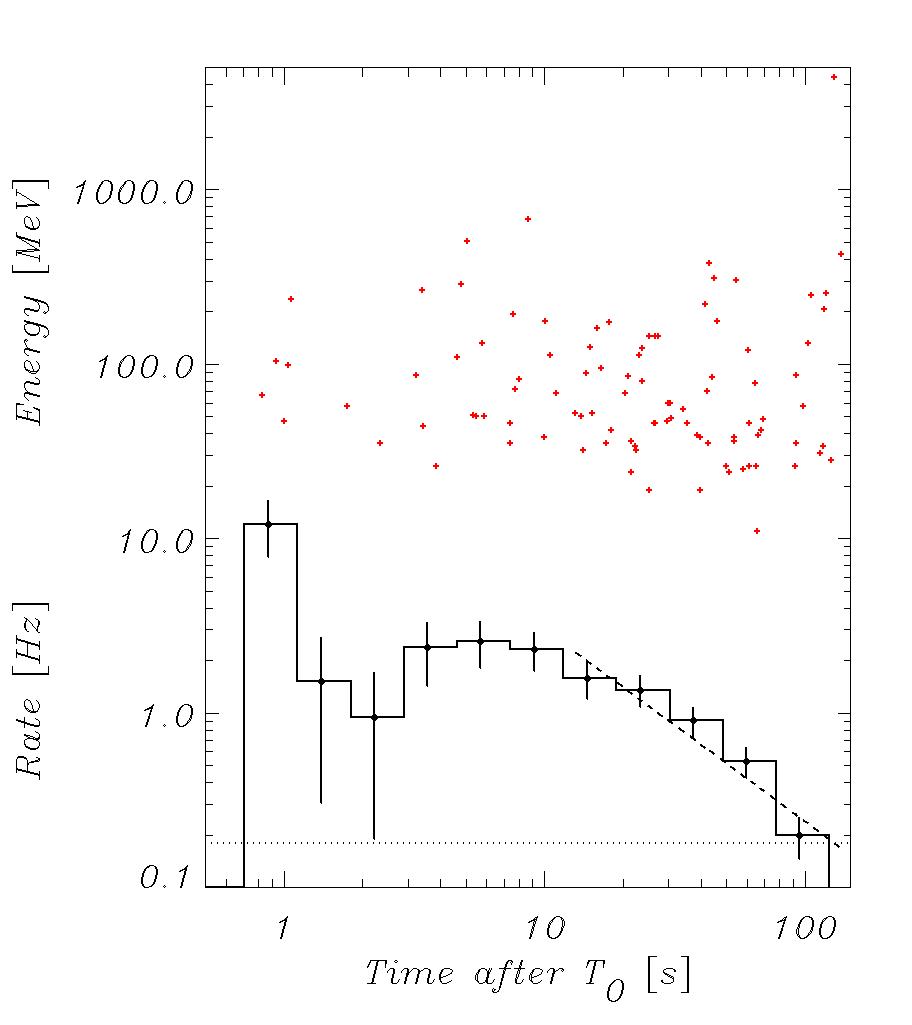
Figure 2 shows the GRID light curve in logarthimic time bins, obtained from the events with arrival directions within 20∘ from the position of GRB 131108A.
The energies of the individual photons are plotted in the upper part of the same figure.
After the bright initial peak, the GRID flux remained nearly constant for 20 s
and then decreased, reaching the background level (dotted line) after 80 s.
The GRID light curve after T0+20 s can be roughly fitted by a power-law F(t) t-a with a = 1.1.
The fluence in the 30 MeV – 1 GeV range from T0 to T0+80 s is (2.020.25) erg cm-2.
The small number of GRID counts does not allow us to carry out a detailed spectral analysis, but we can infer some spectral information from the observed ratio of counts below and above 100 MeV. This ratio is about 4:1, indicating a spectrum softer than that of the other GRBs observed by AGILE, for which the same selection of events gave a 1:1 ratio (see e.g. Giuliani et al., 2010).
Assuming a power-law spectrum, and taking into account the instrumental response,
the above ratio for GRB 131108A corresponds to a photon index of –2.350.2.
There is no evidence of changes in the spectrum during the GRB.
5 Discussion
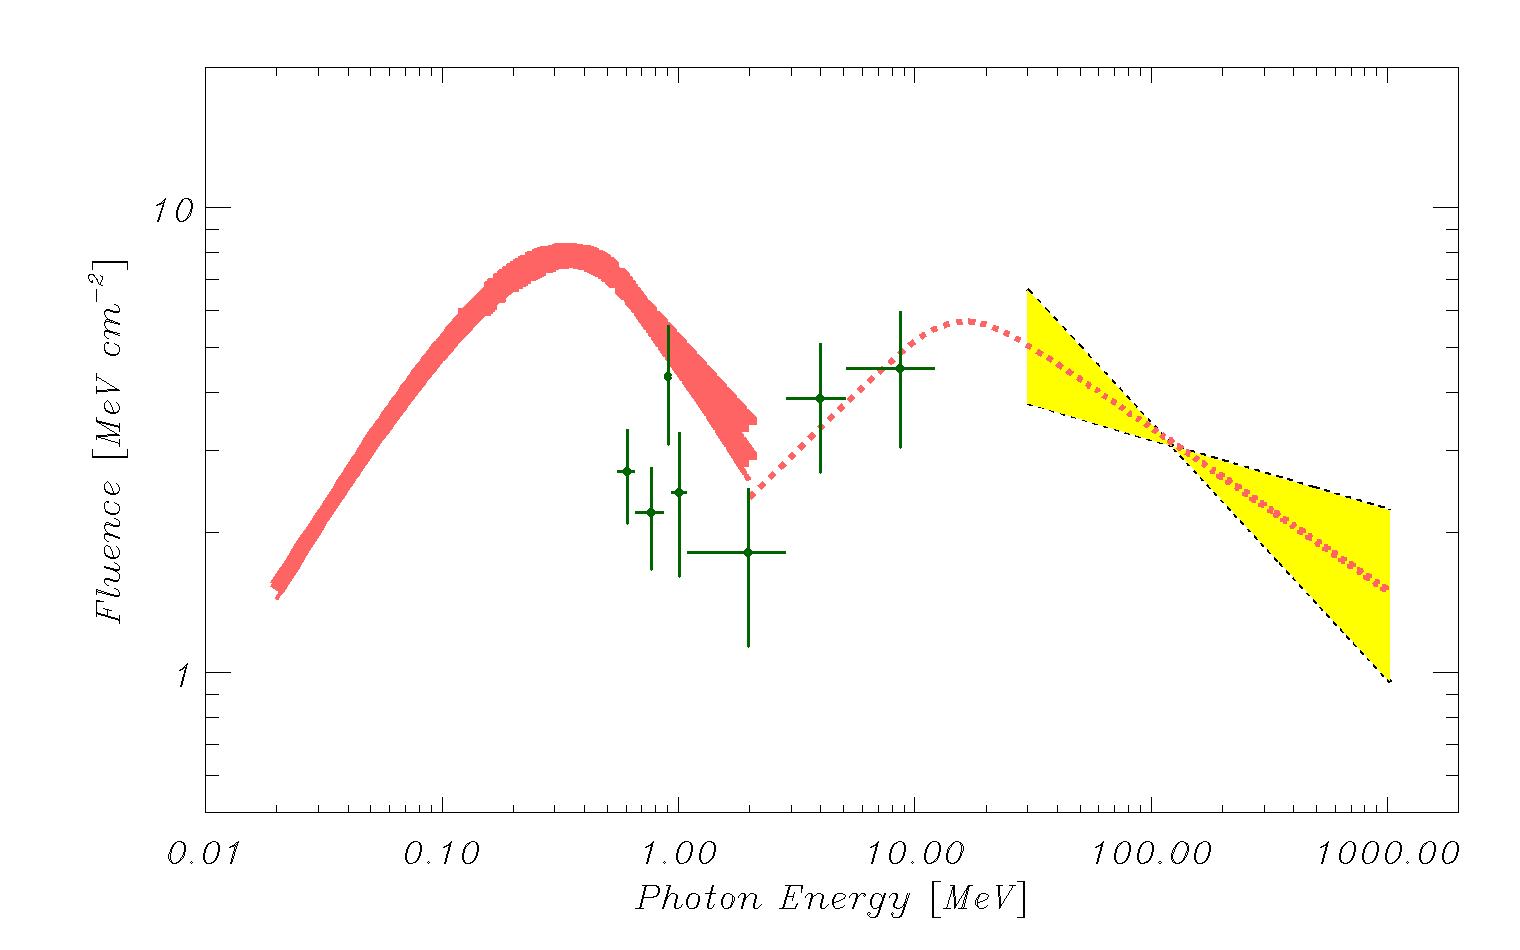
Figure 3 shows the combined MCAL plus GRID spectrum of the GRB emission from T0 to T0 + 25 s (the GRID flux given above has been rescaled proportionally to the number of events observed in this time interval assuming the same spectral slope measured for the entire observation).
For comparison we plot in the same figure the Konus/WIND spectrum for
approximately the same time interval as reported by Golenetskii et al. (2013).
The AGILE measurements are inconsistent with an extrapolation of the Konus-Wind data, indicating the presence of an additional spectral component
above a few MeV and with a broad peak between 10 and 20 MeV.
The MCAL and GRID spectra can be connected by a smoothly broken power-law (dotted line in figure 3) with 15 MeV and indices –1.5 and –2.35.
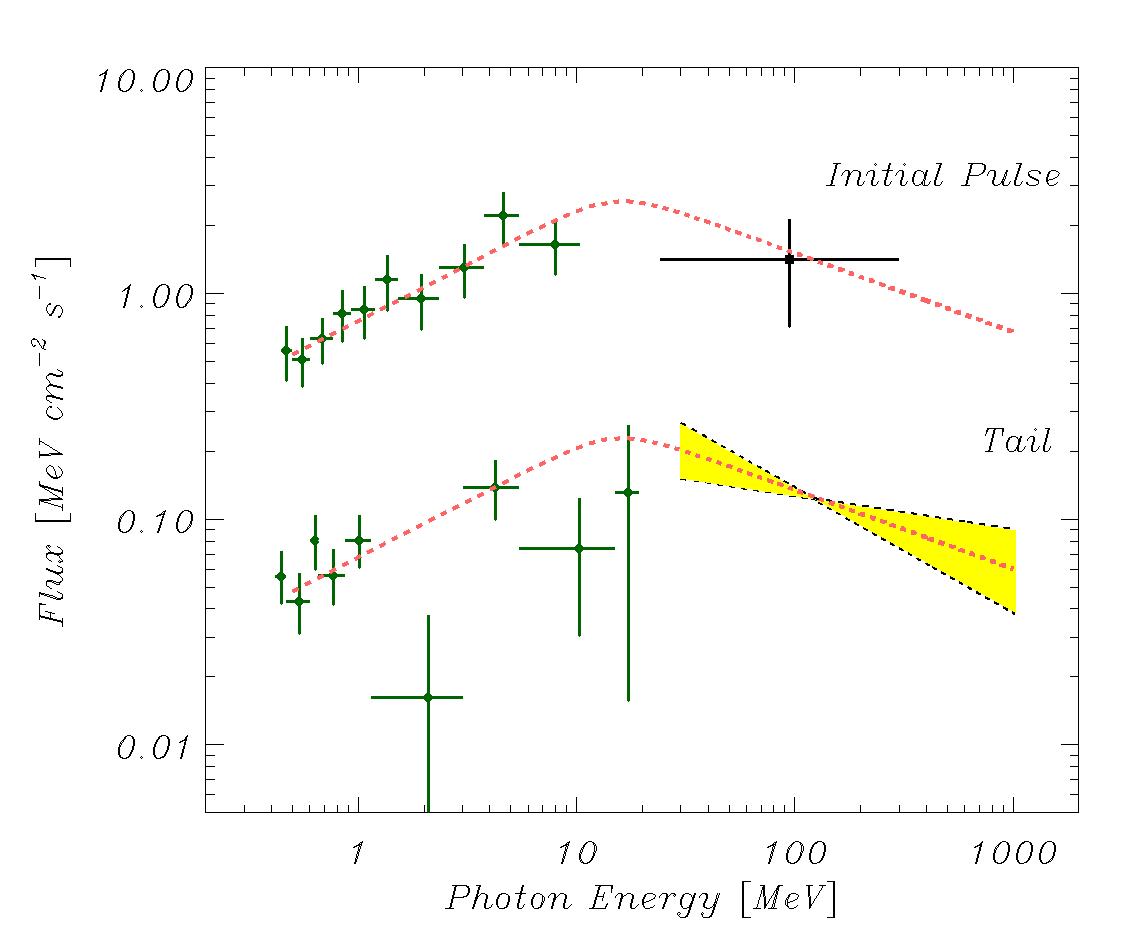
To better investigate the origin of this high-energy component, we consider separately the spectra of the initial pulse.
This is done in figure 4, which shows the MCAL spectrum from T0 + 0.79 s to T0 + 1.08 s and the GRID flux obtained from the 5 photons detected in the same time interval. The error bar of the GRID flux includes, besides the statistical error, the systematics due to the uncertainties in the photon energies and effective area. The MCAL data indicate that the extra-component peaking in the 10–20 MeV region, is already present during the initial pulse.
The lower spectra in Fig.4 correspond to the burst tail (T0 + 1.08 to T s).
An extra component in the high-energy spectrum has been already observed in other GRBs, such as 080916C, 090510, 090902B, 090926A and 110731A (Ackermann et al., 2013; Giuliani et al., 2010).
However in these bursts the extra component showed a delayed onset with respect to the low energy component described by the Band component.
This behaviour is naturally explained in the early afterglow models (Kumar & Barniol Duran, 2009; Ghisellini et al., 2010; De Pasquale et al., 2010; Razzaque, 2010) predicting that the high-energy emission is generated in the external shock.
However, for GRB 131108A, the similarity of the light curves and the lack of a delay in the extra component suggest that the two spectral components in this case are related and arise from the same emission site.
One possibility is that the extra component in the spectrum is produced by Compton upscattering of the Band component (see e.g. Bošnjak et al., 2009; Toma et al., 2011).
Alternatively it could be due to synchrotron emission from hadrons (Asano et al., 2009; Razzaque et al., 2010).
6 Conclusions
In a few respects the properties of GRB 131108A are in line with those of other GRBs detected above a few tens of MeV:
it had a large fluence in the hard X-ray/soft -ray range and its high-energy emission decayed with time as a power law. The AGILE data reported give evidence of the presence of a spectral component peaking in the 10–20 MeV region with fluence of 3.310-5 erg cm-2 (E ¿ 2 MeV), in addition to that seen below 10 MeV and well fit by a Band function in the data of other satellites.
The high redshift of GRB 131108A (z=2.4) makes it one of the most distant GRBs seen in high-energy -rays. Furthermore, its large fluence (in the top 10% of the bursts in the Fermi/GBM catalog (Goldstein et al., 2012)) implies a large intrinsic energy. Assuming standard cosmological parameters (, , ) its isotropic energies are ( erg, for the Band component, and erg for the additional spectral component found by AGILE.
The high value of the fluence and the isotropic luminosity put this event in the small class of hyperfluent GRBs.
It is also interesting to note that the prominent spectral component detected by AGILE above the observed energy of 10 MeV is peaking in the burst rest frame at MeV. Modelling this extra component is of the greatest importance, and it will be the subject of forthcoming investigations.
References
- Ackermann et al. (2013) Ackermann, M., Ajello, M., Asano, K., et al. 2013, ApJS, 209, 11
- Asano et al. (2009) Asano, K., Inoue, S., & Mészáros, P. 2009, ApJ, 699, 953
- Band et al. (1993) Band, D., Matteson, J., Ford, L., et al. 1993, ApJ, 413, 281
- Bošnjak et al. (2009) Bošnjak, Ž., Daigne, F., & Dubus, G. 2009, A&A, 498, 677
- Bulgarelli et al. (2010) Bulgarelli, A., Argan, A., Barbiellini, G., et al. 2010, Nuclear Instruments and Methods in Physics Research A, 614, 213
- Bulgarelli et al. (2012) Bulgarelli, A., Chen, A. W., Tavani, M., et al. 2012, A&A, 540, A79
- Cocco et al. (2002) Cocco, V., Longo, F., & Tavani, M. 2002, Nuclear Instruments and Methods in Physics Research A, 486, 623
- Corsi et al. (2013) Corsi, A., Cenko, S. B., & Perley, D. A. 2013, GRB Coordinates Network, 15502, 1
- De Pasquale et al. (2010) De Pasquale, M., Schady, P., Kuin, N. P. M., et al. 2010, ApJ, 709, L146
- de Ugarte Postigo et al. (2013) de Ugarte Postigo, A., Thoene, C. C., Gorosabel, J., et al. 2013, GRB Coordinates Network, 15470, 1
- Del Monte et al. (2011) Del Monte, E., Barbiellini, G., Donnarumma, I., et al. 2011, A&A, 535, A120
- Evans (2013) Evans, P. A. 2013, GRB Coordinates Network, 15465, 1
- Ghisellini et al. (2010) Ghisellini, G., Ghirlanda, G., Nava, L., & Celotti, A. 2010, MNRAS, 403, 926
- Giuliani et al. (2006) Giuliani, A., Cocco, V., Mereghetti, S., Pittori, C., & Tavani, M. 2006, Nuclear Instruments and Methods in Physics Research A, 568, 692
- Giuliani et al. (2010) Giuliani, A., Fuschino, F., Vianello, G., et al. 2010, ApJ, 708, L84
- Giuliani et al. (2013) Giuliani, A., Longo, F., Verrecchia, F., et al. 2013, GRB Coordinates Network, 15479, 1
- Giuliani et al. (2008) Giuliani, A., Mereghetti, S., Fornari, F., et al. 2008, A&A, 491, L25
- Goldstein et al. (2012) Goldstein, A., Burgess, J. M., Preece, R. D., et al. 2012, ApJS, 199, 19
- Golenetskii et al. (2013) Golenetskii, S., Aptekar, R., Frederiks, D., et al. 2013, GRB Coordinates Network, 15480, 1
- Gorosabel et al. (2013) Gorosabel, J., Mottola, S., de Ugarte Postigo, A., Hellmich, S., & Proffe, G. 2013, GRB Coordinates Network, 15469, 1
- Kumar & Barniol Duran (2009) Kumar, P. & Barniol Duran, R. 2009, MNRAS, 400, L75
- Labanti et al. (2009) Labanti, C., Marisaldi, M., Fuschino, F., et al. 2009, Nuclear Instruments and Methods in Physics Research A, 598, 470
- Longo et al. (2002) Longo, F., Cocco, V., & Tavani, M. 2002, Nuclear Instruments and Methods in Physics Research A, 486, 610
- Longo et al. (2012) Longo, F., Moretti, E., Nava, L., et al. 2012, A&A, 547, A95
- Marisaldi et al. (2008) Marisaldi, M., Labanti, C., Fuschino, F., et al. 2008, A&A, 490, 1151
- Racusin et al. (2013) Racusin, J. L., Zhu, S., Kocevski, D., et al. 2013, GRB Coordinates Network, 15464, 1
- Razzaque (2010) Razzaque, S. 2010, ApJ, 724, L109
- Razzaque et al. (2010) Razzaque, S., Dermer, C. D., & Finke, J. D. 2010, The Open Astronomy Journal, 3, 150
- Scargle et al. (2013) Scargle, J. D., Norris, J. P., Jackson, B., & Chiang, J. 2013, ApJ, 764, 167
- Stroh & Kennea (2013a) Stroh, M. C. & Kennea, J. A. 2013a, GRB Coordinates Network, 15468, 1
- Stroh & Kennea (2013b) Stroh, M. C. & Kennea, J. A. 2013b, GRB Coordinates Network, 15474, 1
- Tavani et al. (2009) Tavani, M., Barbiellini, G., Argan, A., et al. 2009, A&A, 502, 995
- Toma et al. (2011) Toma, K., Wu, X.-F., & Mészáros, P. 2011, MNRAS, 415, 1663
- Troja et al. (2013) Troja, E., Butler, N., Watson, A. M., et al. 2013, GRB Coordinates Network, 15482, 1
- Vianello et al. (2013) Vianello, G., Omodei, N., Racusin, J., & Ohno, M. 2013, GRB Coordinates Network, 15472, 1
- Volnova et al. (2013) Volnova, A., Krugly, Y., Inasaridze, R., et al. 2013, GRB Coordinates Network, 15484, 1
- Xu et al. (2013) Xu, D., Malesani, D., & Pursimo, T. 2013, GRB Coordinates Network, 15471, 1
- Younes (2013) Younes, G. 2013, GRB Coordinates Network, 15477, 1
- Zhang et al. (2011) Zhang, B.-B., Zhang, B., Liang, E.-W., et al. 2011, ApJ, 730, 141