Physical properties, kinematics and mass function of 12 northern infrared dark clouds
Abstract
The physical, chemical and kinetic characteristics of 12 northern infrared dark clouds (IRDCs) are systematic studied using the (1-0) and (1-0) lines, observed with the PMO 13.7 m radio telescope, the 1.1 mm Bolocam Galactic Plane Survey (BGPS) data and GLIMPSE Spitzer IRAC data. The molecular lines emission and 1.1 mm continuum emission almost coincide in morphology for each IRDC and both are associated well with the IRDCs. 10 IRDCs present the filamentary structure and substructures. Totally, 41 IRDC cores are identified and a statistic research for them shows that the northern IRDC cores have a typical excitation temperature K, a integrated intensity ratio of to and the column density . About of the IRDC cores are gravitationally bound, which are more compact, warmer and denser. In addition, we study the mass distribution functions of the whole IRDC cores as well as the gravitational bound cores, finding that they almost have the same power-law indexes. This indicates that the evolution of the IRDC cores almost have no effect on the mass spectrum of the molecular cores and thus can be used to study the stellar initial mass function. Moreover, three IRDC cores G24.00-3, G31.38-1 and G34.43-4 are detected to have large-scaled infall motions. Two different outflows are further found for IRDC core G34.43-4 and one of them is in high collimation.
keywords:
astrochemistry: column density — ISM: IRDCs — ISM: clouds — stars: formation — ISM: molecules1 Introduction
Despite massive stars play an important role in determining the galactic environment and enrichment, the formation and protostellar evolution of massive stars (M) is still unclear. In addition, observing the earliest evolutionary stages of massive stars directly is a challenging task, due to their rarer numbers, farther distances and forming predominantly in clusters. However, if we can unveil the mystery of massive star formation, it will be of primary importance to learn about the evolution of galaxy. Whatever, investigations of high-mass star cores are important to answer a central question in star formation: How do star formation processes produce the stellar initial mass function (IMF)?
Infrared Dark Clouds (IRDCs) have been proposed to be the birthplace of massive stars and their host clusters (Egan et al., 1998; Carey et al., 1998; Rathborne et al., 2006). Infrared dark clouds (IRDCs) are first discovered to be dark silhouettes against the bright galactic mid-infrared background by the infrared Space Observatory (ISO) surveys (Perault et al., 1996) and the Midcourse Space Experiment (MSX) (Carey et al., 1998; Egan et al., 1998). Previous molecular lines and dust continuum researches suggested that IRDCs were the cold ( K), dense () and high column density () clouds, with a scale of pc and a mass of (Egan et al., 1998; Carey et al., 1998, 2000; Rathborne et al., 2006). Furthermore, strong mm or sub-mm dust emissions have been detected in the IRDC cores (Beuther et al., 2005; Rathborne et al., 2005, 2006, 2008). All of these properties imply that IRDCs are excellent candidates for hosting the very early stages of massive star formation.
While Simon et al. (2006) established a catalogue of MSX IRDCs containing 10,931 sources and Peretto & Fuller (2009) catalogued 11,303 IRDCs using the Spitzer GLIMPSE and MIPSGAL archive data. The studies aiming at the distributions of the IRDCs demonstrated that most IRDCs concentrated on the so-called Galactic molecular ring in the first galactic quadrant (Simon et al., 2006) and the first-quadrant combining with the four-quadrant IRDCs closely followed the Scutum-Centaurus arm (Jackson et al., 2008), implying that IRDCs had some relationship with massive star formation. Five evolutional stages were proposed by Chambers et al. (2009) through his investigation towards 190 cores of 38 IRDCs. Recently, a great number of works focus on the chemistry in the IRDCs (e.g. Vasyunina et al., 2011; Sanhueza et al., 2012; Liu et al., 2013; Miettinen, 2014), in order to find out the perfect molecular tracers to different evolutional phases, the elemental abundance, the chemical clocks and all kinds of differences as well as relations between various molecules.
The molecule is relatively abundant and is likely to be optically thin in the molecular clouds. Therefore, it can be used to study the structures and densities of the clouds. In this paper, we make mapping observations towards 12 northern IRDCs in (1-0) and (1-0) lines to study the physical and chemical properties, kinematics and core mass functions of the northern IRDC cores. In the remaining part of this work, section 2 describes the source selection, the data achieve and the data reduction. Section 3 details the direct results and section 4 gives a discussion of the star formation activities in three IRDC cores and core mass functions. Finally, we summarizes our conclusions in Section 5.
2 Data Achieve
2.1 Source selection
To make sure the selected sources are really IRDCs and cover more IRDCs in our observed regions, we have observed all the IRDC sources from Parsons et al. (2009) which are accessible from the Purple Mountain Observatory. This IRDC sample is likely to contain a number of clumps in the different evolutionary stages, ranging from IR-dark clumps to HII regions with bright IR emission. This unbiased selection increases the credibility and representativeness to explore the whole physical, chemical and dynamical properties of the IRDCs in the northern sky, since currently we have no way to observe all the IRDCs in the northern sky.
2.2 Observation
The observations towards the IRDCs in (1-0), (1-0) and (1-0) lines were carried out with the Purple Mountain Observatory (PMO) 13.7 m radio telescope in May 2012. The new 9-beam array receiver system in single-sideband (SSB) mode was used as front end. FFTS spectrometers were used as back end, which had a total bandwidth of 1 GHz and 16384 channels, corresponding to a velocity resolution of 0.16 km for (1-0) and 0.17 km for (1-0) and (1-0). (1-0) was observed at upper sideband, while (1-0) and O (1-0) were observed simultaneously at lower sideband. The half-power beam width (HPBW) was and the main beam efficiency was . The pointing accuracy of the telescope was better than . The system noise temperature () in SSB mode varied between 150 K and 400 K. The On-The-Fly (OTF) observing mode was applied. The antenna continuously scanned a region of with a scan speed of for each IRDC. However, the edges of the OTF maps were very noisy and thus only the central regions were selected to be further analyzed. Since CO is the second abundant molecule in the Milky Way galaxy, its spectra can be easily affected by the objects along the line of sight, so were our (1-0) observation data. Therefore, we did not use the (1-0) observation data. The rms noise level was 0.1-0.2 K for (1-0) and (1-0). The data were reduced by the software CLASS (Continuum and Line Analysis Single-Disk Software) and GREG (Grenoble Graphic).
Of the IRDC regions observed, only 12 were detected with a signal to noise ratio of 3 or greater and only these well detected regions are discussed further. One (MSXDC G28.61-00.26) of them actually has two IRDCs overlaid in the sight of line and we distinguish them with MSXDC G28.61-00.26(a) and MSXDC G28.61-00.26(b). And compared our sample with the previous researches, we find that some of our IRDCs were studied in detail at continuum emissions and molecular lines emissions (e.g. Sakai et al., 2013; Xu et al., 2013; Pitann et al., 2013) or contained in a sample of the previous statistic studies (Rathborne et al., 2006; Du & Yang, 2008; Sanhueza et al., 2012), but the northern IRDCs have never been observed in such large scale and number in (1-0), (1-0) and (1-0) lines. This will be the first time. And we will probably to obtain some typical characteristics and statistical properties of the IRDCs in the northern sky through analyzing this sample.
2.3 Survey Data
The 1.1 mm radio continuum emission data were obtained from the Bolocam Galactic Plane Survey (BGPS)111http://irsa.ipac.caltech.edu/data// (Glenn et al., 2009). The BGPS was one of the first large-area, systematic continuum surveys of the northern Galactic plane in the millimeter regime, spanning the entire first quadrant of the Galaxy with a latitude range of deg from the Galactic plane and portions of the second quadrant and covering total 220 at resolution (Aguirre et al., 2011).
We also downloaded the 8 m data from the Galactic Legacy Infrared Mid-Plane Survey Extraordinaire (GLIMPSE)222http://irsa.ipac.caltech.edu/data/SPITZER/GLIMPSE, which was a mid-infrared survey of the inner Galaxy performed with the Spitzer Space Telescope in a number of mid-infrared wavelength bands at 3.6, 4.5, 5.8 and 8 m using the Infrared Array Camera (IRAC), which had an angular resolution between and (Fazio et al., 2004; Werner et al., 2004).
3 Results
3.1 Morphologies of the IRDCs
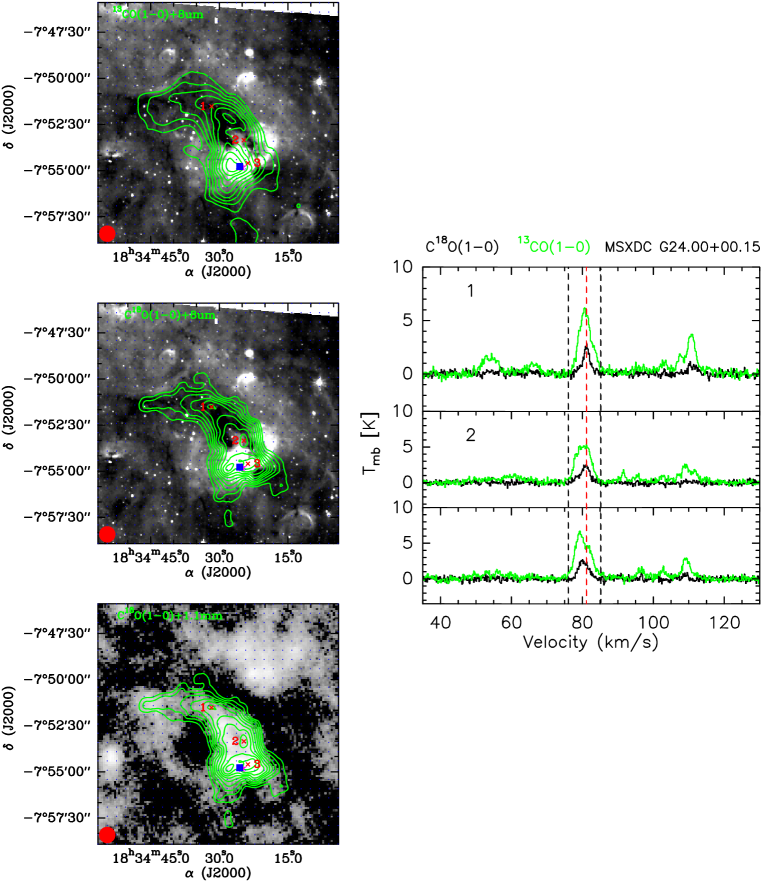
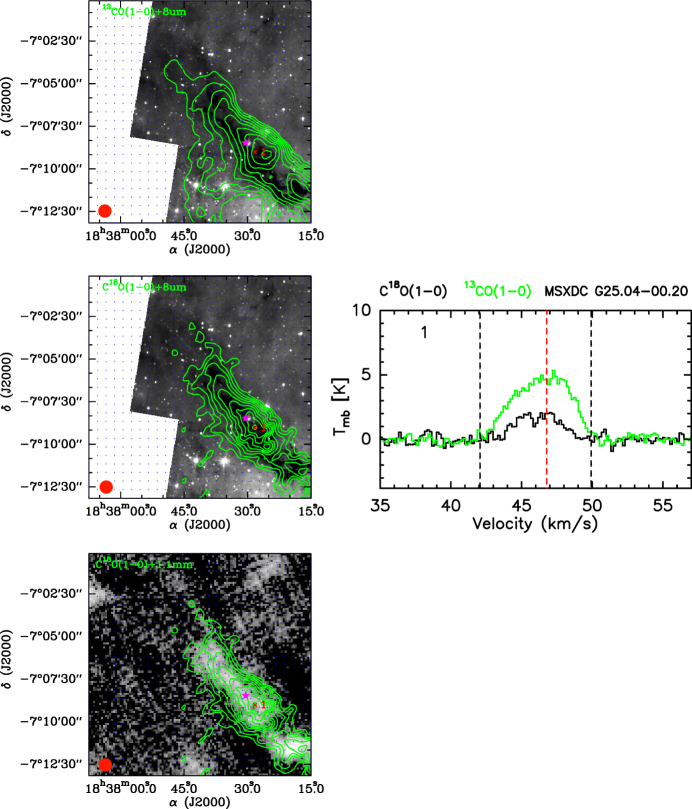
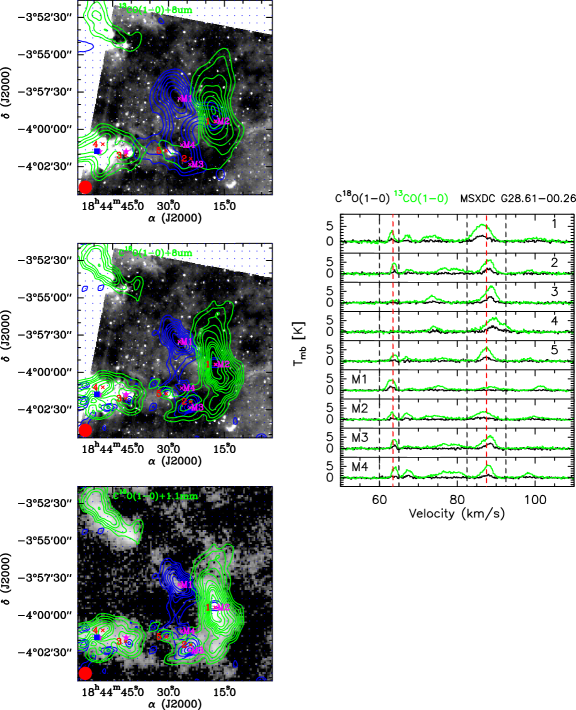
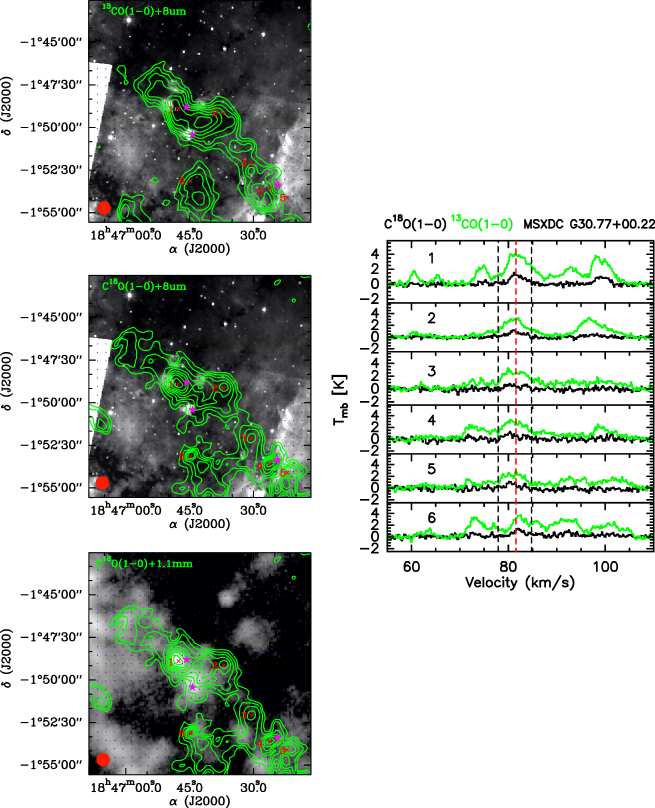
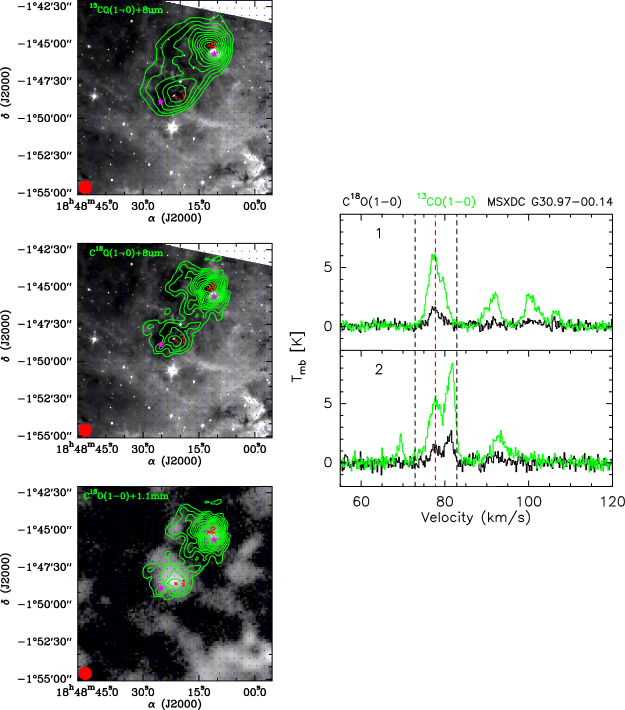
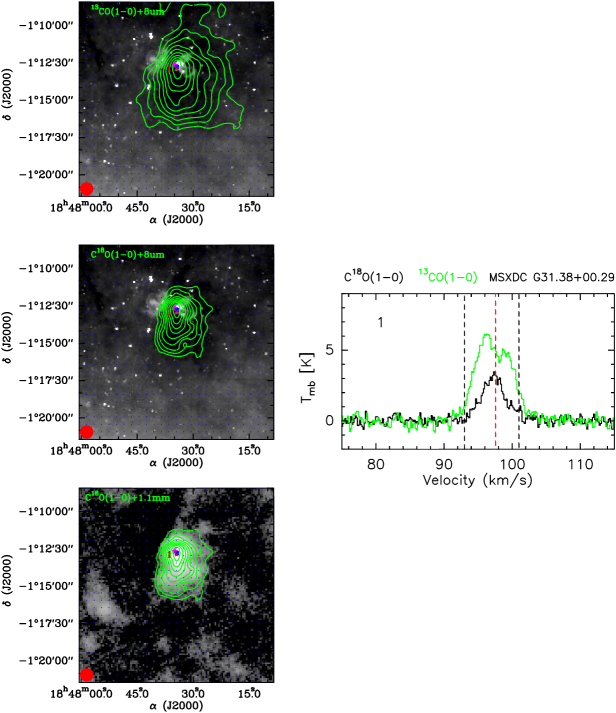
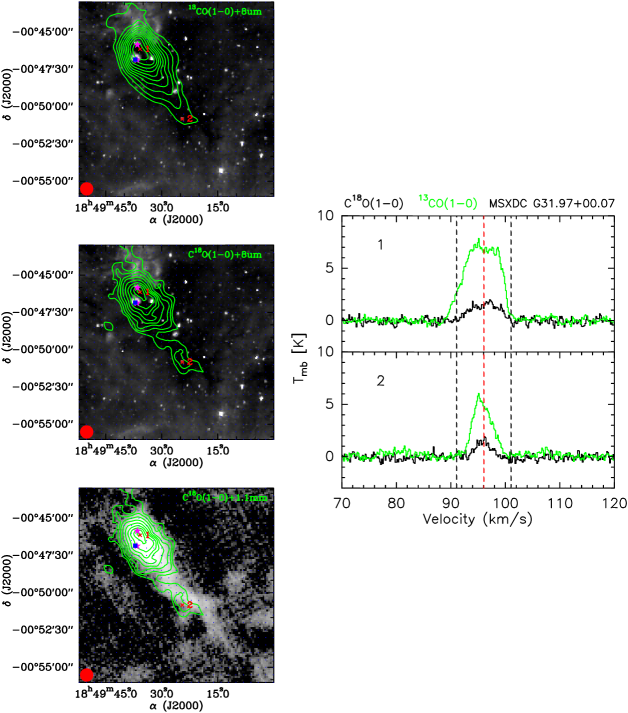
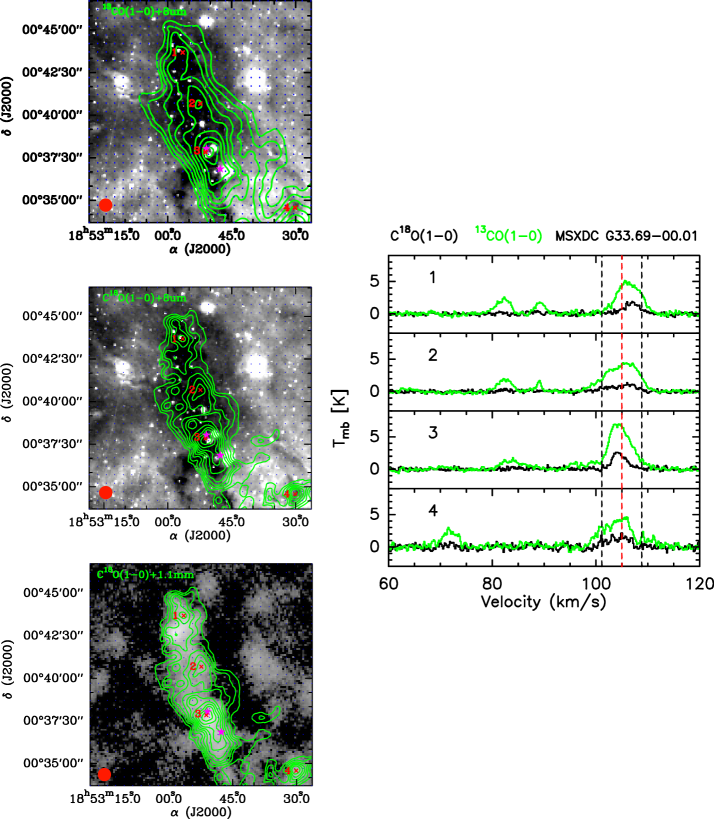
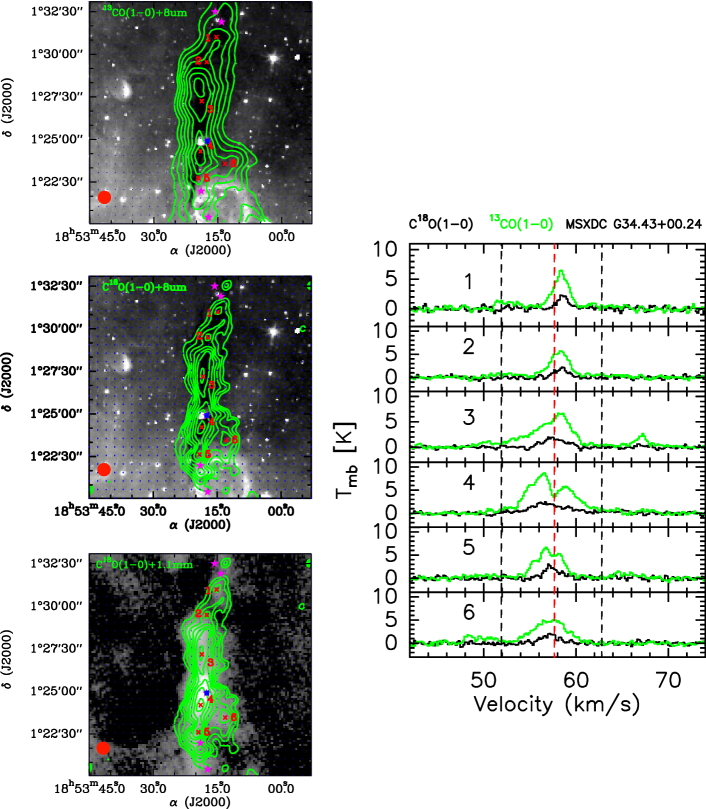
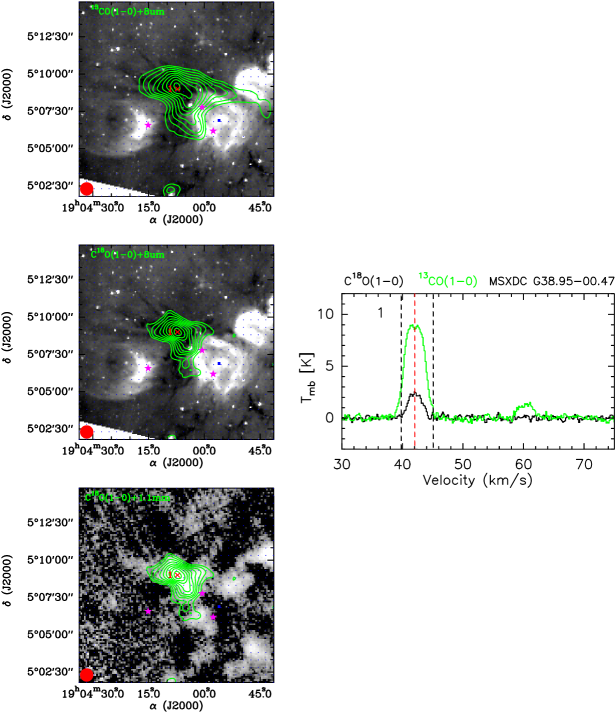
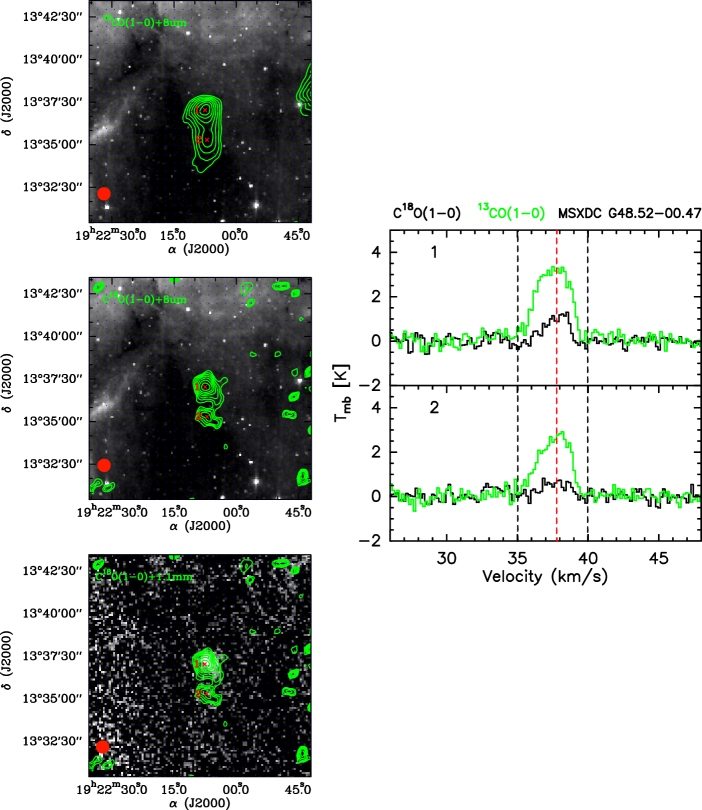
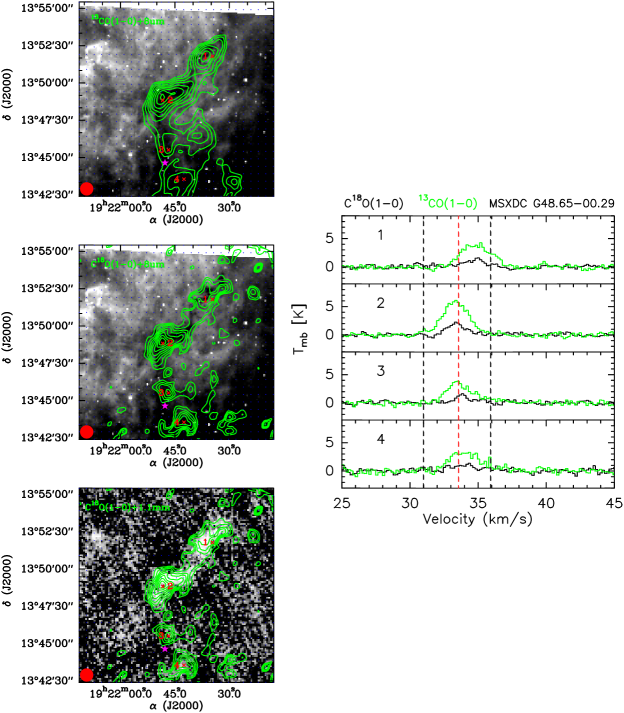
Figure 1 shows the integrated intensity maps of (1-0) and (1-0) overlaying on Spitzer 8 m emission and on the 1.1 mm continuum emission for each IRDC, respectively. From Figure 1, We find that the distributions of the molecule are associated well with the IRDCs, exhibited by the high Spitzer 8 m dark extinction, as well as with the 1.1 mm dust emission. Besides, 10 IRDCs are filamentary structures and these filamentary IRDCs are fragmented into several heterogeneous cores, but the remaining two compact IRDCs: MSXDC G31.38+00.29 and G38.95-00.47 do not and just show one compact core. This suggests that filamentary should be the typical shape for the IRDCs and can provide the place for the cluster-formation. In total, 41 cores are identified according to the contour peaks in the C18O integrated intensity and their center positions are marked by the red crosses in the maps and listed in Table 1. The comparison between the core centers with the peaks of the 1.1 mm dust continuum emission shows that they seem to coincide for all the cores within the beam of our observation. This indicates that is definitely not very optically thick. Actually it is optically thin in these IRDC cores according to the estimation in Section 3.4 and consequently can be used to trace the dense or central regions of the IRDC cores. While for the (1-0) emission, they are also associated well with the IRDCs and almost have the same shapes with the (1-0) emission but more extended. In fact, the integrated intensity maps of do not show the cores as many as those of and the peaks of the emission often offset a few tenths or even a few arcminutes from those of the emission and 1.1 mm dust emission. Hence, it is probable that the molecule is optically thick in the IRDCs and can trace the relatively external regions. We demonstrate this possibility in Section 3.4 and utilize it to study the kinematics characteristics of the IRDCs.
Additionally, we examine the environment for every core and present the associated HII/UCHII regions (fill blue square) and IRAS sources (the purple stars) for them, which are identified from SMBAD 333http://simbad.u-strasbg.fr/simbad/. You can see in Figure 1. In addition, we find a new fact that MSXDC G28.61-00.26 actually is two different IRDCs distributed in the same line of sight with the kinematical distances of 3.6 kpc and 4.6 kpc, separately. We name them to be MSXDC G28.61-00.26(a) and MSXDC G28.61-00.26(b) and show their the integrated intensity maps in blue color for (a) and green color for (b) in Figure 1, respectively. And MSXDC G25.04-00.20 has the same name with an IRDC in Rathborne et al. (2006), but it is definitely a new source with a different morphology and distributes in a different place.
3.2 The extracted spectra from the centers of the IRDC cores
The molecular spectra showed in Figure 1 are extracted from the center of each IRDC core. The (1-0) and (1-0) lines present several velocity components along the line of sight observations. In order to determine the systemic velocity and the velocity range of very IRDC, we draw the channel maps in (1-0) and (1-0) lines for each IRDC. The red dash lines in the spectra mark the systemic velocities of the IRDCs and the velocity components between the black dash lines represent the velocity ranges associated with the IRDCs, which is listed in Table 1. From the extracted spectra, we can find that the (1-0) lines are much stronger than the (1-0) lines and show various shapes, such as Gauss shape, blue profile, red profile and double components, actually indicating different dynamical information. It will be discussed in Section 4.1. We make Gauss fits to the marked velocity components and obtain the fitting parameters of 40 IRDC cores (IRDC core MSXDC G28.61-00.26-M4 is excluded because the spectrum of its has too bad SNR to fit. Therefore, we will not consider it in the following part.), which are listed in Table 1.
3.3 Distance
In section 3.2, We get the central line velocities towards the 12 northern IRDCs from the Gauss fits, respectively. Giving is optically thin in the IRDCs, it can trace the regions nearer to the centers of the molecular clouds than . Therefore, we use the average of the lines to determine the distances of the IRDCs through the rotation curve of Reid et al. (2009) (, ). The derived distances of the 12 northern IRDCs are presented in Table 2 column 2 and are in the range of kpc.
| MSX | RA | DEC | range | |||||||||
|---|---|---|---|---|---|---|---|---|---|---|---|---|
| ID | ||||||||||||
| (MSXDC) | (J2000.0) | (J2000.0) | (K) | (K) | ||||||||
| G24.00+00.15 | 18:34:30.25 | -07:52:24.5 | 75-85 | |||||||||
| 1 | 18:34:31.67 | -07:51:31.1 | 5.75(0.28) | 25.84(0.37) | 80.81 (0.03) | 4.29(0.07) | 2.34(0.23) | 6.61(0.30) | 81.15 (0.04) | 2.41(0.13) | ||
| 2 | 18:34:24.59 | -07:53:20.9 | 5.45(0.30) | 27.43(0.39) | 80.26 (0.03) | 4.92(0.08) | 2.21(0.21) | 8.06(0.27) | 80.76 (0.05) | 3.32(0.13) | ||
| 3 | 18:34:23.70 | -07:54:35.7 | 6.74(0.30) | 31.53(0.39) | 80.14 (0.03) | 4.84(0.09) | 2.51(0.26) | 8.45(0.34) | 80.32 (0.06) | 3.26(0.14) | ||
| G25.04-00.20 | 18:37:41.26 | -07:06:39.3 | 42-50 | |||||||||
| 1 | 18:37:28.20 | -07:09:01.1 | 5.06(0.24) | 23.83(0.28) | 46.48 (0.03) | 4.57(0.06) | 1.94(0.28) | 7.16(0.33) | 46.19 (0.08) | 3.60(0.15) | ||
| G28.61-00.26(a) | 18:44:28.25 | -03:57:52.2 | 60-65 | |||||||||
| 1 | 18:44:25.06 | -03:57:56.6 | 4.88(0.19) | 10.63(0.18) | 63.01 (0.01) | 2.08(0.04) | 1.67(0.19) | 2.79(0.18) | 63.09 (0.04) | 1.53(0.09) | ||
| 2 | 18:44:15.23 | -04:01:53.4 | 3.01(0.20) | 4.48(0.18) | 63.25 (0.02) | 1.45(0.06) | 0.58(0.19) | 1.29(0.18) | 63.22 (0.16) | 0.84(0.33) | ||
| 3 | 18:44:22.22 | -04:02:21.5 | 4.23(0.25) | 6.10(0.23) | 63.80 (0.02) | 1.33(0.04) | 1.54(0.24) | 1.85(0.22) | 63.87 (0.05) | 0.88(0.11) | ||
| 4 | 18:44:24.41 | -04:01:03.0 | 4.63(0.23) | 6.79(0.21) | 63.97 (0.02) | 1.47(0.04) | — | — | — | —– | ||
| G28.61-00.26(b) | 18:44:28.25 | -03:57:52.2 | 82-95 | |||||||||
| 1 | 18:44:17.44 | -03:59:28.2 | 5.70(0.24) | 29.42(0.36) | 86.40 (0.06) | 4.85(0.14) | 1.83(0.23) | 8.31(0.34) | 86.38 (0.08) | 4.06(0.21) | ||
| 2 | 18:44:23.30 | -04:01:53.4 | 5.93(0.24) | 21.96(0.36) | 88.01 (0.02) | 3.03(0.05) | 2.09(0.27) | 4.54(0.40) | 88.03 (0.06) | 2.02(0.14) | ||
| 3 | 18:44:41.47 | -04:01:44.0 | 6.92(0.39) | 26.87(0.58) | 88.53 (0.03) | 3.36(0.08) | 2.54(0.25) | 6.37(0.37) | 88.41 (0.04) | 2.17(0.12) | ||
| 4 | 18:44:48.06 | -04:01:16.3 | 5.57(0.38) | 39.43(0.56) | 89.52 (0.05) | 5.74(0.12) | 2.19(0.34) | 9.28(0.51) | 89.29 (0.08) | 3.43(0.26) | ||
| 5 | 18:44:30.56 | -04:01:25.9 | 5.71(0.27) | 19.82(0.40) | 87.46 (0.02) | 3.06(0.06) | 1.71(0.18) | 3.94(0.27) | 87.50 (0.07) | 2.16(0.16) | ||
| G30.77+00.22 | 18:46:42.61 | -01:49:03.0 | 75-88 | |||||||||
| 1 | 18:46:47.59 | -01:48:53.2 | 3.86(0.24) | 24.50(0.31) | 82.13 (0.05) | 6.39(0.16) | 1.21(0.18) | 4.57(0.27) | 81.82 (0.08) | 3.63(0.21) | ||
| 2 | 18:46:37.01 | -01:49:08.3 | 2.80(0.29) | 18.14(0.38) | 81.22 (0.09) | 7.23(0.24) | 0.90(0.19) | 3.41(0.28) | 81.36 (0.12) | 3.92(0.3 ) | ||
| 3 | 18:46:30.54 | -01:52:05.0 | 2.46(0.32) | 19.08(0.42) | 81.83 (0.17) | 6.53(0.17) | 0.70(0.16) | 2.54(0.24) | 80.42 (0.12) | 2.49(0.38) | ||
| 4 | 18:46:26.07 | -01:53:33.7 | 2.01(0.30) | 20.01(0.39) | 80.88 (0.14) | 4.87(0.44) | 0.96(0.22) | 3.45(0.33) | 80.21 (0.12) | 2.35(0.25) | ||
| 5 | 18:46:22.03 | -01:54:05.4 | 2.21(0.30) | 14.86(0.39) | 80.69 (0.11) | 7.93(0.32) | 0.96(0.18) | 1.59(0.27) | 80.53 (0.14) | 2.04(0.36) | ||
| 6 | 18:46:44.75 | -01:53:08.0 | 3.58(0.42) | 21.69(0.55) | 82.84 (0.17) | 6.28(0.17) | 0.93(0.20) | 5.21(0.30) | 81.98 (0.09) | 1.73(0.26) | ||
| G30.97-00.14 | 18:48:21.44 | -01:48:35.6 | 73-84 | |||||||||
| 1 | 18:48:21.09 | -01:48:35.5 | 5.68(0.24) | 26.16(0.33) | 77.82 (0.03) | 4.32(0.06) | 1.30(0.19) | 5.64(0.26) | 77.72 (0.07) | 3.14(0.13) | ||
| 2 | 18:48:12.36 | -01:45:06.9 | 5.09(0.37) | 40.92(0.51) | 77.96 (0.12) | 4.42(0.29) | 1.31(0.28) | 8.53(0.38) | 77.74 (0.14) | 2.51(0.38) | ||
| G31.38+00.29 | 18:47:34.48 | -01:14:55.9 | 92-101.02 | |||||||||
| 1 | 18:47:34.39 | -01:12:52.7 | 7.53(0.29) | 35.43(0.36) | 97.33 (0.03) | 5.45(0.09) | 3.01(0.25) | 13.55(0.31) | 97.25 (0.05) | 4.25(0.12) | ||
| G31.97+00.07 | 18:49:26.07 | -00:49:30.0 | 89-102 | |||||||||
| 1 | 18:49:35.79 | -00:46:08.3 | 7.79(0.27) | 57.74(0.40) | 95.75 (0.03) | 7.25(0.06) | 1.69(0.29) | 10.13(0.43) | 96.30 (0.12) | 5.88(0.24) | ||
| 2 | 18:49:24.45 | -00:50:49.6 | 5.46(0.31) | 23.90(0.46) | 95.73 (0.04) | 4.12(0.09) | 1.53(0.24) | 4.59(0.36) | 95.91 (0.1 ) | 3.05(0.22) | ||
| G33.69-00.01 | 18:52:52.40 | 00:40:12.4 | 97-112 | |||||||||
| 1 | 18:52:56.45 | 00:43:40.7 | 4.96(0.24) | 27.90(0.38) | 106.31(0.03) | 5.30(0.08) | 1.63(0.20) | 7.50(0.32) | 106.94(0.08) | 3.80(0.22) | ||
| 2 | 18:52:52.31 | 00:40:40.6 | 4.37(0.20) | 33.55(0.32) | 105.10(0.04) | 7.36(0.08) | 1.03(0.16) | 6.68(0.26) | 105.14(0.15) | 6.76(0.33) | ||
| 3 | 18:52:51.13 | 00:37:50.0 | 6.68(0.22) | 39.99(0.35) | 104.59(0.02) | 4.92(0.06) | 2.52(0.21) | 9.04(0.34) | 104.45(0.04) | 3.12(0.10) | ||
| 4 | 18:52:30.06 | 00:34:34.4 | 3.99(0.37) | 30.91(0.59) | 103.86(0.17) | 6.44(0.17) | 1.53(0.33) | 7.81(0.53) | 104.31(0.14) | 5.28(0.30) | ||
| G34.43+00.24 | 18:53:19.00 | 01:26:33.7 | 56.5-59.2 | |||||||||
| 1 | 18:53:14.88 | 01:31:00.0 | 5.98(0.30) | 10.51(0.20) | 58.37 (0.03) | 2.00(0.07) | 2.13(0.20) | 2.71(0.14) | 58.59 (0.05) | 1.32(0.13) | ||
| 2 | 18:53:17.19 | 01:29:30.8 | 5.05(0.27) | 11.25(0.18) | 58.21 (0.03) | 2.15(0.07) | 1.91(0.24) | 2.88(0.16) | 58.42 (0.05) | 1.74(0.12) | ||
| 3 | 18:53:18.36 | 01:27:11.9 | 6.13(0.29) | 14.88(0.20) | 57.97 (0.04) | 3.17(0.09) | 1.76(0.19) | 3.74(0.13) | 57.63 (0.05) | 2.81(0.11) | ||
| 4 | 18:53:18.64 | 01:24:13.5 | 8.88(0.21) | 15.07(0.14) | 57.13 (0.02) | 5.07(0.06) | 1.95(0.24) | 4.39(0.16) | 57.02 (0.10) | 4.73(0.27) | ||
| 5 | 18:53:19.18 | 01:22:37.4 | 5.44(0.41) | 13.01(0.28) | 56.98 (0.07) | 3.52(0.19) | 2.32(0.34) | 4.36(0.23) | 57.38 (0.06) | 2.10(0.16) | ||
| 6 | 18:53:12.86 | 01:23:28.9 | 4.75(0.33) | 11.52(0.22) | 57.11 (0.05) | 4.25(0.15) | 2.07(0.27) | 3.12(0.18) | 57.20 (0.16) | 2.83(0.66) | ||
| G38.95-00.47 | 19:04:07.50 | 05:08:18.9 | 38-45 | |||||||||
| 1 | 19:04:07.19 | 05:09:00.3 | 9.77(0.20) | 35.56(0.22) | 42.04 (0.01) | 3.56(0.02) | 2.49(0.19) | 6.91(0.21) | 42.10 (0.04) | 2.66(0.08) | ||
| G48.52-00.47 | 19:22:08.69 | 13:36:56.6 | 35-40 | |||||||||
| 1 | 19:22:07.47 | 13:37:02.1 | 3.48(0.24) | 9.68(0.22) | 37.52 (0.03) | 2.75(0.08) | 1.20(0.20) | 2.04(0.18) | 37.83 (0.07) | 1.77(0.14) | ||
| 2 | 19:22:07.02 | 13:35:17.4 | 2.84(0.24) | 7.53(0.22) | 37.64 (0.04) | 2.56(0.09) | 0.67(0.19) | 1.45(0.18) | 37.67 (0.13) | 2.16(0.27) | ||
| G48.65-00.29 | 19:21:44.59 | 13:48:54.6 | 31-37.5 | |||||||||
| 1 | 19:21:34.61 | 13:51:46.9 | 3.93(0.27) | 10.05(0.27) | 34.84 (0.03) | 2.53(0.07) | 1.24(0.21) | 2.52(0.21) | 34.77 (0.07) | 1.85(0.18) | ||
| 2 | 19:21:48.31 | 13:48:50.2 | 5.86(0.27) | 14.17(0.27) | 33.35 (0.02) | 2.25(0.05) | 1.97(0.19) | 3.23(0.19) | 33.39 (0.04) | 1.50(0.09) | ||
| 3 | 19:21:46.74 | 13:45:30.7 | 3.38(0.31) | 9.25(0.31) | 33.62 (0.04) | 2.40(0.11) | 2.42(0.11) | 2.33(0.11) | 34.32 (0.10) | 1.49(0.10) | ||
| 4 | 19:21:42.47 | 13:43:32.9 | 3.19(0.42) | 8.92(0.42) | 34.07 (0.06) | 2.62(0.15) | 0.98(0.25) | 2.78(0.25) | 33.87 (0.17) | 1.95(0.37) | ||
Note: Columns are (1) source name referring to Parsons et al. (2009), (2)(3) the right ascension and declination of the reference positions and the core centers, (4) the velocity ranges associated with the IRDCs, (5)-(8) the Gauss fitting parameters of the (1-0) lines, (9)-(12) the Gauss fitting parameters of the (1-0) lines.
| MSX(ID) | Distance | R | |||||||||
|---|---|---|---|---|---|---|---|---|---|---|---|
| MSXDC | (kpc) | (K) | (pc) | ||||||||
| G24.00+00.15 | 4.4 | ||||||||||
| 1 | 9.23 (0.07) | 0.50 | 3.41 | 0.62 | 7.57 (0.36) | 9.08 (0.43) | 4.54(0.21) | 14.8(0.69) | 0.77(0.04) | 0.60 | |
| 2 | 8.90 (0.09) | 1.11 | 3.47 | 0.63 | 9.16 (0.34) | 11.00 (0.41) | 5.50(0.20) | 8.02 (0.30) | 4.61(0.17) | 2.55 | |
| 3 | 10.22 (0.09) | 1.47 | 3.69 | 0.67 | 10.3 (0.43) | 12.34 (0.52) | 6.17(0.26) | 6.81 (0.29) | 9.03(0.38) | 3.25 | |
| G25.04-00.20 | 2.9 | ||||||||||
| 1 | 8.47 (0.06) | 1.09 | 3.58 | 0.65 | 8.09 (0.38) | 9.71 (0.46) | 4.85(0.23) | 7.24(0.34) | 3.88(0.18) | 2.93 | |
| G28.61-00.26(a) | 3.6 | ||||||||||
| 1 | 8.23 (0.04) | 0.81 | 3.91 | 0.71 | 3.21 (0.20) | 3.86 (0.24) | 1.93(0.12) | 3.88(0.25) | 0.85(0.05) | 0.39 | |
| 2 | 6.19 (0.06) | 0.31 | 5.34 | 0.97 | 1.59 (0.22) | 1.91 (0.26) | 0.96(0.13) | 4.94 (0.68) | 0.06(0.009) | 0.05 | |
| 3 | 7.56 (0.04) | 0.53 | 3.74 | 0.68 | 2.06 (0.25) | 2.47 (0.30) | 1.24(0.15) | 3.76(0.45) | 0.24(0.03) | 0.09 | |
| 4 | |||||||||||
| G28.61-00.26(b) | 4.6 | ||||||||||
| 1 | 9.08 (0.15) | 1.59 | 4.07 | 0.74 | 9.98 (0.48) | 12.00 (0.57) | 5.99(0.29) | 6.11(0.29) | 10.3(0.49) | 5.46 | |
| 2 | 9.35 (0.05) | 0.91 | 3.85 | 0.7 | 5.41 (0.48) | 6.49 (0.58) | 3.25(0.29) | 5.80(0.52) | 1.82(0.16) | 0.77 | |
| 3 | 10.40 (0.08) | 0.98 | 3.74 | 0.68 | 7.84 (0.47) | 9.41 (0.56) | 4.70(0.28) | 7.82(0.47) | 3.03(0.18) | 0.96 | |
| 4 | 9.02 (0.13) | 1.08 | 3.52 | 0.64 | 10.6 (0.62) | 12.80 (0.75) | 6.38(0.37) | 9.57(0.56) | 5.07(0.30) | 2.65 | |
| 5 | 9.07 (0.06) | 0.70 | 4.24 | 0.77 | 4.79 (0.33) | 5.75 (0.40) | 2.88(0.20) | 6.72(0.46) | 0.94(0.06) | 0.68 | |
| G30.77+00.22 | 4.3 | ||||||||||
| 1 | 7.13 (0.17) | 0.96 | 4.13 | 0.75 | 5.20 (0.37) | 6.24 (0.44) | 3.12(0.22) | 5.26(0.37) | 1.96(0.14) | 2.64 | |
| 2 | 6.00 (0.26) | 0.55 | 4.07 | 0.74 | 3.81 (0.43) | 4.57 (0.51) | 2.29(0.26) | 6.75(0.76) | 0.47(0.05) | 1.76 | |
| 3 | 5.62 (0.19) | 0.64 | 4.40 | 0.8 | 2.92 (0.32) | 3.51 (0.39) | 1.75(0.19) | 4.46(0.50) | 0.48(0.05) | 0.82 | |
| 4 | 5.21 (0.50) | 0.58 | 2.97 | 0.54 | 3.57 (0.73) | 4.28 (0.87) | 2.14(0.44) | 6.04(1.23) | 0.48(0.10) | 0.66 | |
| 5 | 5.41 (0.36) | 0.40 | 3.25 | 0.59 | 1.67 (0.35) | 2.01 (0.42) | 1.00(0.21) | 4.07(0.85) | 0.11(0.02) | 0.35 | |
| 6 | 6.81 (0.18) | 0.51 | 4.62 | 0.84 | 6.12 (0.44) | 7.35 (0.53) | 3.67(0.27) | 11.6(0.84) | 0.65(0.05) | 0.32 | |
| G30.97-00.14 | 4.2 | ||||||||||
| 1 | 9.00 (0.06) | 0.83 | 4.95 | 0.9 | 7.24 (0.34) | 8.69 (0.41) | 4.34(0.21) | 8.49(0.40) | 2.03(0.10) | 1.70 | |
| 2 | 8.40 (0.30) | 1.01 | 4.62 | 0.84 | 10.5 (0.74) | 12.50 (0.89) | 6.27(0.45) | 10.0 (0.72) | 4.36(0.31) | 1.33 | |
| G31.38+00.29 | 5.1 | ||||||||||
| 1 | 11.10 (0.09) | 1.28 | 3.47 | 0.63 | 1.68 (0.43) | 20.10 (0.52) | 10.1(0.26) | 12.8(0.33) | 11.1(0.29) | 4.80 | |
| G31.97+00.07 | 5.1 | ||||||||||
| 1 | 11.17 (0.06) | 1.68 | 5.06 | 0.92 | 14.3 (0.62) | 17.10 (0.74) | 8.56(0.37) | 8.30(0.36) | 16.3(0.70) | 12.1 | |
| 2 | 8.80 (0.09) | 0.62 | 4.40 | 0.8 | 5.60 (0.45) | 6.72 (0.53) | 3.36(0.27) | 8.76(0.70) | 0.88(0.07) | 1.21 | |
| G33.69-00.01 | 5.8 | ||||||||||
| 1 | 8.31 (0.08) | 0.99 | 4.02 | 0.73 | 8.73 (0.40) | 10.50 (0.48) | 5.24(0.24) | 8.55(0.39) | 3.51(0.16) | 2.99 | |
| 2 | 7.64 (0.08) | 1.25 | 4.84 | 0.88 | 8.14 (0.34) | 9.76 (0.41) | 4.88(0.21) | 6.35(0.27) | 5.14(0.22) | 11.9 | |
| 3 | 10.17 (0.06) | 1.32 | 3.63 | 0.66 | 10.9 (0.42) | 13.10 (0.50) | 6.56(0.25) | 8.09(0.31) | 7.67(0.29) | 2.67 | |
| 4 | 7.32 (0.18) | 1.03 | 3.63 | 0.66 | 8.57 (0.67) | 10.30 (0.81) | 5.14(0.40) | 8.12(0.61) | 3.68(0.29) | 5.97 | |
| G34.43+00.24 | 3.3 | ||||||||||
| 1 | 9.41 (0.07) | 0.57 | 3.80 | 0.69 | 3.22 (0.17) | 3.87 (0.20) | 1.93(0.10) | 5.55(0.29) | 0.42(0.02) | 0.21 | |
| 2 | 8.45 (0.07) | 0.27 | 3.63 | 0.66 | 3.27 (0.19) | 3.92 (0.23) | 1.96(0.11) | 11.8(0.69) | 0.10(0.006) | 0.17 | |
| 3 | 9.50 (0.09) | 0.42 | 4.35 | 0.79 | 4.66 (0.17) | 5.60 (0.21) | 2.80(0.11) | 10.8(0.40) | 0.34(0.01) | 0.69 | |
| 4 | 12.29 (0.06) | 0.97 | 5.01 | 0.91 | 6.45 (0.24) | 7.74 (0.29) | 3.87(0.15) | 6.48(0.24) | 2.46(0.09) | 4.51 | |
| 5 | 9.07 (0.45) | 0.51 | 2.81 | 0.51 | 4.76 (0.29) | 5.71 (0.52) | 2.85(0.26) | 9.11(0.83) | 0.50(0.05) | 0.47 | |
| 6 | 8.28 (0.36) | 0.68 | 2.92 | 0.53 | 4.64 (0.28) | 5.57 (0.44) | 2.78(0.22) | 6.63(0.53) | 0.87(0.07) | 1.14 | |
| G38.95-00.47 | 2.5 | ||||||||||
| 1 | 13.22 (0.02) | 0.70 | 4.68 | 0.85 | 10.3 (0.31) | 12.34 (0.37) | 6.17(0.19) | 14.3(0.43) | 2.03(0.06) | 1.03 | |
| G48.52-00.47 | 2.5 | ||||||||||
| 1 | 6.74 (0.09) | 0.44 | 3.91 | 0.71 | 2.26 (0.21) | 2.72 (0.25) | 1.36(0.13) | 5.06(0.47) | 0.18(0.02) | 0.28 | |
| 2 | 6.01 (0.10) | 0.25 | 4.84 | 0.88 | 1.72 (0.21) | 2.07 (0.26) | 1.03(0.13) | 6.59(0.82) | 0.04(0.006) | 0.25 | |
| G48.65-00.29 | 2.2 | ||||||||||
| 1 | 7.21 (0.07) | 0.41 | 4.13 | 0.75 | 2.87 (0.25) | 3.45 (0.30) | 1.72(0.15) | 6.83(0.59) | 0.20(0.02) | 0.29 | |
| 2 | 9.26 (0.05) | 0.51 | 3.96 | 0.72 | 3.87 (0.23) | 4.65 (0.28) | 2.32(0.14) | 7.37(0.44) | 0.41(0.02) | 0.24 | |
| 3 | 7.53 (0.15) | 0.36 | 1.54 | 0.28 | 2.16 (0.12) | 2.59 (0.15) | 1.29(0.07) | 5.76(0.33) | 0.12(0.007) | 0.17 | |
| 4 | 6.42 (0.16) | 0.46 | 4.18 | 0.76 | 3.14 (0.32) | 3.77 (0.38) | 1.88(0.19) | 6.64(0.67) | 0.27(0.03) | 0.37 |
Note: The numbers in () represent the errors of the corresponding physical parameters.
3.4 Properties of the dense IRDC cores
In order to study the properties of the molecular cores, we calculate the physical parameters (the excited temperature , optical depth , column density, radius, number density and mass, etc.) of various cores. In calculations, assume that the cores are in the state of local thermodynamical equilibrium (LTE). The molecular cores are generally optically thin for the and emission, but referring to the high column density and number density within the IRDC cores in the previous researches (Egan et al., 1998; Carey et al., 1998, 2000; Rathborne et al., 2006), here we can assume that the (1-0) transition line is optically thick and the (1-0) line is optically thin. Referring to Myers et al. (1983), we can derived the optical depths of the and lines from following equation:
| (1) |
The calculated optical depths of the (1-0) and (1-0) lines in the peak positions of the IRDC cores are listed in Table 2 column 5, 6. We can see that the (1-0) line is really optically thick in all the IRDC cores and the hypothesis is valid. So the excitation temperature of the cores can be worked out by equation (2).
| (2) |
And the column density of molecule can be derived from the following formulae (Scoville et al., 1986):
| (3) |
As for the below analysis, we assume that the cores are spherical and identified within the 70 contours of the integrated intensity distribution. The characteristic size R mean the radii of the cores which are defined as , where is the size of the core in different directions. The final results are listed in Table 2 column 4.
Taking the element abundance ratios and (Frerking et al., 1982), and combining the above characteristic sizes of the cores, the derived mean volume densities of molecule are
| (4) |
Based on the LTE assumption and spherical model, the masses of the cores are calculated as:
| (5) |
where, is the mass of hydrogen molecule, is the mean molecular weight considering the contributions of He and other heavy elements to the total mass.
In addition, the viral masses of the IRDC cores are also calculated by using equation (6).
| (6) |
in which is the full width at the half-maximum, G is the gravitational constant.
All the calculated physical parameters are listed in Table 2. We plot the histograms of all of them in Figure 2 to study the physical properties in the northern IRDCs. From Figure 2, we can find that the northern IRDCs have a typical excitation temperature K with a mean K, a maximum 13.2 K and a minimum 5.2 K, which are lower than the previous results derived from other denser molecules (eg, , , HCN, etc.) (Ragan et al., 2006; Pillai et al., 2006; Liu et al., 2013), but consistent with the excitation temperatures derived from CO (Wu & Yang, 2005; Du & Yang, 2008). This suggests that different molecules maybe trace different cloud regions and CO seems to prefer to the colder areas and/or the molecular emission in our observations are beam diluted. The typical value of the integrated intensity ratio of to being in the range with a smaller fluctuation agrees well with Meier & Turner (2001). Its average value is . The mean line widths of the molecules and are and , respectively, which are much greater than their mean thermal broadening: . This indicates that the non-therm motions will be charged for the velocity dispersion and we consider the turbulence as the dominant.
Vasyunina et al. (2009) suggested the typical column density ranges between 0.9 and and mass range in the southern IRDCs, which are very consistent with our results for the northern IRDCs, implying that some properties of the IRDCs in southern and in northern should be similar on the whole. The median values of and are and . Besides, from the histograms of , and R in Figure 2, we can see that the typical optical depth of is in the range of with a mean value , while for , it is in the range of with a mean value and the typical characteristics size of the IRDC cores is from 0.5 pc to 1.2 pc with a mean value pc. The histogram of the volume density shows a typical range of , confirming the viewpoint that the IRDC cores are dense. At the same time, we find that the IRDC cores associated with the HII/UCHII regions or IRAS sources have higher excitation temperatures more than 10 K and are more compact. This indicates that these IRDC cores are evolving into the different stages and even some have been to the later stages and may be heated by the associated HII/UCHII regions.
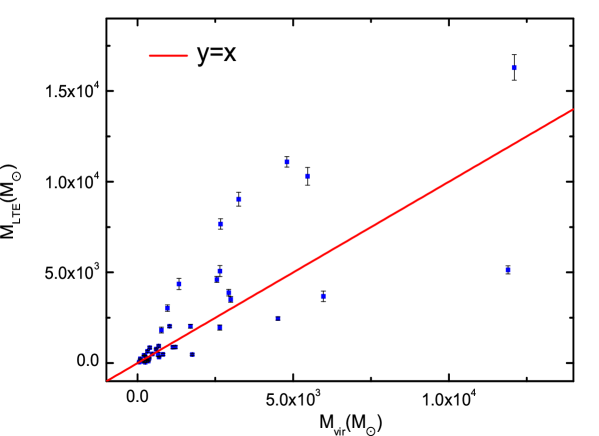
Comparing with for the IRDC cores in Table 2, we find that of the IRDC cores have , and consequently we suggest that these IRDC cores are likely gravitational bounded and might be in the state of gravitational collapse, providing a probability to form stars. In addition, we also make a graph between and for the 40 cores, which is showed in Figure 3. Here, we just consider the error of for each IRDC core, without considering that of . Because the errors caused by the line widths are too small and thus can be ignored for . Certainly, there can be significant systematic uncertainties for the estimation of , which are difficult to be constrained and hence are not considered here. The red line in Figure 3 represents the relation of the equality. Obviously, from this figure, we find that a large portion of the IRDC cores seems have , especially for the relative low-mass source. In fact, except for the cors, up to of the remaining cores have the slightly less than the viral equilibrium mass, which we think they are in a ”metastable state”. Once they suffer from the external pressure, such as the stellar wind from the young cluster around the core, they will star the gravitational collapse and have a further chance to form stars. Moreover, Seeing Table 2 and Figure 3, it is obvious that the uncertainties in the mass estimates are small and thus almost have no impact to the above analysis on the stability of the cores. Besides, comparing the gravitational cores with the other in Figure 1 and Table 2, we can find that the cores are more compact, warmer and higher column density, implying that they may be in the relatively later evolutional stages of the molecular cores.
4 Discussion
4.1 infall and outflow
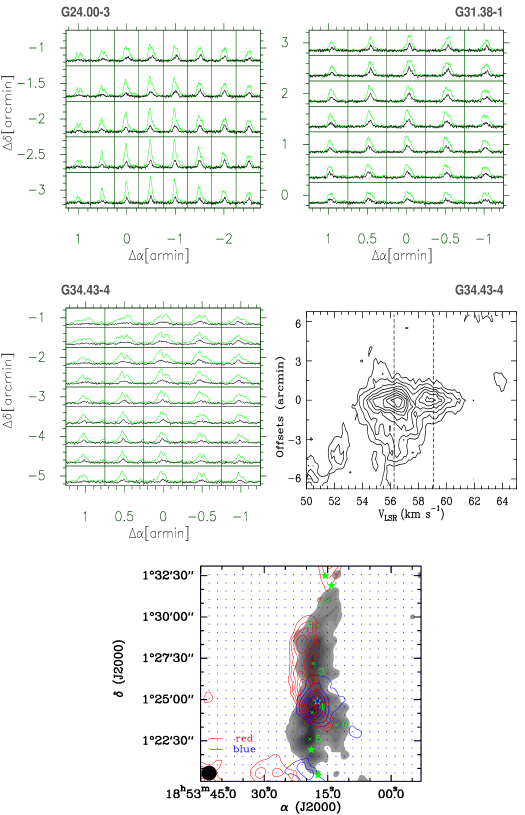
Seeing the spectra in Figure 1, we find that the optically thick lines (1-0) show the self-absorbed features or the ”blue profiles” (Anglada et al., 1987; Adelson & Leung, 1988; Zhou, 1992; Walker et al., 1994) in three IRDC cores: MSXDC G24.00+00.15-3, MSXDC G31.38+00.29-1 and MSXDC G34.43+00.24-4 (Later we will simplify them for G24.00-3, G31.38-1 and G34.43-4). While their optically thin lines (1-0) just show a single velocity component peaked at the (1-0) lines center. This satisfies the classical signature of infall, rotation or outflows (Adelson & Leung, 1988). However, rotation and outflows should produce approximately equal numbers of red and blue asymmetric profiles. On the other hand, infall ought to preferentially produce blue asymmetric profiles (e.g. Anglada et al., 1987; Zhou, 1992; Walker et al., 1994; Jiménez-Serra et al., 2014). In order to identify which one is the main culprit for that, we plot the map grids of them using the two lines (1-0) (Green) and (1-0) (Black), presented in Figure 4. Their map grids indeed exhibit the large-scaled (at least ) blue asymmetric feature, which suggests that they are real infall candidates (Wu et al., 2005; Ren et al., 2012).
Alternatively, Mardones et al. (1997) put forward a quantization parameter of the line asymmetry to identify the infall motion, which was widely used in the astronomical researches (e.g. Fuller et al., 2005; Wu et al., 2005; Chen et al., 2013). He defined as , where represents the line peak velocity of the optically thick line and , an optically thin tracer, measure the systemic velocity. is the line width of the optically thin line. Mardones et al. (1997) suggested a criterion to indicate that a line profile was asymmetric and for red asymmetry or for blue asymmetry. Here, we also adopt this quantitative method as Fuller et al. (2005) to further confirm our results. The calculated for G24.00-3, G31.38-1 and G34.43-4 are , , and , respectively. The uncertainty estimates of are caused by the velocity dispersion of the optically thin line, i.e., . This indicates that there are indeed infall motions in these three cores.
Furthermore, we make Position-Velocity diagrams to identify their outflows, finding that only the PV diagram of IRDC core G34.43-4 (in Figure 4) shows the velocity gradients in the velocity ranges of km s-1 and km s-1, which implies the existence of the bipolar outflows. We present the integrated intensity maps of the outflows with the 13CO J=1-0 line in the bottom of Figure 4. The velocity component of blueshifted is from 52 km s-1 to 56.5 km s-1, while the velocity component of redshifted is from 59.2 km s-1 to 62.2 km s-1. The blueshifted and redshifted components are shown as blue and red contours. From Figure 4(Bottom), we find a big difference between the red outflow and the blue outflow. The red outflow shows a high collimation from north to south, but its blue outflow has a badly collimation. Their big difference in collimation probably implies that they come from different outflows and thus have different driving sources. That we do not detect their corresponding outflows is probable due to the low resolution of our telescope or contamination. Besides, we also find that both of the outflows are associated well with the molecular core G34.43-4, an UCHII region GAL 034.4+00.23 with a local standard rest velocity 57.3 km s-1(the blue box in Figure 4) and IRAS 18507+0121(the green star in Figure 4) (Bronfman et al., 1996). These suggest that there likely be several stars or a stellar cluster forming in IRDC core G34.43-4. Thus, we expect the high resolution observations to make clear the internal structure of this core.
For these three IRDC cores, they were well studied by previous researchers. IRDC core G24.00-3 was associated with IRAS 18317-0757 and an UCHII region (Wood & Churchwell, 1989). The high resolution observation of Hunter et al. (2004) suggested considerable fragmentation having taken place in the molecular cloud and star formation maybe ongoing throughout the core. But nobody has detected the infall and outflow motions before. For IRDC core G31.38-1, it was studied to be associated with IRAS 18449-0115 and an UCHII region (Cesaroni etal., 1998). Gaume & Mutel (1987) and Cesaroni et al. (2011) found a striking velocity gradient across the core in the NE-SW direction and Klaassen et al. (2012) suggested the infall motions in the molecular cloud but didn’t find the outflows. IRDC core G34.43-4, which corresponds to the southern compact molecular core of Shepherd et al. (2004), was associated with IRAS 18507+0121, with an NIR cluster of young stars with a central B0.5 star (Shepherd et al., 2004), with an UCHII region (Miralles et al., 1994; Molinari et al., 1998), with a variable maser (Miralles et al., 1994), with maser emission (Szymczak et al., 2000), and with three massive outflows (Shepherd et al., 2007). Sanhueza et al. (2010) suggested that it was undergoing collapsing and had outflows.
However, it is the first time that the infall motions have been detected in IRDC core G24.00-3 and IRDC core G34.43-4. And the numbers and morphologies of the outflows of IRDC core G34.43-4 in our work are different from that of Shepherd et al. (2007) and Sanhueza et al. (2010), which is possible to be related to the different integrated velocity ranges for the wings and a larger spatial resolution for our observations. But we have clearly observed a high collimation red outflow and a compact blue outflow in (1-0) that have never been studied before. They probably also suggest two different outflows and imply several stars forming in IRDC core G24.00-3.
4.2 Core mass functions
From Table 2, we obtain a mass range of , which we use to estimate the mass spectrum of the IRDC cores. The mass spectrum is calculated from the number of the cores per each mass bin , that is:
| (7) |
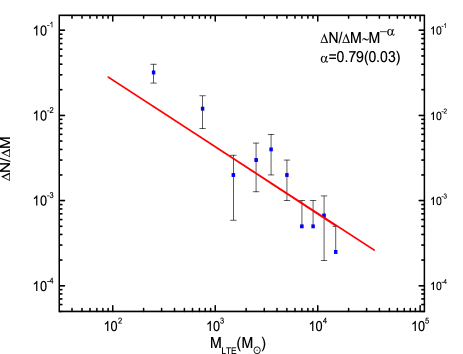
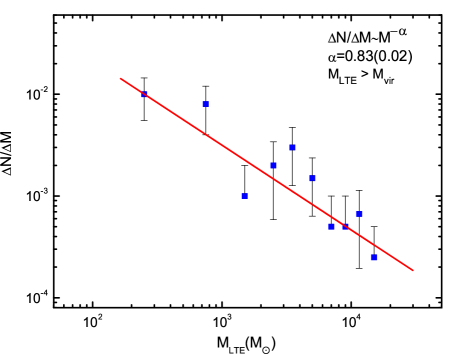
The binned mass spectrum of the 40 IRDC cores is showed in the left plane of Figure 5, which obeys to a power law function, with a power-law index of . Here, we do not take into account the errors in the mass estimation but the simply counting errors: . Moreover, we also perform a mass spectrum to the gravitational bound cores, which is presented in the right plane of Figure 5. It is also a power-law spectrum with a slope of , which is almost the same with that of the whole cores, implying the possibility that the evolution of the IRDC cores might have no influence on their mass spectrum and hence the mass spectrum of the IRDC cores can be used to estimate the initial mass function. However, we compare them with the power-law index of the stellar initial mass functions (IMFs) derived from Salpeter (1955); Scalo (1986); Kroupa (2001, 2002); Chabrier (2003) as well as the CO cloud mass distribution (Solomon et al., 1987), finding that our results are much more flatten, which maybe suggest that the IRDC cores account for a large proportion of the massive molecular cores and therefore the IRDCs are probable to be the birthplace of the high-mass stars/clusters. But we have reservations about this conclusion. The large difference between our indexes with those of others possibly comes from our small sample and the telescope, which can cause a big error (Rosolowsky, 2005). As for the error coming from mass estimation, we think that it is equal to all the researchers and it can not bring a great discrepancy for us. Thereby, a big sample and high resolution observations are needed to continue the study of the mass spectrum of the IRDC cores.
4.3 Comparison with the Planck cores
Planck satellite working at submillimeter/millimeter bands have detected 10,783 cold clumps in its survey (Planck Collaboration et al., 2011) and therefore provided a wealth of early sources to be studied. Actually, Planck Collaboration et al. (2011) suggested that the planck cold clumps in the clod core Catalogue of Planck Objects (C3PO) had dust temperatures of K and column densities of and the research of Wu et al. (2012) showed that the planck clumps in the Early Cold clump Catalogue (ECC) had excitation temperatures range from 4 to 27 K and column densities in the range of with an average value of . In addition, the mean excitation temperatures and the mean column densities of the planck cold clumps in Orion complex are in the range of K with an average K and with an average . Their dense cores had an mean radius and LTE mass of pc and , respectively (Liu et al., 2012). Comparing them with our results, we can see that the northern IRDC cores are colder but denser, and have larger size and much more massive, suggesting that the IRDC cores appear to be more suitable for the research to the early stage of massive star formation.
Moreover, Liu et al. (2012) did a core mass function toward 82 cores in 51 planck cold clumps projected on Orion complex and derived a power-law index of , which is larger than . Given the fact that we use the same telescope and the same molecular lines, the difference will be caused by several factors: 1) the size of the sample, 2)the completeness limit, 3)the IRDC cores might have a flatten CMF than the planck cores. However, just consider the mass distribution on the whole, the IRDC cores indeed prefer to fragment into massive cores and provide ideal objects for the research of the high-mass star formation, but the planck cores are more perfect to study the early stages of the low mass star formation.
5 Summary
We perform a mapping observation in molecular lines of and towards 12 northern IRDCs. The BGPS 1.1 mm data and GLIMPSE Spitzer IRAC data are also used. Their morphologies and properties are analyzed. The star formation motions and core mass function are discussed. The main findings in this work are as follows.
1. The molecule emission, BGPS 1.1 mm emission and Spitzer emission are associated well with each other and show the similar morphologies for all the 12 northern IRDCs. And ten IRDCs are filamentary structure containing at least one core and the remaining IRDCs are compact and isolated. 41 dense cores are identified in the IRDCs.
2. The typical excitation temperature is in the range of K, with an average value , which is lower than the previous results studied by denser molecules, implying that different molecules trace different regions. The typical column density and LTE mass are and , respectively, consistent with the typical values of southern IRDCs. Their median values are and , respectively. The typical values of , , and R are , , and pc, with the corresponding average values , , and , respectively.
3. Through the comparison with the studies of the planck cores, we find that the IRDC cores are colder, denser, more massive and with larger size, suggesting that the IRDC cores are more suitable for exploring the massive star formation.
4. Three IRDC cores G24.00-3, G31.38-1 and G34.43-4 are found to have large scaled infall motions. And IRDC core G34.43-4 probably have two different outflows, one of which is high collimation.
5. The core mass function can be fitted with a power-law for , whose slope is . While the CMF of the the gravitational bound cores almost have the same distribution function, indicating that the evolution of the IRDC cores probably have no compact on the core mass function. Hence, it will be a effective method to study the stellar initial mass function. Certainly, a large sample of the IRDC cores is need to prove this conclusion.
Acknowledgments
We are grateful to the staff at the Qinghai Station of PMO for their assistance during the observations. Thanks for the Key Laboratory for Radio Astronomy, CAS to partly support the telescope operating. This work also has made use of the data products from the Bolocam Galactic Plane Survey (BGPS) and NASA/IPAC Infrared Science Archive, which is operated by the Jet Propulsion Laboratory, California Institute of Technology, under contract with the National Aeronautics and Space Administration. This work is supported by the National Natural Science Foundation of China (Grant No. 11363004).
References
- Aguirre et al. (2011) Aguirre, J. E., Ginsburg, A. G., Dunham, M. K., et al. 2011, ApJS, 192, 4
- Anglada et al. (1987) Anglada, G., Rodriguez, L. F., Canto, J., Estalella, R., & Lopez, R. 1987, A&A, 186, 280
- Adelson & Leung (1988) Adelson, L. M., & Leung, C. M. 1988, MNRAS, 235, 349
- Beuther et al. (2005) Beuther, H., Sridharan, T. K., & Saito, M. 2005, ApJ, 634, L185
- Bronfman et al. (1996) Bronfman, L., Nyman, L.-A., & May, J. 1996, A&AS, 115, 81
- Carey et al. (1998) Carey, S. J., Clark, F. O., Egan, M. P., et al. 1998, ApJ, 508, 721
- Carey et al. (2000) Carey, S. J., Feldman, P. A., Redman, R. O., et al. 2000, ApJ, 543, L157
- Cesaroni etal. (1998) Cesaroni, R., Hofner, P., Walmsley, C. M., & Churchwell, E. 1998, A&A, 331, 709
- Cesaroni et al. (2011) Cesaroni, R., Beltrán, M. T., Zhang, Q., Beuther, H., & Fallscheer, C. 2011, A&A, 533, A73
- Chambers et al. (2009) Chambers, E. T., Jackson, J. M., Rathborne, J. M., & Simon, R. 2009, ApJS, 181, 360
- Chabrier (2003) Chabrier, G. 2003, PASP,115, 763
- Chen et al. (2013) Chen, X., Gan, C.-G., Ellingsen, S. P., et al. 2013, ApJS, 206, 22
- Du & Yang (2008) Du, F., & Yang, J. 2008, ApJ,686, 384
- Egan et al. (1998) Egan, M. P., Shipman, R. F., Price, S. D., et al. 1998, ApJ, 494, L199
- Fazio et al. (2004) Fazio, G. G., Hora, J. L., Allen, L. E., et al. 2004, ApJS, 154, 10
- Frerking et al. (1982) Frerking, M. A., Langer, W. D., & Wilson, R. W. 1982, ApJ, 262, 590
- Fuller et al. (2005) Fuller, G. A., Williams, S. J., & Sridharan, T. K. 2005, A&A, 442, 949
- Glenn et al. (2009) Glenn, J., Aguirre, J., Bally, J., et al. 2009, Submillimeter Astrophysics and Technology: a Symposium Honoring Thomas G. Phillips, 417, 277
- Gaume & Mutel (1987) Gaume, R. A., & Mutel,R. L. 1987,ApJS,65,193
- Hunter et al. (2004) Hunter, T. R., Zhang, Q., & Sridharan, T. K. 2004, ApJ, 606, 929
- Jackson et al. (2008) Jackson, J. M., Finn, S., Rathborne, J., Chambers, E., & Simon, R. 2008, Bulletin of the American Astronomical Society, 40, 267
- Jiménez-Serra et al. (2014) Jiménez-Serra, I., Caselli, P., Fontani, F., et al. 2014, MNRAS, 439, 1996
- Klaassen et al. (2012) Klaassen, P. D., Testi, L., & Beuther, H. 2012, A&A, 538, A140
- Kroupa (2001) Kroupa, P. 2001, MNRAS, 322, 231
- Kroupa (2002) Kroupa, P. 2002, Science, 295,82
- Liu et al. (2012) Liu, T., Wu, Y., & Zhang, H. 2012, ApJS, 202, 4
- Liu et al. (2013) Liu, X.-L., Wang, J.-J., & Xu, J.-L. 2013, MNRAS, 431, 27
- Meier & Turner (2001) Meier, D. S., & Turner, J. L. 2001, ApJ, 551, 687
- Myers et al. (1983) Myers, P. C., Linke, R. A., & Benson, P. J. 1983, ApJ, 264, 517
- Miettinen (2014) Miettinen, O. 2014, A&A, 562, A3
- Miralles et al. (1994) Miralles, M. P., Rodriguez, L. F., & Scalise, E. 1994, ApJS, 92, 173
- Molinari et al. (1998) Molinari, S., Brand, J., Cesaroni, R., Palla, F., & Palumbo, G. G. C. 1998, A&A, 336, 339
- Mardones et al. (1997) Mardones, D., Myers, P. C., Tafalla, M., et al. 1997, ApJ, 489, 719
- Parsons et al. (2009) Parsons, H., Thompson, M. A., & Chrysostomou, A. 2009, MNRAS, 399, 1506
- Pitann et al. (2013) Pitann, J., Linz, H., Ragan, S., et al. 2013, ApJ, 766, 68
- Peretto & Fuller (2009) Peretto, N., & Fuller, G. A. 2009, A&A, 505, 405
- Perault et al. (1996) Perault, M., Omont, A., Simon, G., et al. 1996, A&A, 315, L165
- Pillai et al. (2006) Pillai, T., Wyrowski, F., Carey, S. J., & Menten, K. M. 2006, A&A, 450, 569
- Planck Collaboration et al. (2011) Planck Collaboration, Ade, P. A. R., Aghanim, N., et al. 2011, A&A, 536, A7
- Rathborne et al. (2005) Rathborne, J. M., Chambers, E. T., Jackson, J. M., & Simon, R. 2005, Bulletin of the American Astronomical Society, 37, #184.18
- Rathborne et al. (2006) Rathborne, J. M., Jackson, J. M., & Simon, R. 2006, ApJ, 641, 389
- Rathborne et al. (2008) Rathborne, J. M., Jackson, J. M., Zhang, Q., & Simon, R. 2008, ApJ, 689, 1141
- Rosolowsky (2005) Rosolowsky, E. 2005, PASP, 117, 1403
- Reid et al. (2009) Reid, M. J., Menten, K. M., Zheng, X. W., et al. 2009, ApJ, 700, 137
- Ragan et al. (2006) Ragan, S. E., Bergin, E. A., Plume, R., et al. 2006, ApJS, 166, 567
- Ren et al. (2012) Ren, Z., Wu, Y., Zhu, M., et al. 2012, MNRAS, 422, 1098
- Sanhueza et al. (2012) Sanhueza, P., Jackson, J.M., Foster, J.B., Garay, G., Silva, A., Finn, S.C. 2012, arXiv:1206.6500v1
- Scoville et al. (1986) Scoville, N.Z., Sargent, A.I., Sanders, D.B. et al. 1986, ApJ, 303, 416
- Scalo (1986) Scalo, J. M. 1986, Fund. Cosmic phys, 11, 1
- Simon et al. (2006) Simon, R., Jackson, J. M., Rathborne, J. M., & Chambers, E. T. 2006, ApJ, 639, 227
- Simon et al. (2006) Simon, R., Rathborne,J. M., Shah, R. Y., Jackson, J. M., & Chambers, E. T. 2006, ApJ,653, 1325
- Salpeter (1955) Salpeter, E. E. 1955, ApJ, 121, 161
- Solomon et al. (1987) Solomon, P. M., Rivolo,A. R., Mooney, T. J., Barrett, J. W., & Sage, L. J. 1987, NASA Conference Publication, 2466, 37
- Szymczak et al. (2000) Szymczak, M., Hrynek, G., & Kus, A. J. 2000, A&AS, 143, 269
- Shepherd et al. (2004) Shepherd, D. S., Kurtz, S. E., & Testi, L. 2004, ApJ, 601, 952
- Shepherd et al. (2007) Shepherd, D. S., Povich, M. S., Whitney, B. A., et al. 2007, ApJ, 669, 464
- Sanhueza et al. (2010) Sanhueza, P., Garay, G., Bronfman, L., et al. 2010, ApJ, 715, 18
- Sakai et al. (2013) Sakai, T., Sakai, N., Foster, J. B., et al. 2013, ApJL, 775, L31
- Vasyunina et al. (2009) Vasyunina, T., Linz, H., Henning, T., et al.2009, A&A, 499, 149
- Vasyunina et al. (2011) Vasyunina, T., Linz, H., Henning, T., et al. 2011, A&A, 527, A88
- Werner et al. (2004) Werner, M. W., Roellig, T. L., Low, F. J., et al. 2004, ApJS, 154, 1
- Wood & Churchwell (1989) Wood, D. O. S., & Churchwell, E. 1989, ApJ, 340, 265
- Wu et al. (2005) Wu, Y., Zhu, M., Wei, Y., et al. 2005, ApJL, 628, L57
- Wu et al. (2012) Wu, Y., Liu, T., Meng, F., et al. 2012, ApJ, 756, 76
- Walker et al. (1994) Walker, C. K., Narayanan, G., & Boss, A. P. 1994, ApJ, 431, 767
- Wu & Yang (2005) Wu, L.-X., & Yang, J. 2005, CAA, 29, 370
- Xu et al. (2013) Xu, J.-L., Wang, J.-J., & Liu, X.-L. 2013, A&A, 559, A113
- Yin et al. (2011) Yin, J., Jiang, Z.-B., Yang, J., Chen, Z.-W., & Wang, M. 2011, CAA, 35, 150
- Zhou (1992) Zhou, S. 1992, ApJ, 394, 204
![[Uncaptioned image]](/html/1406.7645/assets/x13.png)
![[Uncaptioned image]](/html/1406.7645/assets/x14.png)
![[Uncaptioned image]](/html/1406.7645/assets/x15.png)
![[Uncaptioned image]](/html/1406.7645/assets/x16.png)
![[Uncaptioned image]](/html/1406.7645/assets/x17.png)
![[Uncaptioned image]](/html/1406.7645/assets/x18.png)
![[Uncaptioned image]](/html/1406.7645/assets/x19.png)
![[Uncaptioned image]](/html/1406.7645/assets/x20.png)