Measurement of decay rate and parameters at KEDR
Abstract
Using the inclusive photon spectrum based on a data sample collected at the peak with the KEDR detector at the VEPP-4M collider, we measured the rate of the radiative decay as well as mass and width. Taking into account an asymmetric photon lineshape we obtained keV, MeV/, MeV.
keywords:
charmonium , radiative decays1 Introduction
decay is a magnetic dipole radiative transition in charmonium with the most probable photon energy of about 114 MeV and a fairly large branching fraction of [1]. This is a transition between 1 states of the charmonium system and its rate can be easily calculated in potential models. In the nonrelativistic approximation, the magnetic dipole amplitudes between -wave states are independent of a specific potential model, because the spatial overlap equals one for states within the same multiplet. A simple calculation in the nonrelativistic approximation yields the result [2] . It is reasonable to assume that relativistic corrections are of order %, similarly to the case of the electric dipole transitions in the charmonium (see, for example, the reviews [3, 4]). However, in 1986 the Crystal Ball Collaboration measured this branching fraction in the inclusive photon spectrum and obtained a much smaller value [5]. There are a lot of theoretical predictions for this decay rate [6, 7, 8, 9, 10, 11, 12, 13], based on QCD sum rules, lattice QCD calculations and so on, but as a rule they lead to values approximately twice as large as the Crystal Ball result.
This discrepancy remained unchanged for more than twenty years. During this period no new measurements of this branching fraction were performed, and the PDG average [14] was based on the single Crystal Ball result. Only in 2009 the CLEO Collaboration published the result of a new measurement [15], in which 12 exclusive decay modes of the were analyzed. The obtained value is closer to theoretical predictions. Combining the Crystal Ball and CLEO results, PDG obtained [1] with a scale factor of 1.6. In this work we report the result of a new independent measurement performed using the inclusive photon spectrum.
2 Photon spectrum
The spectrum of detected photons in decay is given by the formula [3]
| (1) |
Here is a photon energy, is the fine structure constant, and are -quark charge (in electron charge units) and mass, is the matrix element of the transition (without relativistic corrections), , is a Breit-Wigner function. A typical momentum transfer inside the charmonium bound state is about 700 to 800 MeV [16] (this is of the order of the inverse size of the system), so the matrix element is almost constant (close to one) up to such photon energies. Therefore, in this energy range the decay spectrum . Since at , the decay probability grows as when increases. If a resonance width is not small, it can give a noticeable tail in the photon spectrum at photon energies . For the transition we have . This value is not small, therefore we should take into account this tail. It should be also noted that in theoretical calculations of the decay rate this effect is as a rule neglected, and, assuming a small width of the resonance, is replaced with in (1).
At the same time it is known that the usual form of the Breit-Wigner function is applicable only in the close vicinity of a resonance and gives an overestimated value far from it. For example, in the theory of atomic transitions a photon absorption lineshape has the same functional form as a (non-relativistic) Breit-Wigner function, but with [17], so at . Also, it should be taken into account that this function gives a correct description of the resonance in the limit of its zero width only. Given this, the photon lineshape in the decay has the form
| (2) |
where the correction factor is about one near the resonance and falls far from the resonance.
Due to the factor and a fairly large width, the photon lineshape in this decay is asymmetric, and this is confirmed experimentally. The Crystal Ball did not consider this issue in their publication, noting only that the factor was used in the fit of the spectrum in the convolution of the detector response function with the Breit-Wigner resonance shape. However, because of the large background, such an asymmetry cannot be revealed using the data collected at the Crystal Ball.
The CLEO Collaboration used exclusive decay modes of the , that allows one to suppress background strongly. As a result, it was found that the photon lineshape of this transition is really asymmetric. The Breit-Wigner function alone, traditionally used to describe resonances, provides a poor fit to data. Its modification with the factor improves the fit around the peak, but gives a great tail at higher photon energies, as it was noted above. To suppress this tail, CLEO used in their fit with MeV. However, such a form of matrix element is valid for harmonic oscillator wave functions only. Also, the value of used in the fit is too small for the charmonium system and gives very fast fall of the matrix element with the photon energy increase. In addition, in their analysis CLEO did not consider interference effects, which may be not small for exclusive spectra.
When measuring the branching fraction , one should separate the events of decays from the background events. This requires either a knowledge of the photon lineshape or a background measurement with sufficient accuracy. As a rule, the latter is a difficult task, especially for inclusive decays, because of the small signal to background ratio. Therefore, to determine the number of signal events, during the data fitting one has to specify the explicit form of the resonance. However, considering that exact dependence of the factor in (2) is unknown, we can conclude that the measurement of will be inevitably model-dependent, until the photon lineshape will be measured or calculated theoretically with a sufficient accuracy. In this work we assume that the photon lineshape has the form (2) wherein is chosen under the assumption that the spectrum tail at photon energies can be neglected: at the factor , at the factor , and in the region the decay probability falls linearly.
3 KEDR data
The experiment was performed at the KEDR detector [18] of the VEPP-4M collider [19]. It operates at a peak luminosity of about near the resonance energy. The luminosity is measured using single Bremsstrahlung online and small-angle Bhabha scattering offline. Two methods of a beam energy determination are used: a resonant depolarization with an accuracy of keV and an IR-light Compton backscattering with an accuracy of keV [20].
The view of the KEDR detector is shown in Fig. 1.

Subsystems are listed in the figure. Detector includes a tracking system consisting of a vertex detector and a drift chamber, a particle identification (PID) system of aerogel Cherenkov counters and scintillation time-of-flight counters, and an electromagnetic calorimeter based on liquid krypton (in the barrel part) and CsI crystals (endcap part). The superconducting solenoid provides a longitudinal magnetic field of 0.6 T. A muon system is installed inside the magnet yoke. The detector also includes a high-resolution tagging system for studies of two-photon processes.
Charged tracks are reconstructed in the drift chamber (DC) and vertex detector (VD). DC has a cylindrical shape, with a 1100 mm length and an outer radius of 535 mm, and is filled with pure dimethyl ether. DC cells form seven concentric layers: four axial layers and three stereo layers to measure track coordinates along the beam axis. The coordinate resolution averaged over drift length is 100 . VD is installed between the vacuum chamber and DC and increases a solid angle accessible to the tracking system to 98. VD consists of 312 cylindrical drift tubes aligned in 6 layers. It is filled with an Ar + CO2 gas mixture and has a coordinate resolution of 250 . The momentum resolution of the tracking system is .
Scintillation counters of the time-of-flight system (TOF) are used in a fast charged trigger and for identification of the charged particles by their flight time. The TOF system consists of 32 plastic scintillation counters in the barrel part and in each of the endcaps. The flight time resolution is about 350 ps, which corresponds to separation at the level of more than two standard deviations for momenta up to 650 MeV.
Aerogel Cherenkov counters (ACC) are used for particle identification in the momentum region not covered by the TOF system and ionization measurements in DC. ACC uses aerogel with a refractive index of 1.05 and wavelength shifters for light collection. This allows one to identify and K mesons in the momentum range of 0.6 to 1.5 GeV. The system includes 160 counters in the endcap and barrel parts, each arranged in two layers. During data taking only one layer of ACC was installed, and it was not used because of insufficient efficiency.
The barrel part of the electromagnetic calorimeter is a liquid krypton ionization detector. The calorimeter provides an energy resolution of at the energy of 1.8 GeV and a spatial resolution of mm for charged particles and photons. The endcap part of the calorimeter is based on 1536 CsI(Na) scintillation crystals [18] with an energy resolution of at 1.8 GeV, and a spatial resolution of 8 mm.
The muon system is used to identify muons by their flight path in the dense medium of the magnetic yoke. It consists of three layers of streamer tubes with solid angle coverage, the total number of channels is 544. The average longitudinal resolution is 3.5 cm, and the detection efficiency for most of the covered angles is .
The trigger of the KEDR detector has two levels: primary (PT) and secondary (ST). Both PT and ST operate at the hardware level. PT uses signals from TOF counters and both calorimeters as inputs, its typical rate is kHz. ST uses signals from VD, DC and muon system in addition to the systems listed above, and the rate is Hz.
The analysis is based on a data sample of collected at the peak and corresponding to about 6 million decays. Photon selection was performed in two steps. At the first step multihadron decays of were selected. The following criteria suppressing backgrounds from cosmic rays, beam-gas interactions and Bhabha events, were applied: total energy in the calorimeters is greater than 0.8 GeV; at least four clusters with the energy greater than 30 MeV in the calorimeters are reconstructed; at least one central track in the drift chamber (DC) is reconstructed; there are no muon tubes activated in the third layer of the muon system. At the second step photons in these events were identified. A cluster in the liquid krypton calorimeter is considered as a photon if it is not associated with reconstructed tracks in the drift chamber and has no time-of-flight counters activated in front of it. According to a Monte Carlo simulation based on the GEANT3 package [21], the photon detection efficiency for the decay in the investigated energy range with the above criteria is nearly constant with sufficient accuracy.
The number of multihadron decays of selected at the first step of analysis is
| (3) |
where [1] and are the branching fraction and selection efficiency for multihadron decays and is the fraction of nonresonant multihadron plus other background (mainly Bhabha) events that passed selection criteria. The number of signal photons is
| (4) |
where is a selection efficiency for multihadron decays and is a photon selection efficiency. Hence
| (5) |
According to the Monte Carlo simulation of decays using the generator [22], based on the JETSET code [23] and adopted by the BES Collaboration for charmonium decays, the selection efficiencies and are close (87.9% and 89.0%, respectively). Many systematic errors appearing due to selection cuts substantially cancel in their ratio, so these efficiencies were taken from the simulation during the branching fraction calculation. The photon selection efficiency was determined by imposition of MC photons on the multihadron events selected in the experimental decays. A small correction was applied to take into account a difference between the selection efficiency of photons, imposed on MC decays and multihadron decays. This difference was taken as an estimate of the systematic error for . The fraction was determined from the data sample collected at the energy of 10 MeV below the resonance and is equal to .
In Fig. 2a,b the inclusive photon spectrum and its fit are shown.
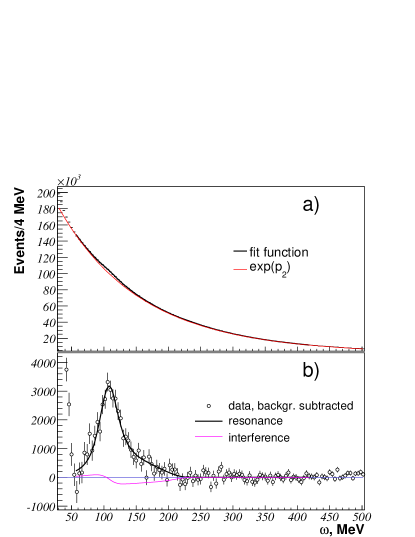
The spectrum was fit with a sum of the signal having the shape (2), convolved with the calorimeter response function, and background. The calorimeter response function was approximated with a logarithmic normal distribution [24] with MeV at 110 MeV and asymmetry .
The background has the following shape:
| (6) |
where is a second-order polynomial and MIP is the spectrum of charged particles. The first term in the expression (6) well describes background in the photon energy range of MeV. These photons arise mainly from decays, other processes give a small contribution. At lower photon energies background is not described by such a simple form because of the additional significant contribution from neutral clusters appearing due to nuclear interactions of hadrons in the calorimeter. Due to inefficiencies of track reconstruction and TOF counters, a small part of charged particles is misidentified as neutrals, so the scaled histogram of charged particles was added to the background function during the fit of the photon spectrum. In the fit, parameters of the polynomial and coefficient were varied freely. The number of signal photons determined from the fit is equal to , while the number of the multihadron events selected is .
The fit gives the following values of the mass, width and branching fraction of decay: MeV/, MeV and . The mass and width values are determined from the spectrum shape in the region of the resonance peak, thus for them the model uncertainty related to lineshape is small. At the same time this uncertainty for the branching fraction is mainly determined by the tail of the spectrum and is much larger. The fit of the spectrum using the lineshape (2) with gives , i.e. the decay rate can, in principle, be determined just by the tail. Thus, the large model uncertainty for the branching fraction makes its measurement hardly meaningful.
However, it is possible to define another quantity, which characterizes the decay rate and is less model-dependent. To do that, let us write the photon spectrum of decay in the form
| (7) | ||||
where
| (8) |
| (9) |
The resonance height in the fit weakly depends on the lineshape chosen, because due to the factor the spectrum quickly tends to zero to the left of the resonance. Thus, the measured value has small model uncertainty. Besides, if the resonance width tends to zero, the factor tends to unity, i.e. is the partial decay width in the case of a narrow resonance, and can be directly compared to theoretical calculations [6, 7, 8, 9, 10, 11, 12, 13]. Thus, this quantity has clear physical meaning and can be used as a characteristic of the decay rate. For our lineshape model the factor is about 1.12 and keV.
A statistical error of the width obtained in the fit is much larger than the accuracy of its world average of MeV, therefore the final values for mass and are obtained from the fit with fixed MeV: MeV/, keV. A systematic error related to the uncertainty of the width is estimated varying this value in the fit by 1.0 MeV.
The above results were obtained without taking into account interference effects. However, decays can interfere with other radiative decays of into the same final multihadron state . At first glance, for the inclusive spectrum these effects should be small due to a lot (many dozens) of decay channels and different relative phases of interference. However, recently the BESIII Collaboration published [25] results of a measurement of the mass and width analyzing six exclusive decay modes of decay, where it was found that the phases of interference with nonresonant background are close to each other for all decay modes. If the same holds for decays, then the interference effects for the inclusive spectrum may be not small and should be also taken into account.
First of all, note that the decay amplitude can interfere with the amplitude of the decay. Since the meson also decays mainly through two gluons, the lower-order Feynman diagrams for these processes are the same. Therefore it can be assumed that in these decays the relative interference phases are close for all decay channels (if the quantum numbers of the final systems are the same). Second, processes , , when one of the final hadrons radiates an additional photon (FSR), should be also taken into account. However, in this case the diagrams of these processes are different, therefore it is reasonable to assume that the relative phases are different as well.
According to this, the inclusive photon spectrum in the decay taking into account interference with decays can be written in the form
| (10) | ||||
where are resonant amplitudes, - nonresonant amplitudes of the k-th channel of decays through , , , , , and are resonant and nonresonant phase, respectively. Partial widths for these decays are known for few decay channels, so we can only estimate an upper bound of this interference contribution, replacing the sum in the expression with unity. After that (10) takes the form which is analogous to interference in the single decay channel:
| (11) |
where for a nonresonant term the explicit energy dependence according to [26] is specified.
To estimate the magnitude, MC simulation of decays using the generator [22] was performed. The generator poorly reproduces the experimental photon spectrum of decays, thus from the simulation has been corrected using data for this process [27]. An additional correction was made assuming that only a fraction of the decay amplitude with the same quantum numbers of the -system and interferes. The probability for the -system to have in this decay was calculated in the lowest order in [28] and equals 0.3 for small . With these corrections we estimate the value as of . The FSR contribution to interference was also estimated with the help of additional simulation in which the final state radiation was modeled using the PHOTOS [29] package, and phases of different decay channels were generated randomly. Its value was found to be small compared to the contribution.
The fit taking into account interference according to the expression (11), with fixed to of and phase varied freely, gives the following values of mass, width and decay rate: MeV/, MeV, keV. In Fig. 2b the interference contribution in this case is shown. The value of the obtained phase is close to zero, so the values of parameters for the second solution are almost the same. The magnitude of is quite small, therefore interference changes the measured values only slightly. These shifts are considered as systematic uncertainties due to interference effects.
The main resulting systematic uncertainties are shown in Table 1.
| Systematic error | , MeV/ | , MeV | , keV |
|---|---|---|---|
| Background subtraction | 0.8 | 1.4 | 0.11 |
| Calorimeter response function | 2.2 | 0.8 | 0.07 |
| Lineshape | 0.7 | 2.8 | 0.05 |
| width | 0.3 | - | 0.06 |
| Interference effects | -2.1 | +2.3 | -0.18 |
| Photon selection efficiency | - | - | 0.16 |
| width | - | - | 0.09 |
To estimate the systematic uncertainty related to the background subtraction, we varied the range of the fit, changed the order of the polynomial in the first term of (6) from the second to third, and fitted the spectrum without taking into account time-of-flight counters. The systematic errors for the mass, width and , appearing due to a poorly known photon lineshape were estimated by changing the low energy cut-off parameter to , and taking . The calibration of the photon energy scale was performed using decays. Within it agrees with the calibrations made with a data sample collected at the peak, using , transitions. No scale shift was observed for different seasons of collecting data. The systematic error related to the shape of the calorimeter response function was estimated by varying parameters and of a logarithmic normal distribution. Shifts of measured values due to interference effects in the table are given with signs.
4 Results and conclusions
A new direct measurement of decay was performed. We measured the mass, width and decay rate of the decay. These parameters are sensitive to the lineshape of the photon spectrum in this decay and it was taken into account during analysis.
Our results for the mass and width are
MeV/,
MeV.
These parameters were earlier measured in and meson decays as well as in and collisions. Measurements of Crystal Ball [5], MARK3 [30], BES [31, 32], and KEDR were performed using radiative decays of the resonance, therefore a mass shift due to an asymmetric lineshape should be taken into account. Crystal Ball and KEDR made such a correction in their experiments, whereas MARK3 and BES did not. Therefore we believe that MARK3 and BES results on the mass should be corrected by approximately 4 MeV towards higher values due to this effect. Interference effects for exclusive decays may give not small shifts and should be also analyzed.
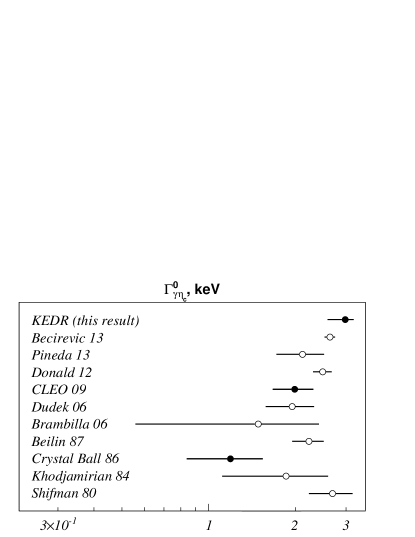
Crystal Ball and CLEO measurements as well as with theoretical predictions. The Crystal Ball and CLEO results on were evaluated using their measured branching fractions from the formula
| (12) |
where keV is the width. Factors were calculated from formula (9). For Crystal Ball the function was taken and integration was made from 40 to 165 MeV, which corresponds to the range of their spectrum fit. For CLEO the function and [1] were used. The resulting values of equal 0.96 and 0.99, and partial widths are keV and keV, respectively. Our decay rate value is significantly higher compared to those experimental results, but is well consistent with the latest lattice QCD prediction [12]: keV.
The authors are grateful to N. Brambilla, V.L. Chernyak, A.I. Milstein and A. Vairo for useful discussions. This work was supported by the Ministry of Education and Science of the Russian Federation, grant No. 14.518.11.7003, RFBR grants 08-02-00258, 10-02-00695, 11-02-00112, 11-02-00558, 12-02-00023, 12-02-01032, 12-02-91341, RF Presidential Grants for Sc. Sch. NSh-5655.2008.2, NSh-5320.2012.2 and NSh-2479.2014.2 as well as the DFG grant GZ: HA 1457/9-1.
References
- [1] J. Beringer et al., Phys. Rev. D 86, 010001 (2012).
- [2] E.E. Eichten et al., Rev.Mod.Phys. 80, 1161 (2008).
- [3] N. Brambilla et al., Eur.Phys.J. C 71, 1534 (2011).
- [4] N. Brambilla et al., arXiv:1404.3723.
- [5] J.Gaiser et al., Phys. Rev. D 34, 711 (1986).
- [6] M. Shifman, Z. Physik C 4, 345 (1980).
- [7] A.Yu Khodjamirian, Sov. J. Nucl. Phys. 39, 614 (1984).
- [8] V.A. Beylin, A.V. Radyushkin, Sov. J. Nucl. Phys. 45, 342 (1987).
- [9] N. Brambilla, Yu Jia, A. Vairo, Phys. Rev. D 73, 054005 (2006).
- [10] J.J. Dudek et al., Phys. Rev. D 73, 074507 (2006).
- [11] G. C. Donald et al., Phys. Rev. D 86, 094501 (2012).
- [12] D. Becirevic and F. Sanfilippo, JHEP 01, 028 (2013).
- [13] A. Pineda and J. Segovia, Phys. Rev. D 87, 074024 (2013).
- [14] C. Amsler et al., Phys. Lett. B 667, 1 (2008).
- [15] R.E. Mitchell et al., Phys. Rev. Lett. 102, 011801 (2009).
- [16] N. Brambilla et al., arXiv:1012.0773.
- [17] R. Loudon, The quantum theory of light, Clarendon Press, Oxford, 1973.
- [18] V.V. Anashin et al., Physics of particles and nuclei, 44, 657 (2013).
- [19] V.V. Anashin et al., Stockholm 1998, EPAC 98*, 400 (1998), Prepared for 6th European Particle Accelerator Conference (EPAC 98), Stockholm, Sweden, 22-26 Jun 1998.
- [20] V.E. Blinov et al., Nucl. Instr. and Meth. A 598, 23 (2009).
- [21] R.Brun et al., GEANT 3.21, CERN Program Library Long Writeup W5013 (1993), unpublished.
- [22] J.C. Chen et al., Phys. Rev. D 62, 034003 (2000).
- [23] T. Sjostrand, M. Bergson, Comput. Phys. Commun. 43, 367 (1987).
- [24] V.M. Aulchenko et al., Nucl. Instr. and Meth. A 379, 475 (1996).
- [25] M. Ablikim et al., Phys. Rev. Lett. 108, 222002 (2012).
- [26] K.Koller and T.Walsh, Nucl. Phys. B140, 449 (1978).
- [27] D. Besson et al., Phys. Rev. D 78, 032012 (2008).
- [28] A. Billoire et al., Phys. Lett. 80B, 381 (1979).
- [29] E. Barberio and Z.Was, CERN-TH.7033/93.
- [30] Z. Bai et al., Phys. Rev. Lett. 65, 1309 (1990).
- [31] J.Z. Bai et al., Phys. Rev. D 62, 072001 (2000).
- [32] J.Z. Bai et al., Phys. Lett. B 555, 174 (2003).