-Cluster Structure of 18O
Abstract
- Background:
-
Clustering phenomena in nuclei provide an opportunity to understand the interplay between cluster and nucleon degrees of freedom.
- Purpose:
-
To study resonances in the 18O spectrum, populated in 14C+ elastic scattering.
- Method:
-
The Thick Target Inverse Kinematics (TTIK) technique was used to measure the excitation function for the 14C+ elastic scattering. A 42 MeV 14C beam was used to populate states of excitation energy up to 14.9 MeV in 18O. The analysis was performed using a multi-level, multi-channel R-Matrix approach.
- Results:
-
Detailed spectroscopic information, including spin-parities, partial - and neutron- decay widths and dimensionless reduced widths, was obtained for excited states in 18O between 8 and 14.9 MeV in excitation energy. Cluster-Nucleon Configuration Interaction Model calculations of the same quantities are performed and compared to the experimental results.
- Conclusions:
-
Strong fragmentation of large -cluster strengths is observed in the spectrum of 18O making the -cluster structure of 18O quite different from the pattern of known quasi-rotational bands of alternating parity that are characteristic of , even-even nuclei like 16O and 20Ne.
pacs:
21.10.-k, 21.10.Hw, 25.55.Ci, 27.20.+nI Introduction
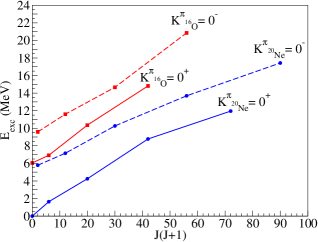
The concept of -clustering has been successfully applied to explain multiple features in the nuclear spectrum. In particular, a number of known structure peculiarities in light even-even nuclei such as 8Be, 12C, 16O, and 20Ne, is associated with clustering. The most striking are the inversion doublet quasi-rotational -cluster bands Horiuchi and Ikeda (1968), as shown in Fig. 1. All members of these bands that have excitation energies above the -decay threshold, posses -reduced widths close to the single particle limit, indicating their extreme -cluster character. Extensive experimental and theoretical studies Ames (1982); Billen (1979); John et al. (1969); Riedhauser (1984); Freer (2007); Horiuchi and Ikeda (1968); Suzuki (1976); Kanada-En’yo and Horiuchi (1995) have suggested an interpretation of these bands as well developed +core structures.
It has proven to be far more difficult to study clustering phenomena in non-self-conjugate, nuclei because the “extra” nucleons introduce additional degrees of freedom which may modify, create, enhance or destroy cluster structures. In addition experimental studies require a more complicated analysis due to the presence of low-lying nucleon decay channels and a higher level density than in , even-even nuclei.
In , even-even nuclei the -decay threshold is usually lower in energy than the nucleon decay threshold. However, for nuclei like 18O the energy thresholds for neutron and -decay are close (in the mirror nucleus, 18Ne, both the proton and the two-proton thresholds are below the -threshold), so one can expect that the decay properties of the states with both large and small -widths in nuclei also contain information on the nucleon widths. The closeness of the decay thresholds for nuclei allows one to explore the interplay between the single nucleon and cluster degrees of freedom.
Several different theoretical approaches were developed to describe the cluster and single particle phenomena simultaneously. The Antisymmetrized Molecular Dynamics (AMD) Kanada-En’yo and Horiuchi (2001) and Fermionic Molecular Dynamics Neff and Feldmeier (2008) approaches were particularly successful. Within these frameworks clustering emerges from nucleon-nucleon interactions without the need to introduce clusters a priori. The ab initio, Green’s Function Monte Carlo (GFMC) calculations were also successful in reproducing clustering for the ground state of 8Be(g.s.) Wiringa et al. (2000).
An approach to clustering exploiting the Elliott SU(3) model Elliott (1958) under the assumption that the wave functions of clustered states possess and unmixed SU(3) symmetry has been particularly successful in studies of multi-cluster systems such as 8Be,10Be,12C,16O,32S Gnilozub et al. (2006, 2007, 2008); Wolsky et al. (2010); Gnilozub et al. (2013). However, purely algebraic models lack configuration mixing and are not expected to describe complex spectroscopy of states such as those in 18O with two valence neutrons.
The emergence of clustering in large scale shell model calculations is also of interest. Ideally, the complete shell model basis with the inclusion of the reaction continuum is sufficient for the description of the cluster structures in a nucleus. However, practically, it is often necessary to restrict the basis of the shell model wave functions, thus losing a large fraction of the -cluster components. For example, recent ab initio calculations Maris et al. (2009) show difficulties in obtaining a correct excitation energy for the well known -cluster second 0+ state in 12C. Comparison of clustering observables to the shell model predictions addresses the emergence of cluster configurations as basis increase in size and highlights the interplay between single-nucleon and cluster degrees of freedom in NZ nuclei.
The goal of this paper is to examine the structure of 18O using detailed R-matrix analysis of the 14C+ elastic scattering excitation functions and to examine the results using shell model. In our work we use Cluster-Nucleon Configuration Interaction Model (CNCIM) Volya and Tchuvil’sky , which represents the latest developments of the shell model approach to clustering.
There have been many experimental efforts to study the -cluster structure of 18O using different approaches Zhao et al. (1989); Buchmann et al. (2007); Fortune and Kurath (1978); von Oertzen et al. (2010); Cunsolo et al. (1981, 1982, 1983); Smithson et al. (1986, 1988); Sanders (1956); Bair et al. (1966); Wagemans et al. (2002); Cobern et al. (1981); Yildiz et al. (2006); Curtis et al. (2002); Jahn et al. (1978); Woodworth et al. (1979); Morgan et al. (1970a); Weinman and Silverstein (1958); Goldberg et al. (2005); Johnson et al. (2009). These experiments are sensitive to cluster states of different energy, spin, width and configuration to various degree, thus they contributed valuable complimentary experimental information. The detailed R-matrix analysis of the 14C+ elastic scattering excitation functions over a wide range of energies is performed here for the first time, and summarizes several years of activity. The same experimental setup and analysis techniques are used in this work as in Johnson et al. (2009). The beam energy used here is higher than in Johnson et al. (2009) in order to study the excitation function for 14C+ at higher energies.
II Experiment and Analysis
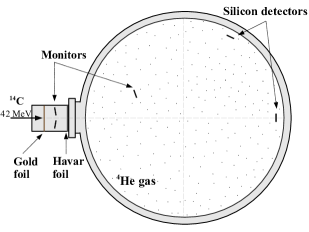
The experiment was performed at the Florida State University, John D. Fox Superconducting Linear Accelerator facility. The Thick Target Inverse Kinematics (TTIK) technique was used to measure the 14C+ elastic scattering excitation function. The technique was first suggested by Artemov et al. (1990); Goldberg and Pakhomov (1993). More details about the technique can be found in Markenroth et al. (2000); Lönnroth et al. (2010). In this approach helium gas is used as the target and the 14C ions as the beam. The pressure of the helium gas in the chamber was adjusted for the beam to stop completely inside the chamber before reaching the detectors. When an interaction between the beam and the gas target occurs, the particle gains kinetic energy from the projectile and propagates forward. Specific energy loss of the -particle is much smaller than that of 14C, which allows the -particle to emerge from the target with little energy loss. The energy spectrum of the -particles measured by the detectors, also placed in the target gas, would then reflect the 14C+ excitation function. This technique allows one to measure a large range of excitation energies without the need to change the initial energy of the beam, making the experiment more efficient and less time consuming. There is also the additional benefit of not having to use a radioactive 14C target. The 14C beam was produced by an FN Tandem Van de Graaff accelerator using a special 14C SNICS-II cesium-sputter ion source. The 14C beam of 42 MeV energy was sent into a chamber filled with 99.9% pure helium gas (4He).
To monitor the beam quality and alignment during the run a gold foil was used before the entrance window, where elastic scattering was measured by silicon detectors arranged symmetrically with respect to the beam axis. The entrance window of the chamber was covered with a 1.27 m Havar foil. In a conventional experiment (with thin target) it is usually easy to measure the intensity of the beam using a Faraday cup. In the thick target approach it is not possible, since the beam ions stop inside the target. Therefore, the intensity of the incoming beam was determined using elastic scattering of the beam ions from the Havar entrance window as measured by a monitor detector taking into account each of the components of the Havar foil. The monitor detector was placed at 15 degrees, 22 cm away from the entrance window. To calculate the elastic scattering each of the components of the Havar foil are taken into account. It was verified using the optical model that the cross section at this angle is mostly Rutherford for most of the components of the Havar foil. The contribution of each component is weighted according to the percentage of Havar chemical composition. The experimental setup is shown in Fig. 2. The accuracy of the absolute normalization is 15%. An array of silicon detectors was placed inside the chamber at angles ranging from 0∘ to 60∘ in steps of 5∘ to detect the recoiling -particles. In Fig 2 only the extreme angles for the detector positions are shown. Excitation functions covering the excitation energy region of 8-14.9 MeV were measured at 13 different angles.
The spectra of -particles measured in the laboratory frame have to be converted into c.m. excitation functions for further analysis. Because of the extended gas target the scattering angle is not fixed and has to be calculated from the energy of the recoil -particle and the known location of the detectors. The energy loss of an particle and the solid angle also depend on the location of interaction point and have to be calculated for each energy bin in the measured spectrum. This is done using a code which takes into account the relevant experimental conditions. Details of the procedure can be found in Rogachev et al. (2010).
Monte Carlo simulations based on the GEANT 3.21 library were performed in order to evaluate the dependence of the experimental energy resolution on the c.m. energy and scattering angle, and also to correct for the detector mount shadow effects in the calculation of the absolute cross section.This information was used in a convolution of the R-Matrix calculations.
The excitation functions were analyzed using a multi-level, multi-channel R-Matrix approach Lane and Thomas (1958). The details of the R-Matrix analysis can be found in Refs. Johnson (2008); Avila (2013). The results are presented by quoting the quantum numbers and energies of the resonances together with the partial decay width for every open channel. The width is also expressed via the dimensionless reduced width parameter , which represents the ratio of the observed decay width relative to the single-particle limit. This dimensionless reduced width was compared with spectroscopic factors from theoretical calculations. The and neutron decay channels of 18O were included in the fit. For the 14C(,n) reaction the decay channels to the ground state and to the first excited state of 17O were included. At 14C beam energies above 27.4 MeV the inelastic channel 14C(,) is also open. It is not possible to distinguish between the -particles coming from elastic and inelastic reactions in this specific realization of the TTIK approach. Due to the negative Q-value for the inelastic scattering (-6.1 MeV) the recoiled -particles from inelastic events would have significantly smaller energy than the elastically scattered -particles from the same location in the target, and would show up in the elastic scattering spectrum as background at low energies. A direct comparison with the low energy data from the previous experiment Johnson et al. (2009), performed at 25 MeV, where the inelastic channel was not open, showed no evidence of inelastic contribution.
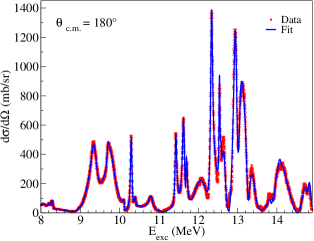
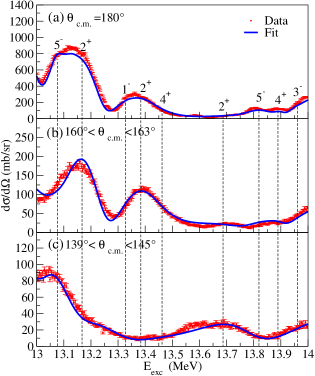
A total of fifty-four resonances were used to fit the data. The excitation function at 180∘ in the c.m. for the entire energy range measured in this experiment is shown in Fig. 3. The uncertainties of the best fit parameters were determined using a Monte Carlo procedure. The parameter values were varied randomly, but only values that produced no more than one standard deviation from the best fit values where excepted. The resulting distribution of parameter values was used to determine the uncertainty. This was done state by state, not taking into account correlation between different states. Therefore the provided uncertainties give good indication on the sensitivity of the fit to the specific parameters, but the actual uncertainty values may be enhanced if correlation between the states is taken into account.
Detailed description of the observed spectra is given in the next section.
III Discussion of the 18O spectrum at excitation energies between 8.0 MeV and 14.9 MeV
This section contains a detailed discussion of the properties of the states in 18O extracted from the experimental data of this work. Also, the results are compared to the available data from previous experimental studies. The discussion is structured according to the excitation energies of the resonances, which are grouped into 1 MeV intervals.The experimental data are used for calculating the dimensionless reduced and nucleon widths, which are defined as ratios of the corresponding reduced widths to the corresponding single particle limit ()). Here and are, respectively, the reduced mass and channel radius for the corresponding decay channel (5.2 fm for decay and 4.6 fm for nucleon decay).
III.1 Resonances in the excitation energy range between 8.0 MeV and 9.0 MeV
The lowest excitation energy state that is clearly visible in the measured excitation function is the known 1- state at 8.0378(7) MeV Tilley et al. (1995). This is a narrow state with a width significantly smaller than our experimental resolution (40 keV at 1.8 MeV in the c.m.), and therefore a direct measurement of the width was not possible. However, this state is below the neutron decay threshold (8.044 MeV), and only one decay channel is open, decay to the ground state of 14C. If the effects related to interference with other states are neglected, then the width of the state can be determined from the measured experimental cross section (, where is the experimental energy resolution calculated using Monte Carlo simulation). The width of this state was determined as 2.0(7) keV. The only definitive width measurement for this state, made prior to this experiment, was reported in Buchmann et al. (2007) where this state was populated in the -decay of 18N, and a width of 0.95 keV was determined. The result of this work is in fair agreement with that of Buchmann et al. (2007) and the upper limit for the width given in Tilley et al. (1995). This width corresponds to the dimensionless reduced width of only , so that this state does not have a strong overlap with the 14C(g.s)+ configuration. This finding contradicts previous suggestions made in Ashwood et al. (2006); von Oertzen et al. (2010) that this state might be the band head of the negative parity, inversion doublet, -cluster quasi-rotational band.
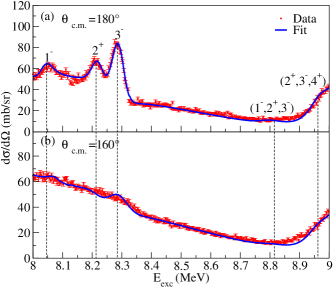
Four more states are observed in the 8 to 9 MeV excitation region (Fig. 4). The 8.213(4) MeV 2+ state is a well known narrow state Tilley et al. (1995)that is above the neutron decay threshold and has been observed in the 14C(,n) reaction Sanders (1956); Bair et al. (1966). In Sanders (1956) the state was observed at 8.223 MeV with a width of 1.6(10) keV, and in Bair et al. (1966) the state was located at 8.217 MeV with a width of 1(1) keV, but spin and party were not assigned to it. The inverse reaction 17O() has also been studied in Wagemans et al. (2002), where the 2+ state was found at 8.213(4) MeV with width of 2.26(14) keV. In the 14C(,) elastic scattering studied by Weinman and Silverstein (1958) the 2+ state was observed at 8.222 MeV and its width was determined to be 1.2(8) keV. In this work the combined analysis of the 14C(,) and 14C(,n) data constrains the properties of this state rather well. The 2+ state is observed at 8.22(1) MeV and its dimensionless reduced width is 0.03 and the total width is 1.9(2) keV.
A 3- state is observed at 8.290(6) MeV with a width of 8.5(9) keV. This is the dominant feature in the 14C(,n) spectrum and also is prominent in the 14C(,) excitation function. The properties of this state can be constrained reasonably well from these two data sets. We determine that this state has a significant dimensionless reduced width of 0.18 and is the only 14C(g.s.)+ cluster state in the 8-9 MeV region. It was observed earlier in Sanders (1956); Weinman and Silverstein (1958) at 8.293 MeV with a width of 10(1) keV and 7.7(9) keV respectively. In Bair et al. (1966) the narrow state was found at energy of 8.287 MeV but the spin assignment was not made. The 3- state was also observed in Wagemans et al. (2002) at 8.282(3) MeV with a width of 14.74(59) keV. The results of the present work are in good agreement with the parameters found in Weinman and Silverstein (1958); Sanders (1956) and in fair agreement with Bair et al. (1966), but disagree with the neutron and -partial widths determined in Wagemans et al. (2002). The partial width is 2.9(2) keV and the neutron width is 5.6(7) keV here, whereas in Wagemans et al. (2002) the partial width and neutron width were 13.661(416) keV and 1.08(2) keV, respectively. When the parameters from Wagemans et al. (2002) are used in the analysis, the 14C(,n) spectrum is still well reproduced but the 14C(,) spectrum is not.
The state at 8.82(3) MeV with width of 60(10) keV is clearly visible in the 14C(,n) spectrum (Fig. 11), but its evidence in the 14C(,) spectrum is weak. This state has been observed earlier in Sanders (1956) at 8.832 MeV with a width of 100(20) keV and in Bair et al. (1966) at 8.809 MeV and with a width of 80(20) keV, both from the 14C(,n) reaction. However, spin and parity assignments were not made. A state at 8.82 MeV with a width of 70(12) keV was observed in Sellers et al. (1995) using 18O and a tentative (1+) spin-parity assignment was made. If this unnatural parity assignment is correct then the state cannot be observed in the 14C(,n) or 14C(,) reactions. Therefore these results should correspond to two different states, or the assignment of unnatural parity is not correct. It is not possible to determine the spin of the state from our data since it is barely seen in the 14C(,) spectrum, and different spin assignments (1-,2+,3-) fit the 14C(,n) and the 14C(,) spectra fairly well.
The 8.96(1) MeV state with a width of 70(30) keV shows up as a small bump in the 14C(,) spectrum, and it is a relatively strong state in the 14C(,n) excitation function. It was observed in Sanders (1956) at 8.966 MeV with a width of 54(3) keV, and in Bair et al. (1966) at 8.956 MeV with a width of 65(10) keV. The 4+ assignment was made for this state in Sellers et al. (1995). A pair of states around 9.0 MeV was observed in the 16O(t,p) reaction in Cobern et al. (1981). Indirect arguments were given supporting the 4+ assignment for at least one of them Fortune et al. (1985) and it was argued in Fortune et al. (1985) that a 4+ state at 9.0 MeV probably has configuration. Our data are consistent with a 4+ assignment for the 8.96 MeV, however 2+ and 3- assignments cannot be excluded. If the 4+ assignment is correct then this state has a substantial -cluster component (see discussion in section V).
III.2 Resonances in the excitation energy range between 9.0 MeV and 10.0 MeV
This energy region is defined by the double peak structure with a very large 14C(,) cross section at c.m. angles close to 180∘. This structure is the result of interference between several broad overlapping -cluster resonances, which makes the analysis very difficult. Six resonances were used to fit this energy range with five of them having very large dimensionless reduced -widths.
Two broad 1- states are observed. The first one at 9.19(2) MeV shows up as the tail on the left side of the first broad peak (mainly a 3- state) at 180∘ shown in Fig. 5 (a). This state can also be seen as the first peak shown in Fig. 5 (b) at 140∘. At 140∘ the contribution from the 3- state disappears, which makes the 1- state very obvious. This state was first observed in Zhao et al. (1989) at about 9.2 MeV and with a partial -width close to 500 keV (although, it was interpreted as the interference of six unresolved states), and then in Buchmann et al. (2007) using -delayed emission of 18N. In Buchmann et al. (2007) the excitation energy and partial -width of this 1- state are reported to be 9.16(10) MeV and 420(200) keV respectively. The 1- state was also suggested in Goldberg et al. (2005) at 9.027 MeV with a width of 500 keV. Our analysis indicates that the width of this state is 220(30) keV, which is significantly smaller, but still within the large error bars of Buchmann et al. (2007). This state also has a smaller width when compared to Goldberg et al. (2005). However, the analysis in Goldberg et al. (2005) does not take into account interference with other states, which can lead to overestimation of the width.
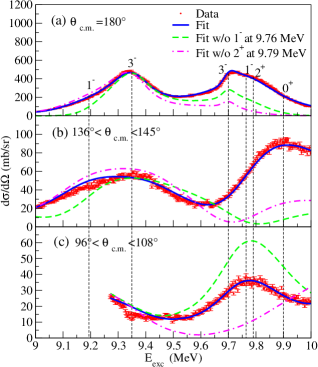
The width of the state is dominated by the partial -width and it has a dimensionless reduced width is =0.20. While it is a factor of two smaller than in Buchmann et al. (2007), it is still large enough for the state to be considered as a strong cluster state with 14C(g.s)+ configuration.
The other 1- state is at 9.76(2) MeV with a width of 700(120) keV. The parameters of this state are in good agreement with Buchmann et al. (2007) where it was observed at 9.85(50) MeV and with a partial -width of 560(200) keV. Constructive interference of this state and a 2+ state at 9.79 MeV makes a strong contribution to the second peak at 180∘ and 140∘, as can be seen in Fig. 5 (a,b). The dashed curve in Fig. 5 shows the R-Matrix fit without the inclusion of this 1- state.
Two 3- states are observed in this energy region. The first one at 9.35(2) MeV is a dominant -cluster resonance and makes a dominant contribution to the first broad peak at 180∘ in Fig. 5(a). This state produces a very prominent peak in the 14C() reaction also, as can be seen in Fig. 11. The state was observed in Curtis et al. (2002) at 9.35 MeV, and a suggestion of a 2+ or 3- spin-parity assignment was made. In Manley et al. (1990) a state at 9.36 MeV with a 2+ or 3- spin parity assignment was observed but its small width of 20 keV indicates that this may not be the same state. A 3- state was also suggested in Goldberg et al. (2005) at 9.39(2) MeV with a width of 200(20) keV. Our best fit for the width is 180(30) keV, with a dimensionless reduced width of 0.48. This is the strongest -cluster state in this energy range.
The other 3- state is at 9.70(1) MeV and has a width of 140(10) keV. This state has a small dimensionless reduced width, and therefore little influence on the elastic cross section. It is needed, however, to reproduce the neutron spectrum as is shown in Fig. 11. This state gives little contribution to the shape of the second peak at 180∘ (Fig. 5(a)), but no influence at 140∘ (Fig. 5(b)) indicating a 3- spin-parity assignment. A state was observed in Sellers et al. (1995) at 9.71(1) MeV and it was identified as a tentative (5-) state. It was also seen in Curtis et al. (2002) at 9.70 MeV where a tentative (1-,2+,3-) assignment was made. A 3- state was observed by Goldberg et al. (2005) at 9.711(15) MeV with a width of 75(15) keV. In reference von Oertzen et al. (2010) a 3- state was suggested at similar energy (9.715(5) MeV) but with a much smaller width.
A 2+ state was found at 9.79(6) MeV with a width of 170(80) keV and dimensionless reduced width of 0.1. This state strongly interferes with the 1- state at 9.76(2) MeV, which makes a large contribution to the second peak at all angles shown in Fig. 5. At angles close to 90∘ the cross section for any negative parity states vanish, which makes the existence of this 2+ state very evident as shown in Fig. 5 (c). The dash-dotted curve in Fig. 5 shows the R-Matrix fit without this 2+ state.
The last state in this energy range is a very broad 0+ state at 9.9(1) MeV with partial width of 3.2(8) MeV. A more detailed discussion of this state will be given in Section VI.
III.3 Resonances in the excitation energy range between 10.0 MeV and 11.0 MeV
Six resonances were used to fit this energy region and only one resonance has a dimensionless reduced -width of more than 10% of an single particle width. This region has well defined resonances and most of them can be seen as distinct peaks at 180∘ in Fig 6(a).
Two 3- states were observed in this region and they are fairly obvious narrow peaks in the large c.m. angle data shown in Fig. 6(a), at 10.11(1) and 10.395(9) MeV. They are also important resonances in the 14C(,n) spectra as can be seen in Fig. 11. The widths of these states are 16(5) and 70(20) keV, respectively. These states have also been identified in previous works Tilley et al. (1995); Goldberg et al. (2005); von Oertzen et al. (2010). In Goldberg et al. (2005) the width for both states was determined to be 45(8) keV at 10.10(1) and 10.365(10) MeV. In von Oertzen et al. (2010) these states were at 10.111(5) and 10.400(7) MeV with widths of 12 keV and 30 keV, respectively.
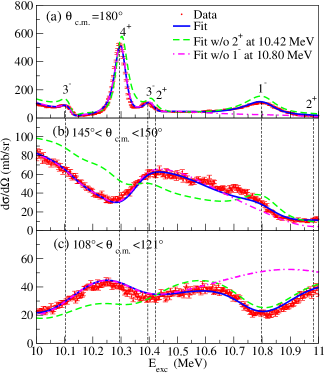
Two 2+ states were observed. The first 2+ is at 10.42(1) MeV and has a width of 180(40) keV and it strongly interferes with its neighboring states. Its presence is needed to reproduce the minimum at 10.3 MeV at 147∘ (Fig. 6(b)). At 110∘ this state contributes to the first broad peak shown in Fig. 6(c). The dashed line in Fig. 6 shows the fit without the inclusion of this 2+ state. A 2+ state at 10.43(15) MeV was suggested earlier in Goldberg et al. (2005) with the somewhat larger width of 500(150) keV.
The second 2+ state is at 10.98(4) MeV and has a width of 280(130) keV. This state is weak in the 14C(,) channel. However, due to its interference with a broad 2+ state at higher energy it helps to shape the cross section at 150∘ at around 11 MeV.
A sharp 4+ state is observed at 10.290(4) MeV with a width of 29(4) keV. This well known state is seen as the peak with a large cross section at 180∘ (Fig. 6(a)) and has been observed previously in von Oertzen et al. (2010); Morgan et al. (1970a); Cunsolo et al. (1981); Curtis et al. (2002); Goldberg et al. (2005); Ashwood et al. (2006); Sellers et al. (1995); Cobern et al. (1981); Smithson et al. (1988); Jahn et al. (1978); Yildiz et al. (2006).
The last state in this energy region is a state at 10.80(3) MeV with a width of 690(110) keV. This state is seen as the broad peak at 180∘ shown in Fig. 6 (a). At angles close to 118∘ this state is needed to reproduce the minimum in the cross section shown in Fig. 6 (c). In Fig 6 the dash-dotted line shows the R-matrix fit without this 1- state. A 1- state was previously seen by Buchmann et al. (2007) at 10.89(10) MeV with a partial -width of 300(100) keV. The partial -width in our best fit is 630(90) keV.
III.4 Resonances in the excitation energy range between 11.0 MeV and 12.0 MeV
Seven resonances were used to fit this energy region. Three of these resonances have dimensionless reduced widths of more than 10%.
A 2+ state is observed at 11.31(8) MeV with a width of 250(100) keV. This state contributes to the first peak shown in Fig. 7 (a,b) mostly due to interference with a broad 2+ state at higher excitation energy. At angles close to 125∘ the cross section for a 2+ state vanish having no effect on the cross section in Fig. 7 (c). The dashed curve in Fig. 7 represents the R-matrix fit without the inclusion of this state. A broad 2+ state at 11.39 MeV was suggested in Morgan et al. (1970a).
A 4+ state is observed at 11.43(1) MeV with a width of 40(10) keV. This state is the main contributor to the peak shown in Fig. 7(a,b) and was previously seen in Morgan et al. (1970a); Cunsolo et al. (1981); Woodworth et al. (1979); Ashwood et al. (2006); Goldberg et al. (2005); Smithson et al. (1988); von Oertzen et al. (2010). It was suggested as a (4+) by Morgan et al. (1970a) and later by Cunsolo et al. (1981); however, the width was not measured. In Goldberg et al. (2005) it was found at 11.415(5) MeV with a width of 45 keV, which is in good agreement with our findings. In von Oertzen et al. (2010) this state was at 11.423(5) MeV with width of a 35 keV. This state is also visible in the 14C(,n) spectrum (Fig. 11).
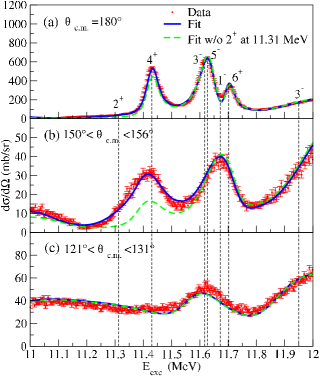
Two 3- states were observed in this energy range. The first one is at 11.62(3) MeV and has a width of 150(20) keV. This state is needed to reproduce the second peak in Fig. 7 (b). In Sellers et al. (1995) a state at 11.67(2) MeV with a width of 112(7) keV was identified as a possible 3- state, which agrees with our values. The second 3- state is at 11.95(1) MeV. It is a broad state in both the 14C(,) and the 14C(,n) spectra with a total width of 560(70) keV. It has a strong influence at all angles except at angles close to 140∘, making this a good indicator for a 3- state. This state brings the cross section up at energies around 12 MeV at all the angles shown in Fig. 7 and is one of the states with a larger degree of clustering in this energy range with dimensionless reduced -width of 0.17. In the 14C(,n) spectrum this state is seen as a broad peak (Fig. 11).
There is the well known 5- state observed at 11.627(4) MeV with a width of 40(5) keV. It can be seen as the second peak in Fig. 7(a), and it also contributes to the peak in Fig. 7 (c). It has no contribution to Fig. 7(b) because at 155∘ the cross section for a 5- state becomes zero. It has a significant dimensionless reduced width of 0.13. This state was previously identified as 5- in von Oertzen et al. (2010); Curtis et al. (2002); Ashwood et al. (2006); Rae and Bhowmik (1984); Cunsolo et al. (1981); Yildiz et al. (2006); Goldberg et al. (2005); Smithson et al. (1988); Morgan et al. (1970a) with a width of 60(5) keV as measured in Goldberg et al. (2005) and 25 keV in von Oertzen et al. (2010).
A 1- state is observed at 11.67(2) MeV and has a width of 200(90) keV. It shows up at all angles contributing to the shape of the second peak in Fig. 7 (a,b) and to the only peak seen in Fig. 7(c). In Buchmann et al. (2007) a 1- state with partial width of 220(100) keV was found at 11.56(10) MeV.
There is one 6+ state at 11.699(5) MeV with a width of 23(2) keV. This state is the last peak seen in Fig. 7 (a). It has a dimensionless reduced -width of 0.23, and is recognized as the first strong 6+ -cluster state. There is a strong interference between this state and another 6+ state found at a higher energy that was previously observed and identified as 6+ in von Oertzen et al. (2010); Morgan et al. (1970a); Cunsolo et al. (1981); Smithson et al. (1988); Goldberg et al. (2005). The width of this state was determined to be 35(5) keV in Goldberg et al. (2005) and 27 keV in von Oertzen et al. (2010).
III.5 Resonances in the excitation energy range between 12.0 MeV and 13.0 MeV
This is an energy range with a higher density of states and strong interference among the states made this energy interval very challenging to fit. Twelve resonances were found and four of them have large dimensionless reduced -widths.
Two 1- states were observed. The first one is at 12.12(1) MeV and has a width of 410(120) keV. It contributes to the cross section of the first small bump seen in Fig. 8(a,b). A 1- or 2+ was suggested by Sellers et al. (1995) for a state at 12.09(2) MeV. The width of this state was not determined in Sellers et al. (1995). It was also seen and identified as 1- by Buchmann et al. (2007) at 12.12(10) MeV with a partial -width of 22(7) keV. The partial -width that we observed for this state is 50(10) keV in fair agreement with Buchmann et al. (2007). The other 1- state is at 12.5(1) MeV and has a width of 900(400) keV. It is important at large c.m. angles to reproduce the right side of the first peak shown in Fig. 8 (a,b). At smaller angles the interference of this state with other states brings the cross section down, making it possible to fit the rise of the cross section between 12.5 and 12.6 MeV (Fig. 8 (c)). A 1- state at 12.95(50) MeV was also observed in Buchmann et al. (2007) with a partial -width of 210(100) keV. Even though this state was found at a higher energy, our state is still within the error bars of Buchmann et al. (2007). The partial -width determined in this work, 300(100) keV, is in good agreement with that determined in Buchmann et al. (2007).
Three 2+ resonances were observed. Two of them are strong -cluster states. The first one is at 12.21(8) MeV and has a width of 1100(300) keV and a dimensionless reduced -width of 0.37. The second 2 state is at 12.90(3) MeV and has a width of 310(30) keV. It contributes to the highest energy peak seen in Fig. 8. The other 2+ state is a very broad state one 12.8(3) MeV with a width of 4.8(4) MeV. More detailed discussion about this broad state will appear in section VI.
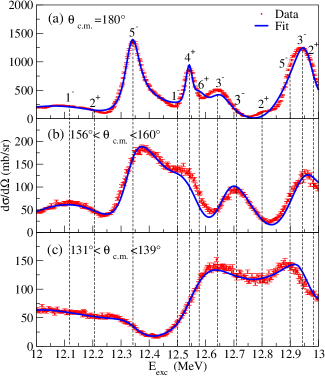
Two 5- states were observed. The first one is at 12.339(4) MeV and has a width of 39(4) keV. This state was suggested before in von Oertzen et al. (2010); Morgan et al. (1970a); Cunsolo et al. (1981); Smithson et al. (1988); Goldberg et al. (2005). In Goldberg et al. (2005) it was found at 12.317(10) MeV with a width of 80(10) keV and in von Oertzen et al. (2010) at 12.327(9) MeV with a width of 45 keV. It is evident at large c.m. angles and can be seen as the peak with larger cross section in Fig. 8 (a,b). At 130∘ this state shows up as the right part of the first bump in Fig. 8 (c). The other 5- state is at 12.94(1) MeV and has a width of 40(10) keV. This state can be seen as the last peak at all angles shown in Fig. 8. The state has a small reduced -width of =0.02, and its decay is dominated by neutron emission. It was probably observed before in the 14C(6Li,d) reaction Cunsolo et al. (1983) at 12.9 MeV, where a tentative (5-) spin-parity assignment was made.
A 4+ state was found at 12.542(4) MeV with a width of 6(3) keV. It is the second peak in Fig. 8 (a,b). It helps to produce the dip and the left side of the first peak at 135∘ (Fig. 8(c)). The 4+ strength was suggested before in Morgan et al. (1970a) at 12.5 MeV but the width of this state was not specified.
A 6+ state was observed at 12.576(9) MeV with a width of 70(20) keV. It is a strong -cluster state with a dimensionless reduced -width of 0.38. At an angle close to 160∘ the 6+ state does not Contribute and therefore it is not visible in Fig. 8 (b). However, this state becomes important at angles between 135 and 150∘, determining the shape of the cross section in Fig. 8(c). It was suggested before in Curtis et al. (2002); Cunsolo et al. (1981); Smithson et al. (1988); Ashwood et al. (2006); Morgan et al. (1970a); Goldberg et al. (2005). In Goldberg et al. (2005) it was found at 12.527(10) MeV with a width of 32(5) keV. This state was also observed in von Oertzen et al. (2010) but its width was determined to be only 24 keV. We have observed that the interference of this state with the 6+ state at 11.7 MeV significantly modifies the R-matrix parameters for both states and may be the main reason why the best fit width and excitation energy of this state in this work are different from those in Goldberg et al. (2005); von Oertzen et al. (2010).
Three 3- states were observed. The first one is at 12.642(4) MeV and has a width of 110(40) keV. The second 3- state is at 12.71(2) MeV with a width of 300(30) keV. The interference of these two states appears at higher c.m. angles as the third peak in Fig. 8 (a). The last 3- state is a very broad state and it interferes with neighboring states, making the inclusion of this state necessary for reproducing the shape of the cross section. It is at 12.98(4) MeV and has a width of 1040(200) keV and a dimensionless reduced -width of 0.32 making it a cluster state.
III.6 Resonances in the excitation energy range between 13.0 MeV and 14.0 MeV
Nine resonances were observed in this energy range. Two of them have large dimensionless reduced widths.
There is one 5- state found at 13.08(1) MeV with a width of 180(20) keV. It is a cluster state with a dimensionless reduced -width of 0.17. It is needed to reproduce the peak at 13.08 MeV near 140∘ in the c.m. (Fig. 9).
No other solution produced a good fit. The 5- state has not been observed before at this energy. However, a 5- at 13.3 MeV, which does not show up in our analysis, is suggested in the 14C(6Li,d) reaction Cunsolo et al. (1983). Also, states at 13.1 MeV and 13.26 MeV were observed in von Oertzen et al. (2010). The data indicates 5- strength in the region, but a very high level density (8 states per 400 keV interval) as well. It is possible that, due to the complexities of the spectrum and the interference effects, the excitation energy of the 5- state is shifted with respect to the transfer reaction data of Cunsolo et al. (1983); von Oertzen et al. (2010).
Three 2+ states were observed. One is at 13.17(3) MeV and has a width of 150(50) keV. This state was introduced to fit the shape of the cross section for the first peak seen at all angles in Fig. 9. The second 2+ state is at 13.38(2) MeV and has a width of 250(40) keV. It can be seen as a peak shown in Fig. 9(a,b). The last 2+ state is at 13.69(1) MeV with a width of 530(120) keV. This state shows up as the second bump in Fig. 9(c).
One 1- state is observed at 13.33(2) MeV with a width of 300(130) keV. This is a very weak state in the 14C(,) channel having a dimensionless reduced width of less than 0.01. However, it improves the fit near 13.3 MeV.
There are two 4+ states in this energy range. The first one is at 13.46(2) MeV and has a width of 540(80) keV. This state contributes to the second peak seen on Fig. 9 (a,b). It also interferes with other states bringing the cross section down at higher energies. The second 4+ state is at 13.89(1) MeV with a width of 24(10) keV. It is a very weak state in both the 14C(,) and the 14C(,) channels. It is introduced to reproduce the small bump seen in Fig. 9(a).
A 5- state was observed at 13.82(2) MeV. It is a weak state with a width of 25(6) keV. It can be seen at 180∘ as a small bump (Fig. 9(a)). Interference of this state with another 5- state at a higher energy helps to reproduce the shape of the cross section to the right side of this peak at all angles. In reference von Oertzen et al. (2010) a 5- state was seen at 13.82(2) with a width of 28 keV.
A 3- state is found at 13.96(2) MeV with a width of 150(50) keV. This state is responsible for the increase in cross section toward 14 MeV.
III.7 Resonances in the excitation energy range between 14.0 MeV and 14.9 MeV
The R-matrix analysis of this last energy interval is not very reliable because of the featureless behavior of the excitation function and because of the influence of higher-lying, unknown states that are not included in the R-matrix fit. Nevertheless, it appears that the region is dominated by strengths which is consistent with the predictions of the cluster-nucleon configuration interaction model (see Chapter V).
Nine resonances have been introduced. Four of these states have large dimensionless reduced widths. A very broad 3- state with a dimensionless reduced width of 0.7 was introduced at 14.0(2) MeV with a width of 2.6(5) MeV. The inclusion of this broad state was necessary to bring down the cross section near 14 MeV.
Three 5- states were observed. The first one is at 14.1(1) MeV and has a width of 560(70) keV and a dimensionless reduced -width of 0.23. Its presence can be seen as the first bump in Fig. 10.The second state is at 14.7(1) MeV with a width of 280(100) keV. This is a broad state with a dimensionless reduced -width of 0.16. This state appears on the left side of the last peak in Fig. 10(a,b). We used a 5- state at 14.82(7) MeV with a width of 140(60) keV and a dimensionless reduced width of 0.07 to reproduces the right side of the last peak in Fig. 10 (a,b). However, since this state is at the edge of the measured excitation energy range its parameters are very unreliable and should only be considered as an indication of 5- strength at that energy.
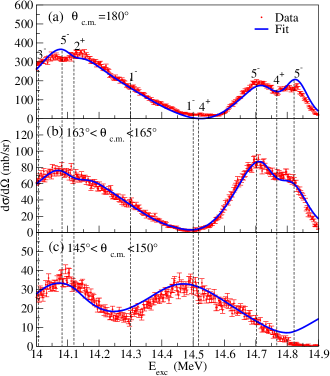
A 2+ state was observed at 14.12(7) MeV with a width of 160(60) keV. This state shapes the cross section for the first peak in Fig. 10.
There are two 1- states. One at 14.3(3) MeV and the second one at 14.5(2) MeV with widths of 900(300) and 450(220) keV, respectively. These states are more obvious at and around 150∘, where the state at 14.5 MeV is seen as the last peak in Fig. 10(c) and the state at 14.3 MeV is used to shape the cross section of the same peak.
A 4+ state was observed at 14.52(1) MeV with a width of 250(29) keV. It is needed to reproduce the near zero cross section at 14.5 MeV (Fig. 10(a,b)). Another strong 4+ state is at 14.77(5) MeV having a dimensionless reduced -width of 0.28. This state corresponds to the last peak in Fig. 10(a,b). These 4+ states make no contribution in Fig 10(c) since the cross section for a 4+ state at 150∘ is zero.
III.8 Neutron Excitation Function
The 14C() total reaction cross section data Bair et al. (1966); Morgan et al. (1970a) was used in the manual R-matrix analysis but not in the automated fit procedure. The total neutron cross section data for the excitation energy range of 8.1 MeV to 10.2 MeV was taken from Bair et al. (1966), and corresponding excitation energies above 10.2 MeV from Morgan et al. (1970a) (see Fig. 11).
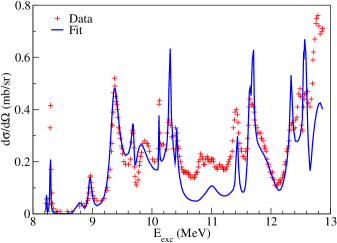
The absolute cross section was not measured in Bair et al. (1966); Morgan et al. (1970a), and, in addition, the data from Morgan et al. (1970a) was not corrected for energy variation of the detector efficiency and for neutron decays to the excited states of 17O which also contribute to the total cross section. Therefore, we do not expect the fit to match the data perfectly and we only focused on the resonance structures and their relative strengths. In order to compare the neutron data with our fit the data points were normalized to the fit curve. The data and the R-matrix fit are shown in Fig 11. The resonance structure for the (,n) excitation function is reasonably well reproduced with most of the discrepancies seen at higher excitation energies. These discrepancies are either due to the fact that some of the resonances important for the neutron channel may be too weak in the 14C(,) channel to be observed, or may be related to the neutron decay to the excited states of 17O. This decay channel is not included in the curve shown in Fig. 11. We calculated the total cross section for neutron decay to the first excited state of 17O and verified that the gap between the R-matrix fit and the experimental data at 11 MeV can be completely eliminated by this channel.
| This work | Previous data |
| Eexc | Eexc | Ref. | |||||||
|---|---|---|---|---|---|---|---|---|---|
| (MeV) | (keV) | (keV) | (keV) | (MeV) | (keV) | ||||
| 8.04(2) | 2.0(7) | 2.0(7) | - | 0.02 | 8.038 | 0.95 | Buchmann et al. (2007) | ||
| 8.0378(7) | <2.5 | Tilley et al. (1995) | |||||||
| 8.22(1) | 1.9(2) | 1.7(1) | 0.2(1) | 0.03 | 8.223 | 1.6(10) | Sanders (1956) | ||
| 8.217 | 1(1) | Bair et al. (1966) | |||||||
| 8.222 | 1.2(8) | Weinman and Silverstein (1958) | |||||||
| 8.213 | 2.26(14) | Wagemans et al. (2002) | |||||||
| 8.290(6) | 8.5(9) | 2.9(2) | 5.6(7) | 0.18 | 8.293 | (,) | 10(1) | Sanders (1956) | |
| 8.287 | 17(5) | Bair et al. (1966) | |||||||
| 8.293 | 7.7(9) | Weinman and Silverstein (1958) | |||||||
| 8.282(3) | 14.74(59) | Wagemans et al. (2002) | |||||||
| 8.82(3) | (,,) | 60(10) | 0.3(2) | 60(10) | <0.01 (if 2+) | 8.832 | 100(20) | Sanders (1956) | |
| 8.809 | 80(20) | Bair et al. (1966) | |||||||
| 8.96(1) | (,,) | 70(30) | 5(1) | 65(30) | 0.2 (if 4+) | 8.966 | 54(3) | Sanders (1956) | |
| 8.956 | 65(10) | Bair et al. (1966) | |||||||
| 8.96 | () | 43(4) | Sellers et al. (1995) | ||||||
| 9.19(2) | 220(30) | 200(10) | 20(10) | 0.20 | 9.2 | *500 | Zhao et al. (1989) | ||
| 9.16(100) | ∗420(200) | Buchmann et al. (2007) | |||||||
| 9.027 | 550 | Goldberg et al. (2005) | |||||||
| 9.35(2) | 180(30) | 110(30) | 70(5) | 0.48 | 9.36 | <20 | Manley et al. (1990) | ||
| 9.35 | (,) | Curtis et al. (2002) | |||||||
| 9.39(2) | 200(20) | Goldberg et al. (2005) | |||||||
| 9.70(1) | 140(10) | 15(2) | 125(10) | 0.04 | 9.71(1) | () | Sellers et al. (1995) | ||
| 9.70(2) | (,,) | Curtis et al. (2002) | |||||||
| 9.711(15) | 75(15) | Goldberg et al. (2005) | |||||||
| 9.715(5) | 15 | von Oertzen et al. (2010) | |||||||
| 9.76(2) | 700(120) | 630(60) | 70(50) | 0.46 | 9.85(50) | ∗560(200) | Buchmann et al. (2007) | ||
| 9.79(6) | 170(80) | 90(30) | 80(50) | 0.10 | |||||
| 9.9(1) | 3200(800) | 3200(800) | - | 1.85 | 9.9(3) | 2100(500) | Johnson et al. (2009) | ||
| 10.11(1) | 16(5) | 7(2) | 9(3) | 0.01 | 10.10(1) | 45(8) | Goldberg et al. (2005) | ||
| 10.111(5) | 12 | von Oertzen et al. (2010) | |||||||
| 10.290(4) | 29(4) | 19(2) | 10(2) | 0.09 | 10.287(10) | 30(7) | Goldberg et al. (2005) | ||
| 10.293(6) | 28 | von Oertzen et al. (2010) | |||||||
| 10.29 | Morgan et al. (1970a); Cunsolo et al. (1981); Curtis et al. (2002); Ashwood et al. (2006); Sellers et al. (1995) | ||||||||
| 10.29 | Cobern et al. (1981); Smithson et al. (1988); Jahn et al. (1978); Yildiz et al. (2006) | ||||||||
| 10.395(9) | 70(20) | 50(5) | 50(20) | 0.03 | 10.365(10) | 45(8) | Goldberg et al. (2005) | ||
| 10.400(7) | 30 | von Oertzen et al. (2010) | |||||||
| 10.42(1) | 180(40) | 40(10) | 140(40) | 0.03 | 10.43(15) | 500(100) | Goldberg et al. (2005) | ||
| 10.80(3) | 690(110) | 630(90) | 60(30) | 0.29 | 10.89(10) | ∗300(100) | Buchmann et al. (2007) | ||
| 10.98(4) | 280(130) | 20(10) | 260(120) | 0.01 | |||||
| 11.31(8) | 250(100) | 90(30) | 160(80) | 0.02 | 11.39(2) | () | Tilley et al. (1995) | ||
| 11.43(1) | 40(10) | 30(10) | 10(5) | 0.05 | 11.415(5) | 45 | Goldberg et al. (2005) | ||
| 11.423(5) | 35 | von Oertzen et al. (2010) | |||||||
| 11.62(3) | 150(20) | 30(5) | 120(20) | 0.01 | 11.67(2) | () | 112(7) | Sellers et al. (1995) | |
| 11.627(4) | 40(5) | 30(3) | 10(3) | 0.13 | 11.609(10) | 60(5) | Goldberg et al. (2005) | ||
| 11.616(8) | 25 | von Oertzen et al. (2010) | |||||||
| 11.62 | Curtis et al. (2002); Ashwood et al. (2006); Rae and Bhowmik (1984); Cunsolo et al. (1981); Yildiz et al. (2006); Smithson et al. (1988); Morgan et al. (1970a) | ||||||||
| 11.67(2) | 200(90) | 120(40) | 80(50) | 0.04 | 11.56(10) | *220(100) | Buchmann et al. (2007) |
| This work | Previous data |
| Eexc | Eexc | Ref. | |||||||
|---|---|---|---|---|---|---|---|---|---|
| (MeV) | (keV) | (keV) | (keV) | (MeV) | (keV) | ||||
| 11.699(5) | 23(2) | 12(1) | 11(1) | 0.23 | 11.695(10) | 35(5) | Goldberg et al. (2005) | ||
| 11.702(6) | 27 | von Oertzen et al. (2010) | |||||||
| 11.69 | Morgan et al. (1970a); Cunsolo et al. (1981); Smithson et al. (1988) | ||||||||
| 11.95(1) | 560(70) | 300(30) | 260(40) | 0.17 | 11.82(2) | () | Tilley et al. (1995) | ||
| 12.12(1) | 410(120) | 50(10) | 360(110) | 0.02 | 12.12(10) | *22(7) | Buchmann et al. (2007) | ||
| 12.21(8) | 1100(300) | 1000(250) | 100(50) | 0.37 | 12.04(2) | () | Tilley et al. (1995) | ||
| 12.339(4) | 39(4) | 26(2) | 13(2) | 0.06 | 12.327(9) | 45 | von Oertzen et al. (2010) | ||
| 12.317(10) | 80(10) | Goldberg et al. (2005) | |||||||
| 12.32 | Morgan et al. (1970a); Cunsolo et al. (1981); Smithson et al. (1988) | ||||||||
| 12.5(1) | 900(400) | 300(100) | 600(300) | 0.08 | 12.95(50) | 1- | *210(100) | Buchmann et al. (2007) | |
| 12.542(4) | 6(3) | 5(2) | 1(1) | <0.01 | 12.5 | Morgan et al. (1970a) | |||
| 12.576(9) | 70(20) | 50(10) | 20(10) | 0.38 | 12.557(7) | 24 | von Oertzen et al. (2010) | ||
| 12.527(10) | 32(5) | Goldberg et al. (2005) | |||||||
| 12.53 | 32(5) | Curtis et al. (2002); Cunsolo et al. (1981); Smithson et al. (1988); Ashwood et al. (2006); Morgan et al. (1970a) | |||||||
| 12.642(4) | 110(40) | 10(5) | 100(40) | <0.01 | |||||
| 12.71(2) | 300(30) | 120(10) | 180(30) | 0.05 | |||||
| 12.8(3) | 4800(400) | 4800(400) | - | 1.56 | |||||
| 12.90(3) | 310(30) | 285(30) | 25(5) | 0.09 | |||||
| 12.94(1) | 40(10) | 15(2) | 25(10) | 0.02 | 12.9 | (5-) | Cunsolo et al. (1983) | ||
| 12.98(4) | 1040(200) | 770(120) | 270(100) | 0.32 | |||||
| 13.08(1) | 180(20) | 120(10) | 60(15) | 0.17 | |||||
| 13.17(3) | 150(50) | 130(40) | 20(10) | 0.04 | |||||
| 13.33(2) | 300(130) | 30(15) | 270(120) | <0.01 | |||||
| 13.38(2) | 250(40) | 220(30) | 40(15) | 0.07 | |||||
| 13.46(2) | 540(80) | 210(10) | 330(70) | 0.12 | |||||
| 13.69(1) | 530(120) | 40(20) | 490(100) | 0.01 | |||||
| 13.82(1) | 25(6) | 3(1) | 22(5) | <0.01 | 13.82(2) | 28 | von Oertzen et al. (2010) | ||
| 13.89(1) | 24(10) | 14(6) | 10(4) | 0.01 | |||||
| 13.96(2) | 150(50) | 80(10) | 70(50) | 0.03 | |||||
| 14.0(2) | 2600(500) | 2100(300) | 500(200) | 0.70 | |||||
| 14.1(1) | 560(70) | 260(20) | 300(40) | 0.23 | |||||
| 14.12(7) | 160(60) | 100(30) | 60(30) | 0.03 | |||||
| 14.3(3) | 900(300) | 400(150) | 500(150) | 0.10 | 14.45(5) | 1070 | Tilley et al. (1995) | ||
| 14.5(2) | 450(220) | 230(100) | 220(130) | 0.05 | 14.7 | 800 | Tilley et al. (1995) | ||
| 14.52(1) | 250(30) | 80(10) | 170(20) | 0.03 | |||||
| 14.7(1) | 280(100) | 230(80) | 50(25) | 0.16 | |||||
| 14.77(5) | 680(50) | 680(50) | 2(1) | 0.28 | |||||
| 14.82(7) | 140(60) | 100(40) | 40(20) | 0.07 |
| *Partial width. |
III.9 Summary to section III.
Table 1 summarizes the data for 54 states in 18O in the 8.0 MeV - 14.9 MeV excitation energy region that were observed in the present work. This number (of states) is double the number of natural parity levels with known quantum characteristics (including tentative ones) given in compilation Tilley et al. (1995). The number of investigated levels in this work is large, but this is not so surprising because resonance studies with the TTIK method (see, for example, Norrby et al. (2011a, b)) as this techniques allows a broad range of excitation energies to be covered in a single run. However, this is the first time that data has been obtained in a broad angular interval and a complete R-matrix analysis performed for this large quantity of TTIK data. The reliability of the experimental information extracted from the data is demonstrated by a detailed comparison with the previously known results and by a fair simulation of the (,n) spectrum on the basis of the excitation functions for the elastic scattering. These data will be most useful in the development of theoretical tools that are capable of giving a microscopic description of clustering in non-self-conjugate nuclei. One example of such theoretical approaches is discussed in section V. In the following section (Sec. IV) we concentrate only on the states that have the highest degree of clustering, in an attempt to identify the members of -cluster, inversion doublet, quasi-rotational bands.
IV Rotational Bands in 18O
One of the most striking manifestations of -clustering in light nuclei is the appearance of a sequence of highly clustered states that form rotational bands of alternating parities. The positive parity -cluster rotational band is found at a lower energy than the corresponding negative parity band by several MeV. These bands are called inversion doublets and have been conclusively identified in 16O and 20Ne (see Fig. 1) Ames (1982); Billen (1979); John et al. (1969); Riedhauser (1984); Freer (2007); Horiuchi and Ikeda (1968); Suzuki (1976); Kanada-En’yo and Horiuchi (1995). There have been numerous attempts to find the members of the inversion doublet rotational bands in 18O that correspond to an 14C(g.s.)+ configuration, in analogy to the well known rotational bands in 16O and 20Ne, but their the assignment into band members remains controversial.
Predictions for -cluster rotational bands in 18O have been made in Descouvemont and Baye (1985); Furutachi et al. (2008).The Generator Coordinate Method (GCM) was used in Descouvemont and Baye (1985) to investigate clustering in 18O Descouvemont and Baye (1985). This is done by calculating the quadrupole moments, rms radii, and reduced widths of the resonances using the antisymmetric 14Cg.s.+ and 14C(2+,7.01 MeV)+ wave functions. Furutachi studied the -cluster structure of 18O using AMD+GCM (antisymmetrized molecular dynamics plus the generator coordinate method) Furutachi et al. (2008). The main difference between the two calculations was that in Furutachi et al. (2008) clusters emerged as a result of nucleon-nucleon and three-nucleon interaction while in Descouvemont and Baye (1985) cluster configurations were assumed a priori. Three positive parity rotational bands are predicted in Descouvemont and Baye (1985), but only one of them has a distinct +14C(g.s.) configuration, which this experiment is particularly sensitive to. Similar predictions were made in Furutachi et al. (2008).
Three members of the 14C(g.s.)+ rotational band are below the energy range studied in this experiment as two of them are bound. A 6+ state predicted at an excitation energy of 11.6 MeV with a dimensionless reduced -width of 0.15 Descouvemont and Baye (1985)is observed in this work, in good agreement with the value of 0.23 determined for the 6+ state at 11.7 MeV. However, the situation is complicated by the fact that there is another 6+ state at 12.58 MeV that has an even larger dimensionless reduced -width of 0.38. This almost equal splitting of -strength between the two 6+ states is not predicted in Descouvemont and Baye (1985); Furutachi et al. (2008). Another important discrepancy between the GCM calculations and the experimental data is the relatively large dimensionless reduced -width for the 4+ state at 10.29 MeV (9%) which is at least one order of magnitude larger than that assigned to this state in Descouvemont and Baye (1985). This state was suggested to belong to the 14C(2+)+ rotational band and its 14C(g.s.)+ dimensionless reduced -width is predicted to be below one percent. As in the case of the 6+ state, we see that the -strength is spread more evenly between several 4+ states, rather than concentrated in just one state.
Three negative parity rotational bands are suggested in Descouvemont and Baye (1985), but only one has a distinct 14C(g.s.)+ configuration. We propose that the and states predicted at 9.6 and 9.8 MeV excitation energies, respectively, are associated with the strongly -clustered states we observe at 9.16 and 9.39 MeV. This assignment of states is different from that proposed in Descouvemont and Baye (1985), but due to its large dimensionless reduced -width, the state at 9.16 MeV should be considered as the band head of the -cluster rotational band. However, just as in the positive parity band, the existence of a strongly -clustered state at 9.76 MeV makes the situation complicated. There is also another strong 3- state () at excitation energy of 8.28 MeV 1 MeV below the 3- state with the largest clustering at 9.36 MeV (=0.48). Again, there is a strong splitting of -strength between these two states.
The 5- state is predicted at 13 MeV as the most clustered state in the band with Descouvemont and Baye (1985) and would be the most dominant one in our spectrum. No such state was observed. Instead, there are several 5- states with substantial -strength spread out over a 3 MeV energy interval between 12 and 15 MeV. Their combined -strengths add up to 0.8. Again, this splitting of -strength is not predicted by the GCM. Obviously, while some general properties of the cluster states are reproduced in Descouvemont and Baye (1985), the model missed the physics that determines the splitting of the -strength. In the calculations done in Furutachi et al. (2008) for the negative parity rotational band there is a large difference in the excitation energies of the and states. It appears that there is a systematic shift in the location of the states. A splitting of -cluster strength is predicted in Furutachi et al. (2008) where it is related to proton excitation of the 14C core, but only one of the states for each spin-parity should have a dominant width. This is only partially correct. We do observe the splitting of the -cluster states, and an obviously dominant state does not exist for , rather, there are two equally strong -cluster states separated by only 600 keV. While some of the features predicted in Descouvemont and Baye (1985); Furutachi et al. (2008) agree with what is experimentally observed, the nearly equal splitting of strength among several states observed experimentally is not reproduced.
Assignments of the 14Cg.s.+ rotational bands have been suggested in the experimental works Morgan et al. (1970a); Cunsolo et al. (1981, 1982); von Oertzen et al. (2010). The states 0+(3.63 MeV), 2+(5.24 MeV), 4+(7.11 MeV) and 6+(11.69 MeV) have been considered as members of the positive parity rotational band, which resembles the 20Ne g.s. rotational band. In Morgan et al. (1970a) the 4+ state at 10.29 MeV was suggested as a member of this rotational band instead of the 4+ state at 7.11 MeV. An 8+ state at 17.6 MeV and 18.06 MeV was suggested by Cunsolo et al. (1982) and von Oertzen et al. (2010) respectively as the fifth member of this rotational band. Only the 6+ state at 11.7 MeV is within the energy range measured in this work and we confirm that this is a highly clustered state (), but the existence of the second strong 6+ state at 12.58 MeV () forces us to conclude that clustering in 18O is more complicated and cannot be described by a single pair of inversion doublet rotational bands. Our experimental results, and also hints from the Cluster-Nucleon Configuration Interaction Model Calculations discussed in the next section, point to the importance of the and configuration mixing for the positive parity -cluster states.
We now focus on the discussion of the locations of the band head and other members of the negative parity inversion doublet, -cluster, quasi-rotational band in 18O. This question has a rich history and has been discussed in many theoretical and experimental papers (see von Oertzen et al. (2010) and refs. therein). The 1- state at 8.035 MeV was proposed as the band head for this band in recent work of W. von Oertzen, at el. von Oertzen et al. (2010) and the same suggestion was made in Curtis et al. (2002). Our result excludes this state as a member of the 0- band due to its small dimensionless reduced -width (). In fact, none of the states identified in von Oertzen et al. (2010) as members of the negative parity inversion doublet (1- (8.04 MeV), 3- (9.7 MeV ), 5- (13.6 MeV), 7- (18.63 MeV)) can belong to this band except maybe a 7- state that lies beyond the energy region studied in this work. The 3- state at 9.7 MeV has of only 0.04, an order of magnitude less than the 3- at 9.3 MeV and the 5- state at 13.6 MeV is not observed at all in this work, which rules out the assignment made in von Oertzen et al. (2010).
It appears that the situation for the negative parity inversion doublet rotational band is similar to that for the positive parity inversion doublet. The -strength is split among several states and it is not possible to identify a single, dominant -cluster rotational band. Configuration mixing is probably at work here as well. We discuss this in more detail in the next section.
As a short summary of this section, we note that the previous calculations for the structure in 18O were only partially successful. No clear evidence for inversion doublet rotational bands in 18O was observed. Unlike in neighboring , even-even nuclei, 16O and 20Ne, the -cluster strength is split among several states of the same spin-parity.
V Cluster-Nucleon Configuration Interaction Model Calculations
In order to gain further understanding of the structure of many-body states in 18O and to examine the distribution of the -cluster strength in 18O we performed Cluster-Nucleon Configuration Interaction Model (CNCIM) calculations Volya and Tchuvil’sky , the approach can be summarized as follows.
First, the structure of the states of the 18O nucleus is treated in the unrestricted configuration space with the effective interaction Hamiltonian from Utsuno and Chiba (2011). The shell gap is slightly adjusted by keV. This small adjustment assures the best reproduction of nuclear spectra in this mass region. The matrix dimension for positive parity Jz=0 magnetic projection is 42269424. Other dimensions are of similar order. The same approach is applied to obtain the wave function (WF) of the ground state of daughter nucleus 14C. This WF is used to construct the 14C(g.s.)+ channel.
Second, the WF of the -particle is considered to be the lowest (0s)4 translationally-invariant four-nucleon oscillator function. Taking into account that the WF of the relative 14C+ motion is related to a simple SU(3) representation (,0) one only needs to project the overlap of the WFs of mother and daughter nuclei onto the scalar superposition of four-nucleon configurations possessing a required symmetry. This procedure is carried out by diagonalization of the proper Casimir operators. Thus the large scale shell model WFs were used to obtain four-nucleon structures and to calculate corresponding fractional parentage coefficients. The next step is the projection of the four-nucleon WF resulting from the discussed procedure onto the -particle WF and the WF of its relative motion. It is performed by use of the so-called cluster coefficients, defined and expressed in Smirnov and Yu.M. Tchuvilsky (1977). Naturally the requirement of translational invariance is rigorously met for the WFs of the -cluster channels. The relevant SU(3)-classified four-nucleon configurations include: ; ; ; and Here the nucleon configurations are listed together with the corresponding quantum numbers of the SU(3) symmetry. The permutational symmetry is fixed as .
Third, the channels were orthogonalized and normalized by direct diagonalization of the norm-kernel in harmonic oscillator basis.
Formal details of the CNCIM can be found in Ref. Volya and Tchuvil’sky . The results of the calculations related to the energy range under study are summarized in Table 2. Subsequent discussion is arranged in the following way. Positive parity states are discussed first going from the lowest spin to the highest. Then the negative parity states are discussed in the same order. The two very broad resonances that have extremely large dimensionless reduced -widths are discussed in section VI.
V.0.1 0+ states
The only 0+ level which was observed experimentally in this work is a very broad (=3200 keV) state at 9.9 MeV. There are reasons to assume that the dominant nucleon configuration of this and the broad 2+ state at 12.9 MeV is . These states are not predicted by the CNCIM calculations restricted to the p-sd configuration space. The nature of these states and their properties are analyzed in section VI.
The CNCIM predicts most -strength to be concentrated in two states: the ground state, and a state predicted at 4.64 MeV. This splitting of -strength is due to the strong mixture of and configurations. In the excitation energy region between 8 and 13 MeV, six 0+ states restricted to p-sd-shell configuration are predicted. All of them have small to moderate (0.02 0.14) -strength. Taking into account that the cross section is proportional to (2J+1) and the fact that the angular distribution is isotropic, the weak 0+ states are easy to miss experimentally. Only three 0+ states were known experimentally before this work. All are bound. We believe that the highly clustered 0+ state, predicted by the CNCIM calculations corresponds to the 3.634 MeV state, that is known to be strongly populated in the (7Li,t) reaction Morgan et al. (1970b), unlike the 5.336 MeV state.
V.0.2 2+ states
Twelve 2+ states were observed in the present experiment. If one neglects the broad state at 12.9 MeV the sum of the -strength is equal to 0.80.
The two strongest -cluster 2+ states are predicted at 2.25 and 5.89 MeV (SFα=0.22,0.47). This prediction does not contradict the assignment of the third 2+ state at 5.26 MeV to the positive parity -cluster inversion doublet rotational band (see previous section). However, appreciable -clustering predicted for the first 2+ state in 18O again indicates strong spread of the cluster strength in 18O due to configuration mixing. No other strong 2+ -cluster states below 10.5 MeV are predicted, and none are observed experimentally. Generally, the CNCIM predictions of the global properties of the -widths are reasonable, although in some cases it is hard to establish a direct correspondence between the experimental and the theoretical results. The CNCIM predicts a higher density of 2+ states than we observe experimentally which may be expected, because most of the predicted 2+s states have very small SFα with decay dominated by neutron emission.
V.0.3 4+ states
Seven 4+ states were observed in this experiment. The state at 8.96 MeV may also have 4+ spin-parity assignment. The sum of the -strength is 0.80.
The first three 4+ states were predicted to have significant -cluster components according to the CNCIM calculations. The second 4+ state, predicted at 7.92 MeV and observed in previous experiments at 7.117 MeV, is considered to be a member of the -cluster positive parity rotational band mentioned in the previous section. However, it is not the strongest cluster 4+ state. The third 4+ state (predicted at 8.14 MeV) has the largest Sα=0.26. The only possible candidate that may correspond to this state is the one at 8.96 MeV. We could not fix the spin-parity of this state, but 4+ assignment is possible. If we assume 4+ for this state then indeed its is large (). Moreover, in spite of its cluster nature the width of this state is dominated by neutron decay due to the large experimental value of the dimensionless reduced neutron width for decay, 0.3. This is in-line with the CNCIM which predicts this state to neutron decay to 17O g.s. with and SFn=0.6.
As seen in Table 2 the only strong -cluster 4+ state other than 8.96 MeV below 12 MeV is predicted at 10.02 MeV. This corresponds to the well known 10.29 MeV state, which has appreciable experimental of 0.09(1). In addition, four 4+ states which have moderate -widths and two 4+ states with small -widths are predicted. A good correspondence of the parameters is found for the state at 11.43 MeV. While this is not a strong cluster state with =0.05, it corresponds to a prominent feature in the 14C(,) excitation function because its total width is dominated by the partial -width, with neutron decay being negligible, and because of favorable -penetrability factors at this excitation energy.
It may not be surprising that the predicted 4+ states at 9.47, 9.7, 10.5, 11.1 MeV and 12.01 MeV are not observed experimentally as these are not cluster states and have small neutron SF’s. These states are probably too narrow to be observed in this experiment.
It appears that not only global properties of the spectra of 4+ states but the characteristics of the individual levels are reproduced in the CNCIM calculations reasonably well.
V.0.4 6+ states
Two 6+ states were observed in this experiment. Both of them have large values of the dimensionless reduced widths, which is expected because the high potential barrier makes the -decay widths small and therefore only the levels with substantial reduced -width tend to be visible in the +14C elastic scattering excitation function.
The lowest 6+ state is predicted at 11.11 MeV, with an SFα of 0.2. This is close to the experimental 6+ state at 11.7 MeV with =0.23(2). More important is the prediction of the -strength splitting. Another cluster 6+ state is predicted at 13.03 MeV with SFα=0.28. We observe the strong 6+ state at 12.58 MeV with =0.38. Theoretical results indicate that the large value of SFα for these states are due to the significant component. It appears that the exact splitting is also a consequence of orthogonality with the channel. Eight 6+ states are predicted by CNCIM below 15 MeV, but only two of them have large SFα’s. Others are located in the same energy region but possess SFα’s that are at least four times smaller. Consequently, it is most likely that the other 6+ states are too weak to be observed in this experiment, so the results of the CNCIM shell model calculations for the 6+ spin-parity are in reasonable agreement with the experimental data.
V.0.5 1- and 3- states
As can be seen in the Table 1 a large number of 1- and 3- levels with various widths are observed in the experiment. The strongest 1- -cluster states are located at 9.19, 9.76 and 10.8 MeV. The sum rule of the 1- -strength is equal to 1.26. The strongest 3- -cluster states are observed at 8.29, 9.35, 11.95, 12.98 and 14.0 MeV. The sum of the 3- -strength is equal to 1.92.
Predictions of the CNCIM with respect to the strong states are difficult to match with the experimental data. Indeed, the only relatively strong -cluster 1- state predicted by the CNCIM is the state at 7.3 MeV, which probably corresponds to the experimental 6.2 MeV state. The first 3- at 4.95 MeV is predicted to be the strongest -cluster state (SFα=0.5) and the second 3- predicted at 6.16 MeV has the second largest SF (0.12). All of the remaining 1- and 3- states have small SFα’s with a sum rule -strength an order of magnitude smaller than the experimentally observed values. It is obvious that the pattern of the calculated spectra is very different from the experimental observations. One can conclude that major features in the 1- and 3- -cluster spectrum are not reproduced by the CNCIM in the measured energy range. Possible basic causes for this difference are discussed below.
V.0.6 5- states
Eight 5- states were observed in the present experiment with the cluster states located at 11.63, 13.08, 14.1 and 14.7 MeV. There are four levels which have moderate dimensionless reduced -widths. The sum of the -strength is 0.80.
The lowest cluster 5- state (SFα=0.29) appears at 8.54 MeV in the CNCIM. Though it is within the energy range of this experiment, it was not observed because a 5- state at this energy is too narrow due to its low penetrability factor. There is a known 5- state at 8.125 MeV, but the partial -width for this state is not known. It would be very interesting to see if this state indeed corresponds to a cluster configuration, which would be surprising, since we normally do not expect to find cluster states below the corresponding state in the inversion doublet band. Another cluster 5- state with SFα=0.18 is predicted at 11.33 MeV. This clearly corresponds to the known 11.62 MeV resonance with the =0.13 determined in this work. A detailed comparison shown in Table 2 reveals that the prediction of the CNCIM in the energy region below 13 MeV is reasonable. In principle, all of the SM 5- states could be identified with the experimental states, except for the state at 11.534 MeV. However, the SFα predicted for all 5- states, other than those at 8.54 and 11.33 MeV, are small (0.03), but this is not what was found experimentally. The experimental dimensionless reduced -widths for the 5- states at 13.08 and 14.07 MeV are much larger than the predicted values. The sum rule of the SFs also confirms this discrepancy. Indeed, if one neglects the state at 8.54 MeV the sum is equal to 0.3, which is far below the experimental value. The basic causes of the discrepancies are probably the same as for the 1- and 3- states.
| Energy | Exp. energy | Exp. energy | SF from SM | from | |
|---|---|---|---|---|---|
| from SM | from TUNL | from this work | this work | ||
| (MeV) | (MeV) | (MeV) | |||
| 0+ | 0 | 0 | 0.64 | ||
| 4.212 | 5.336 | 0.13 | |||
| 4.642 | 3.634 | 0.55 | |||
| 6.609 | 0.12 | ||||
| 9.382 | 0.14 | ||||
| 10.274 | 0.05 | ||||
| 10.830 | 0.06 | ||||
| 11.416 | <0.01 | ||||
| 12.433 | 0.04 | ||||
| 12.940 | 0.02 | ||||
| 1- | 4.975 | 4.456 | 0.09 | ||
| 7.312 | 6.198 | 0.22 | |||
| 7.564 | 7.616 | 0.07 | |||
| 7.790 | 8.038 | 8.04 | 0.03 | 0.02 | |
| 9.561 | 0.01 | ||||
| 10.454 | <0.01 | ||||
| 10.662 | <0.01 | ||||
| 10.782 | 0.01 | ||||
| 11.250 | 0.01 | ||||
| 11.488 | <0.01 | ||||
| 2+ | 2.246 | 1.982 | 0.22 | ||
| 4.161 | 3.920 | 0.11 | |||
| 5.893 | 5.255 | 0.47 | |||
| 7.601 | 8.213 | 8.22 | 0.11 | 0.03 | |
| 8.569 | 8.82 | 0.01 | 0.01 | ||
| 8.633 | 0.05 | ||||
| 8.931 | 0.07 | ||||
| 9.397 | 9.361 | <0.01 | |||
| 9.687 | <0.01 | ||||
| 10.424 | <0.01 | ||||
| 3- | 4.950 | 5.098 | 0.49 | ||
| 6.160 | 6.404 | 0.12 | |||
| 8.394 | 8.282 | 8.290 | <0.01 | 0.18 | |
| 9.057 | <0.01 | ||||
| 9.306 | 9.35 | <0.01 | 0.48 | ||
| 9.644 | 9.67 | 9.70 | 0.01 | 0.04 | |
| 9.990 | 10.11 | 10.11 | 0.01 | 0.01 | |
| 10.655 | 10.40 | 10.40 | 0.02 | 0.03 | |
| 10.789 | 0.04 | ||||
| 11.192 | 0.05 | ||||
| 4+ | 3.597 | 3.555 | 0.12 | ||
| 7.921 | 7.117 | 0.16 | |||
| 8.141 | 8.955 | 8.96 | 0.26 | () | |
| 9.468 | 0.04 | ||||
| 9.706 | 0.04 | ||||
| 10.020 | 10.295 | 10.29 | 0.20 | 0.09 | |
| 10.510 | 0.05 | ||||
| 11.106 | <0.01 |
| Energy | Exp. energy | Exp. energy | SF from SM | from | |
|---|---|---|---|---|---|
| from SM | from TUNL | from this work | this work | ||
| (MeV) | (MeV) | (MeV) | |||
| 11.396 | 11.41 | 11.43 | 0.06 | 0.05 | |
| 12.011 | <0.01 | ||||
| 5- | 6.958 | 7.864 | 0.02 | ||
| 8.546 | 8.125 | 0.29 | |||
| 9.432 | 9.713 | 0.02 | |||
| 11.332 | 11.62 | 11.62 | 0.18 | 0.13 | |
| 11.534 | 0.02 | ||||
| 12.229 | 12.33 | 12.34 | 0.02 | 0.06 | |
| 12.801 | 12.94 | 0.02 | 0.02 | ||
| 13.316 | 13.08 | 0.03 | 0.18 | ||
| 13.665 | 13.82 | <0.01 | <0.01 | ||
| 14.080 | 14.07 | <0.01 | 0.23 | ||
| 6+ | 11.112 | 11.690 | 11.70 | 0.20 | 0.23 |
| 11.991 | 0.07 | ||||
| 13.035 | 12.530 | 12.58 | 0.28 | 0.38 | |
| 13.445 | 0.06 | ||||
| 13.806 | <0.01 | ||||
| 14.263 | 0.01 | ||||
| 14.455 | 0.03 | ||||
| 14.784 | <0.01 |
V.0.7 Overview of CNCIM
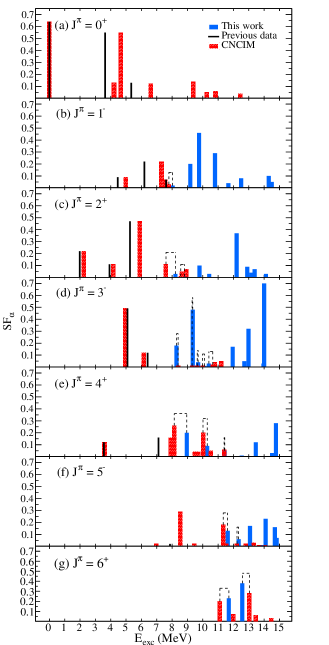
The distribution of the -strength is shown in Fig. 12 for each spin-parity. The solid blue bars correspond to the experimental data from this work and the hatched red bars are CNCIM calculation. The bar length reflects the dimensionless reduced -width for the experimental states or the SFα for the calculated state. The black lines are known bound states and their length is set to be that of the associated CNCIM calculated state. We use connecting lines to indicate the suggested link between the states observed in this work and those predicted by CNCIM calculations. States with SFα below 2% are not shown in Fig. 12 except for cases for which association between CNCIM and experimental states are suggested in 2.
Overall, we can conclude that the CNCIM as it stands now provides an adequate description of -clustering for many low-lying states. Unfortunately, many of these states, especially those with low spin are below the -decay threshold, hence not accessible in this experiment. In the limits where comparison is possible, the results appear to be encouraging. The total number of the calculated and observed positive parity states with large and moderate -strengths are in reasonable agreement as well as some details of the positive parity spectrum. It shows that the recent advances in configuration interaction techniques, which includes expanded computational capabilities, better theoretical understanding of phenomenological interactions, and a closer link to fundamental ab-initio and no-core approaches, make some treatment of clustering feasible.
The experimental results, however, also point to noticeable discrepancies, especially for the negative parity states. Truncation of the configuration space is the most likely reason for that. The p-sd model space turns out to be more or less adequate for the description of an essential part of positive parity states in the energy domain under study. It is not the case for the negative parity states. It is possible that the majority of the negative parity states above 8 MeV of excitation energy contain a significant component of particle excitations related to the sd pf nucleon transfer which is not contained in the basis that was used for the calculations. Future model with extended valence space Hamiltonian should be able to overcome this limitation. Nevertheless, numerous improvements in the existing approach, including basis expansion, are possible (see discussion in Ref. Volya and Tchuvil’sky ).
A similar interpretation appears to be natural for the extremely broad positive parity states. The dominate component of these states is most likely the configuration which is not present in the employed basis. The structure of these states, discussed in detail in the next section, may also be influenced by their strong continuum coupling through a so-called superradiance mechanism Auerbach and Zelevinsky (2011). It is known that the structure of states that are strongly coupled to decay channels gets modified so that almost all the decay strength is concentrated in a broad super-radiant state, while other states become narrow Volya and Zelevinsky (2003); Volya (2009). Due to the centrifugal barrier the effect is most noticeable for channels with low angular momentum partial waves.
VI Broad and States
The R-matrix fit discussed in Sec. III shows that it is necessary to include two very broad, purely -cluster low spin states, namely the 0+ state at 9.9 MeV and the 2+ state at 12.9 MeV. Due to the large widths of these 0+ and 2+ states, they are not seen as narrow peaks, instead they influence the excitation function over a broad energy range. These levels were not predicted by any of the models considered in previous sections.
Broad 0+ and 2+ states with very large partial -widths are known in 20Ne at excitation energies of 8.7 MeV and 8.9 MeV Tilley et al. (1995). Observation of the broad 0+ and 2+ states in 18O at 9.9 MeV and 12.9 MeV provides evidence that these purely cluster states are common features in light nuclei. Similar structures were observed recently in 12C Fynbo et al. (2005) and suggested in 10B(T=1) Kuchera et al. (2011). It is worthwhile to note that reliable identification of broad 0+ states is difficult, because the cross sections are small (due to the 2J+1 factor) and does not vary with angle. It is easy to attribute the contribution of the level to background. A considerable effort has been spent to find a direct signature for the presence of this broad level. In 18O Johnson et al. (2009), it was found that the interference of this resonance with the Rutherford amplitude near 90∘ in c.m. (where only positive parity levels contribute) presented an unambiguous identification. If the excitation energy of the 0+ state would have been several MeV higher, then the Rutherford amplitude would be smaller and identification would become even more difficult.
Here we investigate further the nature of these states. The reduced -widths of these states are so large that we apply a simple -cluster potential model that is known to work well for neighboring 16O and 20Ne Goldberg et al. (1974); Buck et al. (1975). In this model the -particle can be seen as a cluster orbiting a closed core with quantum numbers N (number of nodes) and L (orbital angular momentum). Following the Talmi-Moshinksy relations these quantum numbers are found in terms of the corresponding quantum numbers of individual nucleons and that make up the -cluster
| (1) |
The prevailing 4-nucleon structures of the CNCIM with the corresponding SU(3) label provide a guidance to the selection of these parameters.
To construct an effective interaction between the core and the cluster one could double fold the cluster and core mass densities, or use a parametrized potential shape. It is important to recognize that the Pauli exclusion principle does not generally allow for the cluster scattering to be represented as potential scattering. The corresponding Schrödinger equation must be generalized to include a norm operator. For our purposes, where the width is so large that the is nearly completely excluded from the internal region the exclusion can be modeled by limiting the configuration space to a correct minimum number of nodes () or by introducing a repulsive core which effectively blocks the excluded spatial region. The results were very similar for the potential with a core and without one. The details on the potential parameters are given in Avila (2013).
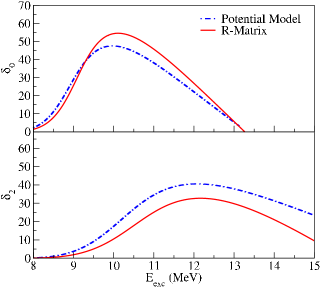
Fig. 13 presents a comparison of and phase shifts for the broad 0+ and 2+ resonances calculated in the potential model approach and from the R-matrix fit. The potential model phase shift, representing the extreme -cluster model agrees very well with the experimental one from the R-matrix fit and can be considered as one more piece of evidence for the pure -cluster structure of the 0+ and 2+ states in question. The pure structure of these states leads to expected observation of other features of the cluster bands, like higher spin members of the positive parity band and the observation of a negative parity band (considerations of this kind led H.T. Fortune to suggest the existence of the broad 2+ state Fortune (2012), after he obtained knowledge on the properties of the broad 0+ resonance at 9.9 MeV from Johnson et al. (2009)). Evidently, more experimental effort is needed to verify or reject these speculations. It seems that the even more interesting question is the origin of these new and extreme -cluster states.
Why does the -cluster structure split at low excitation energies in 18O, but appears to be pushed into one very highly clustered state in the region of a higher density of states? It could be related to the super-radiance phenomenon, described in Auerbach and Zelevinsky (2011); Volya and Zelevinsky (2003); Volya (2009), or it can be because these states are so broad and their lifetime is so short that they decay before mixing with the nearby states can occur. Indeed, we are discussing properties of broad 0+ states close to the -particle threshold. Realizing that the presence of the states in question could be a common feature in light nuclei, it is worthwhile to note that there has been no observations of broad cluster levels in nuclei with an odd number of nucleons.
VII Conclusions
Excitation functions for 14C+ elastic scattering in the excitation energy range between 8 and 14.9 MeV were measured using the Thick Target Inverse Kinematics technique over a wide angular range. The results of a detailed R-matrix analysis that also included available data for the 14C(,n) reaction yielded spin-parity assignments, excitation energies and partial widths for 54 excited states in 18O. The 14C(,) elastic scattering is particularly sensitive to the states that have a 14C(g.s.)+ configuration, and the completeness of the experimental data complemented by the detailed R-matrix analysis allowed for an accurate determination of -clustering in 18O.
The search for -cluster inversion doublet rotational bands in 18O has been the subject of many experimental and theoretical studies (see for example Descouvemont and Baye (1985); Curtis et al. (2002); Furutachi et al. (2008); von Oertzen et al. (2010) and references therein), but the corresponding assignments remain controversial. We conclude that unlike for the , 16O and 20Ne nuclei, the -strength is split about evenly between two or more states for each spin-parity and it is not possible to define inversion doublet rotational bands in the same sense as for 16O and 20Ne. The Cluster-Nucleon Configuration Interaction Model (CNCIM) calculations presented in section V indicate that splitting of the -strength for the positive parity band is a result of and configuration mixing. For the negative parity states and the very broad positive parity states the (1p0f) shell (not included in the CNCIM) probably plays an important role. Comparison of the results of this experiment to the predictions of the GCM cluster model Descouvemont and Baye (1985) and the AMD+RGM Furutachi et al. (2008) model show significant discrepancies as they underestimate the splitting and predict that only one state has dominant 14C(g.s.)+ configuration, which is not the case experimentally. These findings highlight the need for sophisticated microscopic analyses if we are to understand nuclei.
Assignment of the -cluster rotational bands without any knowledge of the partial -widths is dangerous. The most striking example is the assignment of the inversion doublet rotational band in von Oertzen et al. (2010). The present work shows that all states in the 0- rotational band suggested in von Oertzen et al. (2010) have -strengths that are at least a factor of 10 smaller than the -strength of the strongest cluster state with the corresponding spin-parity (except, maybe the for 7- state that has an excitation energy too high to be populated in this study), which obviously excludes them from being members of the 0- inversion doublet rotational band.
Broad, purely -cluster and 2+ states at 9.9 MeV and 12.9 MeV were observed in 18O. While these states were not predicted by any microscopic calculations, their origin is probably similar to the well known 0+ and 2+ broad states in 20Ne at 8.7 and 8.9 MeV. The presence of broad, very clustered states could be a common feature in light nuclei.
Detailed spectroscopic information, including spin-parities, partial - and neutron- decay widths and dimensionless reduced widths, was obtained for excited states in 18O between 8.0 to 14.9 MeV in excitation energy. Experimental results are compared with existing theoretical models. While some features of the 18O spectrum are reproduced by the models, it appears that the complete theoretical description of clustering phenomena in non-self-conjugate nuclei is still out of rich.
Acknowledgements.
The authors would like to acknowledge the financial support provided by the National Science Foundation under grant No. PHY-456463, the U.S. Department of Energy under contracts No. DE-SC0009883 and No. DE-FG03-93ER40773.References
- Horiuchi and Ikeda (1968) H. Horiuchi and K. Ikeda, Progress of Theoretical Physics 40, 277 (1968), URL http://ptp.oxfordjournals.org/content/40/2/277.abstract.
- Ames (1982) L. L. Ames, Phys. Rev. C 25, 729 (1982), URL http://link.aps.org/doi/10.1103/PhysRevC.25.729.
- Billen (1979) J. H. Billen, Phys. Rev. C 20, 1648 (1979), URL http://link.aps.org/doi/10.1103/PhysRevC.20.1648.
- John et al. (1969) J. John, J. P. Aldridge, and R. H. Davis, Phys. Rev. 181, 1455 (1969), URL http://link.aps.org/doi/10.1103/PhysRev.181.1455.
- Riedhauser (1984) S. R. Riedhauser, Phys. Rev. C 29, 1961 (1984), URL http://link.aps.org/doi/10.1103/PhysRevC.29.1961.
- Freer (2007) M. Freer, Rep. Prog. Phys. 70, 2149 (2007), URL http://stacks.iop.org/0034-4885/70/i=12/a=R03.
- Suzuki (1976) Y. Suzuki, Progress of Theoretical Physics 55, 1751 (1976), URL http://ptp.oxfordjournals.org/content/55/6/1751.abstract.
- Kanada-En’yo and Horiuchi (1995) Y. Kanada-En’yo and H. Horiuchi, Progress of Theoretical Physics 93, 115 (1995), URL "http://ptp.oxfordjournals.org/content/93/1/115.abstract".
- Kanada-En’yo and Horiuchi (2001) Y. Kanada-En’yo and H. Horiuchi, Progress of Theoretical Physics Supplement 142, 205 (2001), URL http://ptps.oxfordjournals.org/content/142/205.abstract.
- Neff and Feldmeier (2008) T. Neff and H. Feldmeier, International Journal of Modern Physics E 17, 2005 (2008), URL http://www.worldscientific.com/doi/abs/10.1142/S0218301308010994.
- Wiringa et al. (2000) R. B. Wiringa, S. C. Pieper, J. Carlson, and V. R. Pandharipande, Phys. Rev. C 62, 014001 (2000), URL http://link.aps.org/doi/10.1103/PhysRevC.62.014001.
- Elliott (1958) J. P. Elliott, Proc. Roy. Soc. A 245, 128 (1958).
- Gnilozub et al. (2006) I. A. Gnilozub, S. D. Kurgalin, and Y. M. Tchuvil’sky, Phys. At. Nucl. 69, 1014 (2006).
- Gnilozub et al. (2007) I. A. Gnilozub, S. D. Kurgalin, and Y. M. Tchuvil’sky, Nucl. Phys. A 790, 687C (2007).
- Gnilozub et al. (2008) I. A. Gnilozub, S. D. Kurgalin, and Y. M. Tchuvil’sky, Phys. At. Nucl. 71, 1213 (2008).
- Wolsky et al. (2010) R. Wolsky, I. A. Gnilozub, S. D. Kurgalin, and Y. M. Tchuvil’sky, Phys. At. Nucl. 73, 1405 (2010).
- Gnilozub et al. (2013) I. A. Gnilozub, S. D. Kurgalin, and Y. M. Tchuvil’sky, J. Phys.: Conf. Ser. 436, 012034 (2013).
- Maris et al. (2009) P. Maris, J. P. Vary, and A. M. Shirokov, Phys. Rev. C 79, 014308 (2009).
- (19) A. Volya and Y. Tchuvil’sky, IASEN2013 Conference Proceedings, World Scientific (2014).
- Zhao et al. (1989) Z. Zhao, M. Gai, B. J. Lund, S. L. Rugari, D. Mikolas, B. A. Brown, J. A. Nolen, and M. Samuel, Phys. Rev. C 39, 1985 (1989), URL http://link.aps.org/doi/10.1103/PhysRevC.39.1985.
- Buchmann et al. (2007) L. Buchmann, J. D’Auria, M. Dombsky, U. Giesen, K. P. Jackson, P. McNeely, J. Powell, and A. Volya, Phys. Rev. C 75, 012804 (2007), URL http://link.aps.org/doi/10.1103/PhysRevC.75.012804.
- Fortune and Kurath (1978) H. T. Fortune and D. Kurath, Phys. Rev. C 18, 236 (1978), URL http://link.aps.org/doi/10.1103/PhysRevC.18.236.
- von Oertzen et al. (2010) W. von Oertzen, T. Dorsch, H. G. Bohlen, R. Krücken, T. Faestermann, R. Hertenberger, Tz. Kokalova, M. Mahgoub, M. Milin, C. Wheldon, et al., Eur. Phys. J 43, 17 (2010), ISSN 1434-6001, URL http://dx.doi.org/10.1140/epja/i2009-10894-2.
- Cunsolo et al. (1981) A. Cunsolo, A. Foti, G. Immè, G. Pappalardo, G. Raciti, and N. Saunier, Phys. Rev. C 24, 476 (1981), URL http://link.aps.org/doi/10.1103/PhysRevC.24.476.
- Cunsolo et al. (1982) A. Cunsolo, A. Foti, G. Immè, G. Pappalardo, and G. Raciti, Physics Letters B 112, 121 (1982), ISSN 0370-2693, URL http://www.sciencedirect.com/science/article/pii/0370269382903100.
- Cunsolo et al. (1983) A. Cunsolo, A. Foti, G. Immè, G. Pappalardo, and G. Raciti, Lett. Nuo. Cim. 37, 193 (1983).
- Smithson et al. (1986) M. J. Smithson, D. L. Watson, and H. T. Fortune, Phys. Rev. C 33, 509 (1986), URL http://link.aps.org/doi/10.1103/PhysRevC.33.509.
- Smithson et al. (1988) M. J. Smithson, D. L. Watson, and H. T. Fortune, Phys. Rev. C 37, 1036 (1988), URL http://link.aps.org/doi/10.1103/PhysRevC.37.1036.
- Sanders (1956) R. M. Sanders, Phys. Rev. 104, 1434 (1956), URL http://link.aps.org/doi/10.1103/PhysRev.104.1434.
- Bair et al. (1966) J. K. Bair, J. L. C. Ford, and C. M. Jones, Phys. Rev. 144, 799 (1966), URL http://link.aps.org/doi/10.1103/PhysRev.144.799.
- Wagemans et al. (2002) J. Wagemans, C. Wagemans, G. Goeminne, O. Serot, M. Loiselet, and M. Gaelens, Phys. Rev. C 65, 034614 (2002), URL http://link.aps.org/doi/10.1103/PhysRevC.65.034614.
- Cobern et al. (1981) M. E. Cobern, L. C. Bland, H. T. Fortune, G. E. Moore, S. Mordechai, and R. Middleton, Phys. Rev. C 23, 2387 (1981), URL http://link.aps.org/doi/10.1103/PhysRevC.23.2387.
- Yildiz et al. (2006) S. Yildiz, M. Freer, N. Soić, S. Ahmed, N. I. Ashwood, N. M. Clarke, N. Curtis, B. R. Fulton, C. J. Metelko, B. Novatski, et al., Phys. Rev. C 73, 034601 (2006), URL http://link.aps.org/doi/10.1103/PhysRevC.73.034601.
- Curtis et al. (2002) N. Curtis, D. D. Caussyn, C. Chandler, M. W. Cooper, N. R. Fletcher, R. W. Laird, and J. Pavan, Phys. Rev. C 66, 024315 (2002), URL http://link.aps.org/doi/10.1103/PhysRevC.66.024315.
- Jahn et al. (1978) R. Jahn, D. P. Stahel, G. J. Wozniak, R. J. de Meijer, and J. Cerny, Phys. Rev. C 18, 9 (1978), URL http://link.aps.org/doi/10.1103/PhysRevC.18.9.
- Woodworth et al. (1979) J. G. Woodworth, K. G. McNeill, J. W. Jury, R. A. Alvarez, B. L. Berman, D. D. Faul, and P. Meyer, Phys. Rev. C 19, 1667 (1979), URL http://link.aps.org/doi/10.1103/PhysRevC.19.1667.
- Morgan et al. (1970a) G. L. Morgan, D. R. Tilley, G. E. Mitchell, R. A. Hilko, and N. R. Roberson, Nuc. Phys. A 148, 480 (1970a), ISSN 0375-9474, URL http://www.sciencedirect.com/science/article/pii/037594747090641X.
- Weinman and Silverstein (1958) J. A. Weinman and E. A. Silverstein, Phys. Rev. 111, 277 (1958), URL http://link.aps.org/doi/10.1103/PhysRev.111.277.
- Goldberg et al. (2005) V. Z. Goldberg, K.-M. Källman, T. Lönnroth, P. Manngård, and B. B. Skorodumov, Physics of Atomic Nuclei 68, 1079 (2005), ISSN 1063-7788, URL http://dx.doi.org/10.1134/1.1992561.
- Johnson et al. (2009) E. D. Johnson, G. V. Rogachev, V. Z. Goldberg, S. Brown, D. Robson, A. M. Crisp, P. D. Cottle, C. Fu, J. Giles, B. W. Green, et al., The European Physical Journal A 42, 135 (2009), ISSN 1434-6001, URL http://dx.doi.org/10.1140/epja/i2009-10887-1.
- Artemov et al. (1990) K. P. Artemov, O. P. Belyanin, A. L. Vetoshkin, R. Wolski, M. S. Golovkov, V. Z. Goldberg, M. Madeja, V. V. Pankratov, I. N. Serikov, V. A. Timofeev, et al., Sov. J. Nucl. Phys. 52, 634 (1990).
- Goldberg and Pakhomov (1993) V. Z. Goldberg and A. E. Pakhomov, Phys. Atomic Nuclei 56, 1167 (1993).
- Markenroth et al. (2000) K. Markenroth, L. Axelsson, S. Baxter, M. Borge, C. Donzaud, S. Fayans, H. Fynbo, V. Goldberg, S. Grevy, D. Guillemaud-Mueller, et al., Phys. Rev. C 62, 034308 (2000).
- Lönnroth et al. (2010) T. Lönnroth, M. Norrby, V. Z. Goldberg, G. V. Rogachev, M. S. Golovkov, K.-M. Källman, M. Lattuada, S. V. Perov, S. Romano, B. B. Skorodumov, et al., The European Physical Journal A 46, 5 (2010), ISSN 1434-6001, URL http://dx.doi.org/10.1140/epja/i2010-11021-2.
- Rogachev et al. (2010) G. V. Rogachev, E. D. Johnson, J. Mitchell, V. Z. Goldberg, K. W. Kemper, and I. Wiedenhöver, AIP Conf. Proc. 1213, 137 (2010), URL http://dx.doi.org/10.1063/1.3362563.
- Lane and Thomas (1958) A. M. Lane and R. G. Thomas, Rev. Mod. Phys. 30, 257 (1958), URL http://link.aps.org/doi/10.1103/RevModPhys.30.257.
- Johnson (2008) E. D. Johnson, Ph.D. thesis, Florida State University (2008), URL http://diginole.lib.fsu.edu/etd/3494/.
- Avila (2013) M. L. Avila, Ph.D. thesis, Florida State University (2013), URL http://diginole.lib.fsu.edu/etd/8525.
- Tilley et al. (1995) D. R. Tilley, H. R. Weller, C. M. Cheves, and R. M. Chasteler, Nucl. Phys. A 595, 1 (1995), ISSN 0375-9474, URL http://www.sciencedirect.com/science/article/pii/0375947495003381.
- Ashwood et al. (2006) N. I. Ashwood, M. Freer, S. Sakuta, N. M. Ahmed, N. Curtis, P. MCEwan, C. J. Metelko, B. Novatoski, N. Soic, D. Stepanov, et al., J. Phys. G : Nuc. Part. Phys. 32, 463 (2006), URL http://stacks.iop.org/0954-3899/32/i=4/a=005.
- Sellers et al. (1995) R. M. Sellers, D. M. Manley, M. M. Niboh, D. S. Weerasundara, R. A. Lindgren, B. L. Clausen, M. Farkhondeh, B. E. Norum, and B. L. Berman, Phys. Rev. C 51, 1926 (1995), URL http://link.aps.org/doi/10.1103/PhysRevC.51.1926.
- Fortune et al. (1985) H. T. Fortune, L. C. Bland, and W. D. M. Rae, Journal of Physics G: Nuclear Physics 11, 1175 (1985), URL http://stacks.iop.org/0305-4616/11/i=10/a=013.
- Manley et al. (1990) D. M. Manley, D. J. Millener, B. L. Berman, W. Bertozzi, T. N. Buti, J. M. Finn, F. W. Hersman, C. E. Hyde-Wright, M. V. Hynes, J. J. Kelly, et al., Phys. Rev. C 41, 448 (1990), URL http://link.aps.org/doi/10.1103/PhysRevC.41.448.
- Rae and Bhowmik (1984) W. Rae and R. Bhowmik, Nuc. Phys. A 427, 142 (1984), ISSN 0375-9474, URL http://www.sciencedirect.com/science/article/pii/0375947484901428.
- Norrby et al. (2011a) M. Norrby, T. Lonnroth, V. Z. Goldberg, G. V. Rogachev, et al., Eur. Phys. J A 47, 73 (2011a).
- Norrby et al. (2011b) M. Norrby, T. Lonnroth, V. Z. Goldberg, G. V. Rogachev, et al., Eur. Phys. J A 47, 96 (2011b).
- Descouvemont and Baye (1985) P. Descouvemont and D. Baye, Phys. Rev. C 31, 2274 (1985), URL http://link.aps.org/doi/10.1103/PhysRevC.31.2274.
- Furutachi et al. (2008) N. Furutachi, M. Kimura, A. Doté, Y. Kanada-En’yo, and S. Oryu, Progress of Theoretical Physics 119, 403 (2008), URL http://ptp.oxfordjournals.org/content/119/3/403.abstract.
- Utsuno and Chiba (2011) Y. Utsuno and S. Chiba, Phys. Rev. C 83, 021301 (2011), URL http://link.aps.org/doi/10.1103/PhysRevC.83.021301.
- Smirnov and Yu.M. Tchuvilsky (1977) Y. F. Smirnov and Y. M. Yu.M. Tchuvilsky, Phys. Rev. C 15, 84 (1977).
- Morgan et al. (1970b) G. L. Morgan, D. R. Tilley, G. E. Mitchell, R. A. Hilko, and N. R. Roberson, Phys. Lett. B 32, 353 (1970b).
- Auerbach and Zelevinsky (2011) N. Auerbach and V. Zelevinsky, Rep.Prog.Phys. 74, 106301 (2011).
- Volya and Zelevinsky (2003) A. Volya and V. Zelevinsky, Phys. Rev. C 67, 054322 (2003).
- Volya (2009) A. Volya, Phys. Rev. C 79, 044308 (2009).
- Fynbo et al. (2005) H. O. U. Fynbo et al., Nature 433, 136 (2005).
- Kuchera et al. (2011) A. N. Kuchera, G. V. Rogachev, V. Z. Goldberg, E. D. Johnson, et al., Phys. Rev. C 84, 054615 (2011).
- Goldberg et al. (1974) V. Z. Goldberg, V. P. Rudakov, and V. A. Timofeev, Sov. J. Nucl. Phys. 19, 253 (1974).
- Buck et al. (1975) B. Buck, C. B. Dover, and J. P. Vary, Phys. Rev. C 11, 1803 (1975).
- Fortune (2012) H. T. Fortune, The European Physical Journal A 48, 1 (2012), ISSN 1434-6001, URL http://dx.doi.org/10.1140/epja/i2012-12063-0.