OBSCURATION BY GAS AND DUST IN LUMINOUS QUASARS
Abstract
We explore the connection between absorption by neutral gas and extinction by dust in mid-infrared (IR) selected luminous quasars. We use a sample of 33 quasars at redshifts in the 9 deg2 Boötes multiwavelength survey field that are selected using Spitzer Space Telescope Infrared Array Camera colors and are well-detected as luminous X-ray sources (with 150 counts) in Chandra observations. We divide the quasars into dust-obscured and unobscured samples based on their optical to mid-IR color, and measure the neutral hydrogen column density through fitting of the X-ray spectra. We find that all subsets of quasars have consistent power law photon indices that are uncorrelated with . We classify the quasars as gas-absorbed or gas-unabsorbed if or , respectively. Of 24 dust-unobscured quasars in the sample, only one shows clear evidence for significant intrinsic , while 22 have column densities consistent with . In contrast, of the nine dust-obscured quasars, six show evidence for intrinsic gas absorption, and three are consistent with . We conclude that dust extinction in IR-selected quasars is strongly correlated with significant gas absorption as determined through X-ray spectral fitting. These results suggest that obscuring gas and dust in quasars are generally co-spatial, and confirm the reliability of simple mid-IR and optical photometric techniques for separating quasars based on obscuration.
Subject headings:
galaxies: active – infrared: galaxies – quasars: general– surveys – X-rays: galaxies1. Introduction
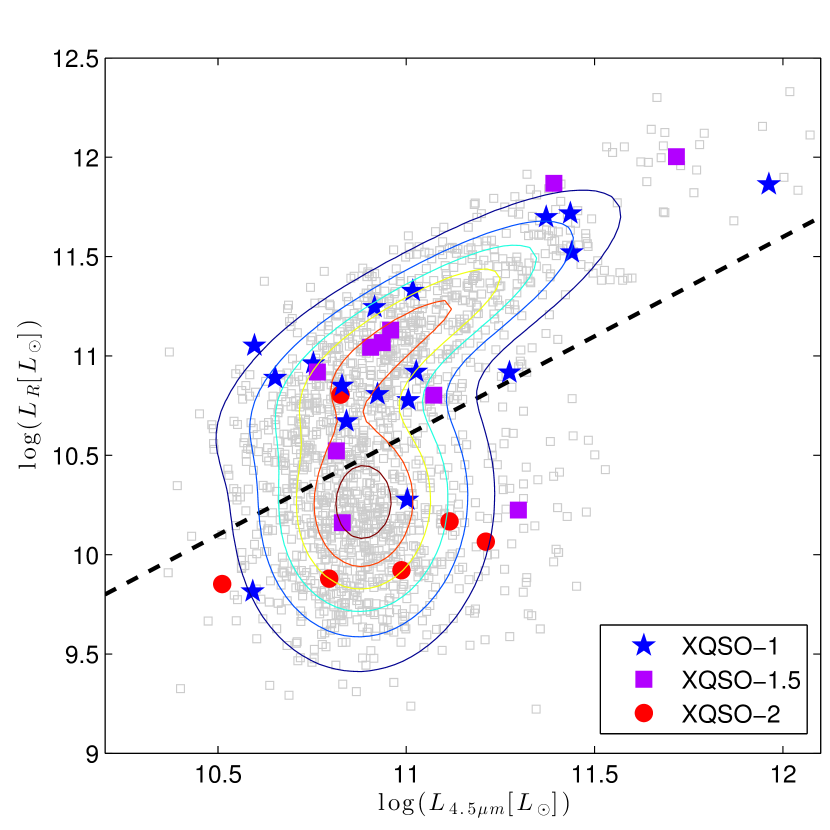
In the past decade, sensitive mid-infrared (IR) observations with the Spitzer Space Telescope and Wide-Field Infrared Explorer (WISE) have forever changed our understanding of BH growth by unveiling, at last, large populations of obscured quasars. Many luminous type 2 active galactic nuclei (AGNs) have been identified from narrow optical emission lines (Zakamska et al. 2003, 2004, 2005; Reyes et al. 2008), radio luminosity (e.g., McCarthy 1993; Martínez-Sansigre et al. 2006; Seymour et al. 2007), or X-ray properties (e.g, Alexander et al. 2001; Stern et al. 2002; Treister et al. 2004; Vignali et al. 2006, 2009), but the most efficient techniques for finding obscured quasars employ mid-IR photometry. Pioneering work with Spitzer showed that obscured quasars have similar mid-IR SEDs to their unobscured counterparts, but are dominated by host galaxy light in the optical (Lacy et al. 2004; Stern et al. 2005; Rowan-Robinson et al. 2005; Polletta et al. 2006; Alonso-Herrero et al. 2006; Donley et al. 2008; Hickox et al. 2007, hereafter H07). In the mid-IR, obscured quasars can be reliably selected using simple color criteria, in particular being very red in [3.6]–[4.5] (characteristic of a “hot” mid-IR SED) and very red in , indicating a faint optical counterpart (Fig.1). Mid-IR studies find roughly equal numbers of obscured and unobscured quasars (e.g., \al@hick07abs, dono14qsoclust; \al@hick07abs, dono14qsoclust).
Obscured quasars therefore represent a large fraction of the massive BH growth in the Universe, but their precise nature remains a mystery. In particular, what is the origin of the obscuring material, and what role do these objects play in the evolution of black holes and galaxies? The simple “unified model” for AGN attributes obscuration to the orientation of a gas- and dust-rich torus intrinsic to the central engine (e.g., Antonucci 1993; Ballantyne et al. 2006), but it is not clear whether this model applies to objects with quasar luminosities. A competing hypothesis is that quasars are fueled by major mergers of galaxies that drive gas and dust clouds to the nucleus, obscuring the central engine, as suggested in models of BH-galaxy co-evolution (e.g., Sanders et al. 1988; Hopkins et al. 2008).
One clue about the nature of the obscuring material is the connection between obscuration by dust which is manifested through extinction of rest-frame ultraviolet and optical nuclear light, and absorption by neutral gas which is detectable by its effect on the observed X-ray spectrum. In the simplest unified scenarios, neutral gas and dust are co-spatial and so both types of obscuration should be observed in the same systems. This is in fact what is observed in most obscured AGNs, however 30% of moderate-luminosity AGNs show a mismatch between optical and X-ray classification criteria (e.g., Tozzi et al., 2006; Trouille et al., 2009), suggesting some deviation from the simplest unified scenario.
Obscuration is particularly interesting for powerful quasars (given the expected importance of merger fueling) but the obscuration properties of luminous AGN have been less well studied due to their relative rarity. Furthermore, it is also interesting to study the obscuration in luminous quasars given the reported decreasing trend of obscured AGN at increasing luminosities (e.g., Ueda et al. 2003; Hasinger et al. 2005; Merloni et al. 2014). A recent study of X-ray selected AGNs in the COSMOS field Merloni et al. (2014) found that at quasar luminosities ( erg s-1) 80% of AGNs have classifications for dust and gas obscuration that agree, with the majority of the ”mismatch” corresponding to optically-unobscured but gas-obscured sources. Previous studies of such objects have suggested they are preferentially hosted by more rapidly star-forming galaxies, indicating that the X-ray absorbing gas arises from galaxy-scale structures that are far larger than the putative torus, and may be associated with an outflowing wind (Page et al., 2004). However, Merloni et al. (2014) found that X-ray obscured, optically-unobscured quasars have spectra and photometric properties that are identical to their X-ray unobscured counterparts, suggesting that the absorption may instead be due to small-scale clouds within the putative torus.
In this study, we further explore the connection between gas and dust obscuration in luminous quasars, using observations from the wide-field (9 deg2) Boötes multiwavelength survey area that enable efficient selection of rare, luminous sources. We analyze X-ray spectra of 33 high-luminosity IR-selected quasars in the XBoötes Deep Survey. We find a strong correspondence between dust and gas obscuration in luminous quasars, consistent with the predictions of unified models as well as simple evolutionary scenarios in which the gas and dust are co-spatial.
2. Observations and quasar sample
Our sample of quasars is drawn from H07, who selected 1479 luminous AGNs based on the mid-IR color criteria of Stern et al. (2005). The vast majority of these sources have estimates of bolometric luminosity corresponding to the commonly-used division between “Seyfert galaxies” and “quasars” (e.g., Hopkins & Hernquist, 2009), so for the remainder of this paper we refer to the sample objects as quasars. The mid-IR observations come from the Spitzer IRAC Shallow Survey (Eisenhardt et al., 2004; Brodwin et al., 2006) and optical photometry from the NOAO Deep Wide Field Survey Jannuzi & Dey (1999), and is limited to redshifts determined by optical spectroscopy from the AGN and Galaxy Evolution Survey (AGES; Kochanek et al. 2012) or using photometric redshifts from Brodwin et al. (2006). H07 found that the full IR-selected quasar sample could be easily divided into dust-obscured and unobscured sources based on their optical to mid-IR color, as they exhibited a bimodal color distribution with a boundary at (or equivalently , where and are the luminosities in the observed-frame and 4.5 micron bands; see Figure 1). We also include estimates of quasar bolometric luminosity derived from fitting mid-IR spectral energy distributions, as described by Hickox et al. (2011).
H07 showed that the objects with blue colors are dominated in the optical by unobscured light from the quasar nucleus, while the nucleus is obscured in the redder sources such that the optical light is dominated by the host galaxy. H07 also showed via an X-ray stacking analysis that the average X-ray spectra of unobscured quasars were consistent with no absorption by neutral gas, while the obscured quasars had harder average X-ray spectra indicating significant gas absorption with cm-2. However, given the shallow (5 ks; Murray et al. 2005) X-ray observations available in the H07 analysis, this comparison was only possible for average X-ray hardness ratios and could not explore variations in X-ray spectra between individual sources.
This study expands on that work by analyzing deeper Chandra ACIS observations (including from the XBoötes Deep Survey) of quasars in the H07 sample. The deeper observations consist of 36 exposures between 2001 and 2012 with an average exposure time of 41.6 ks, of which 13 are with the ACIS-I array and 13 are with ACIS-S (Table 1). The data were reprocessed using the CHAV (v.2011.01.25) and CIAO 4.1.2 (CALDB 4.1.4) packages. To obtain sufficient quality X-ray spectra we limit our analyses to objects with 150 counts in the 0.2-7 keV band. We match the sources to the 1479 IR-selected quasars from H07 using the TOPCAT (Taylor, 2005) cone-search algorithm with a 10″ radius. A total of 33 quasars were selected, with an average of counts per source.
Using the H07 color criterion, 24 of the IR-selected quasars in our sample are classified as unobscured (IRQSO-1) while 9 are obscured (IRQSO-2). Our bright X-ray spectroscopic sample contains a low fraction of IRQSO-2s (9/33 or 27%) that is significantly smaller than the 43% obscured fraction in the full IRQSO sample from H07. This is due to the fact that X-ray QSO2s are generally fainter in X-rays; the fraction of IRQSOs with X-ray counterparts in original shallow (5 ks) XBoötes survey is 60% for IRQSO-1s and only 30% for IRQSO-2s, while the average X-ray flux of the undetected sources, determined from stacking, is also systematically lower for the IRQSO-2s (H07). The fainter X-ray emission from IRQSO-2s is most likely due to higher levels of gas obscuration that not only hardens the X-ray spectrum but reduces the observed flux (e.g., Alexander et al., 2008). This fact reflects a correspondence between gas and dust obscuration in these quasars, which we aim to test further by direct measurement of the obscuring column density () in the X-ray spectra of the bright sources for which these measurements are possible.
3. X-Ray Analysis
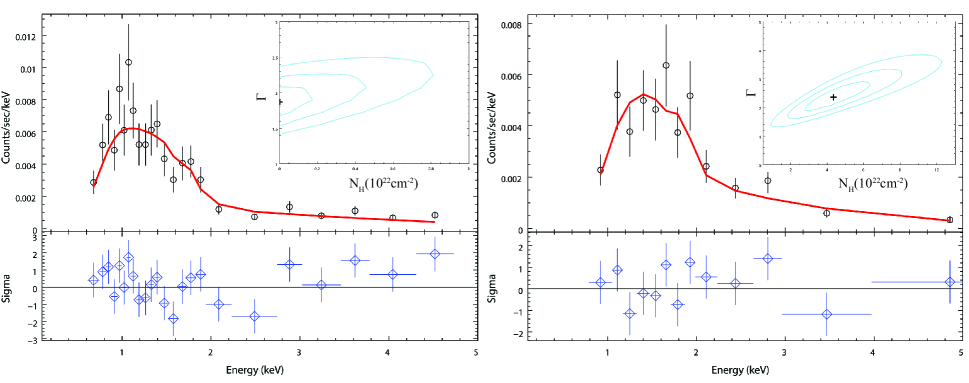
We extract source and background spectra and produce response functions using standard CIAO software. Sources and background spectra were extracted from hand-selected circular regions with mean radii of 11.5 pixels and 100.1 pixels, respectively. The resulting spectra were fit using SHERPA (4.1.2) with a one-dimensional power law (xspowerlaw.p1) convolved with two neutral hydrogen absorption laws, one for the Milky Way (xswabs.abs1), and one for the host galaxy (xszwabs.abs2) absorption. The Milky Way absorption column density was frozen at the mean of all 33 quasars, cm-2, derived from the Chandra X-ray Center’s COLDEN calculator. The host galaxy redshifts are fixed at values taken either from AGES spectroscopic measurements (Kochanek et al., 2012) or photometric redshifts (Brodwin et al., 2006), as described in H07. The power-law index , normalization, and intrinsic were allowed to vary in the spectral fitting. Examples of the X-ray spectral fits are shown in Figure 2 for one source showing no evidence for gas absorption, and another with detectable .
| Identifier | Exposure | zaaDifferences in redshift precision correspond to the differences between spectroscopic and photometric estimates (). | Counts | bbFluxes and luminosities are unabsorbed and calculated in the 0.5-7keV band. | log | XQSO | ||
|---|---|---|---|---|---|---|---|---|
| (ks) | (0.5-7 keV) | ( cm-2) | Class | |||||
| IRQSO-1 | ||||||||
| SDWFS J142942.63+335654.94 | 47.1 | 1.1251 | 607 | 17.3 | 45.1 | 1 | ||
| SDWFS J142810.31+353847.31 | 37.9 | 0.8028 | 852 | 16.5 | 44.7 | 1 | ||
| SDWFS J143520.20+340929.20 | 42.6 | 1.0972 | 182 | 1.75 | 44.1 | 1 | ||
| SDWFS J143520.60+340514.68 | 42.6 | 0.7973 | 217 | 3.38 | 44.0 | 1 | ||
| SDWFS J143513.41+350053.77 | 44.0 | 1.1471 | 325 | 3.50 | 44.4 | 1 | ||
| SDWFS J143520.14+350413.23 | 44.0 | 1.0512 | 339 | 1.10 | 43.8 | 1 | ||
| SDWFS J142922.94+351517.74 | 42.0 | 0.9041 | 408 | 10.4 | 44.6 | 1 | ||
| SDWFS J142634.05+351602.56 | 14.9 | 1.1055 | 177 | 6.61 | 44.7 | 1 | ||
| SDWFS J143651.98+350537.97 | 54.3 | 0.864 | 200 | 0.54 | 43.3 | 1 | ||
| SDWFS J142651.47+351924.40 | 29.7 | 1.756 | 833 | 12.4 | 45.4 | 1 | ||
| SDWFS J142839.20+353455.55 | 37.9 | 1.0693 | 228 | 5.31 | 44.5 | 1 | ||
| SDWFS J142829.91+342758.68 | 68.6 | 1.1401 | 301 | 3.31 | 44.4 | 1 | ||
| SDWFS J143245.88+333758.45 | 33.8 | 1.0816 | 192 | 3.43 | 44.3 | 1 | ||
| SDWFS J142917.20+342130.31 | 28.7 | 1.2734 | 306 | 6.06 | 44.8 | 1 | ||
| SDWFS J142607.71+340426.61 | 51.2 | 4.32 | 468 | 7.27 | 46.1 | 1 | ||
| SDWFS J143310.25+335421.99 | 27.7 | 0.8792 | 238 | 9.62 | 44.6 | 1.5 | ||
| SDWFS J143153.67+344138.17 | 50.2 | 0.8254 | 481 | 8.16 | 44.4 | 2 | ||
| SDWFS J142658.70+324003.78 | 42.0 | 1.7737 | 212 | 5.45 | 45.1 | 1.5 | ||
| SDWFS J142915.19+343820.18 | 29.7 | 2.3515 | 202 | 3.87 | 45.2 | 1.5 | ||
| SDWFS J142622.68+334202.41 | 33.8 | 1.3517 | 182 | 4.27 | 44.7 | 1.5 | ||
| SDWFS J143434.40+330549.14 | 56.8 | 2.0656 | 154 | 0.49 | 44.2 | 1.5 | ||
| SDWFS J142859.55+350349.11 | 42.0 | 1.6126 | 165 | 2.89 | 44.7 | 1.5 | ||
| SDWFS J143431.07+332825.51 | 39.9 | 1.0554 | 155 | 4.70 | 44.5 | 1.5 | ||
| SDWFS J143450.01+352520.65 | 30.7 | 0.9629 | 184 | 8.17 | 44.6 | 1.5 | ||
| IRQSO-2 | ||||||||
| SDWFS J143210.97+343957.89 | 81.9 | 0.83 | 204 | 1.93 | 43.8 | 1 | ||
| SDWFS J142824.97+352842.63 | 37.9 | 1.49 | 217 | 4.90 | 44.8 | 1 | ||
| SDWFS J142845.07+350903.30 | 42.0 | 0.81 | 463 | 9.52 | 44.5 | 1.5 | ||
| SDWFS J142813.98+325502.82 | 33.8 | 1.54 | 264 | 10.8 | 45.2 | 1.5 | ||
| SDWFS J143502.04+330556.51 | 56.8 | 1.58 | 299 | 5.09 | 44.9 | 2 | ||
| SDWFS J143503.49+340241.92 | 42.6 | 1.06 | 219 | 2.54 | 44.2 | 2 | ||
| SDWFS J143359.09+331301.06 | 42.0 | 0.92 | 330 | 17.3 | 44.9 | 2 | ||
| SDWFS J142916.10+335537.36 | 24.6 | 0.98 | 220 | 7.30 | 44.6 | 2 | ||
| SDWFS J142707.05+325214.17 | 42.0 | 2.28 | 244 | 5.65 | 45.4 | 2 | ||
The spectral fit parameters ( and intrinsic ) and errors along with other quasar properties are shown in Table 1. In many cases, the observed is consistent with zero and only upper limits are obtained. We classify the quasars as gas-absorbed (XQSO-2) or gas-unabsorbed (XQSO-1) if or , respectively, following the convention used widely in the literature (e.g., Tozzi et al. 2006; Lanzuisi et al. 2013; Ueda et al. 2014). For several sources (XQSO-1.5) the classification is ambiguous, with consistent with either subset within the uncertainties. (We note that a division at cm-2, as in Merloni et al. 2014, produces more ambiguous classifications due to the uncertainties in our measurements, but results in the same qualitative conclusions.) In Figure 1 we show the IR and optical luminosities of the quasars in different X-ray classes, and in Figure 3 we show the distribution in and for all the sources. We note that there is no clear correlation between and , verifying that we have sufficient counts in each source to sufficiently break the degeneracy between those parameters. The error-weighted average value of is for the full sample, and for the subsets is (XQSO-1), (XQSO-1.5) and (XQSO-2), all consistent with previous measurements for the intrinsic photon index for AGNs and quasars (e.g., Tozzi et al., 2006; Xue et al., 2011).
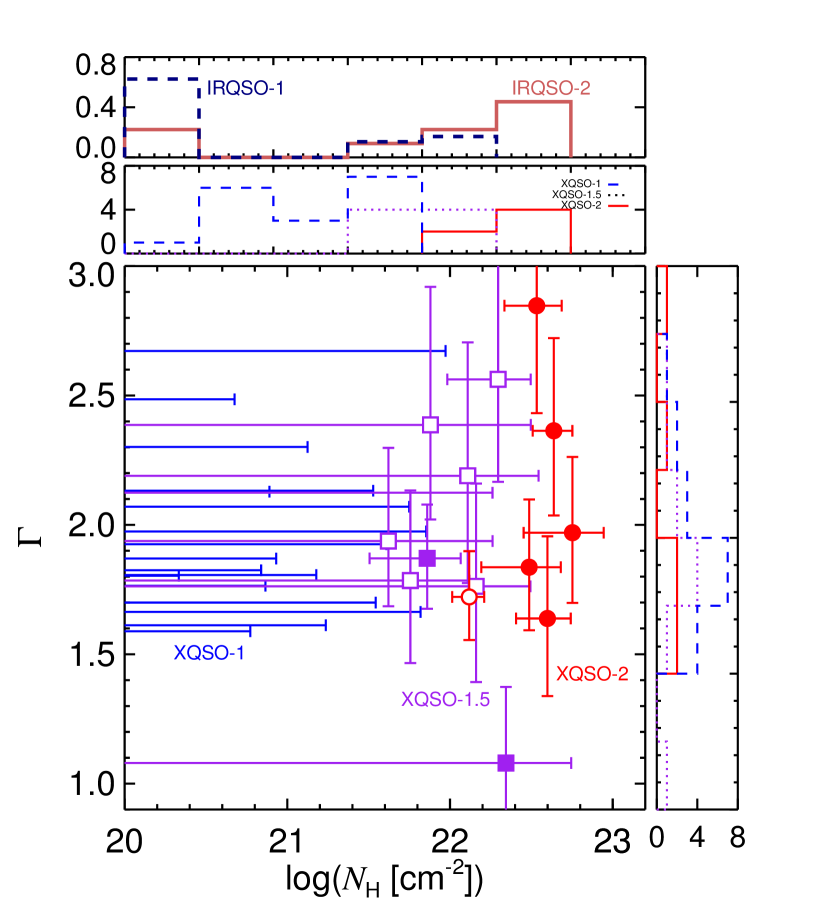
The primary result of this analysis is the correspondence between the optical/mid-IR and X-ray obscuration criteria. Among the 24 dust-unobscured (IRQSO-1) quasars, we find 15 XQSO-1s, 8 XQSO-1.5s (of which 7 have consistent with zero), and only one XQSO-2. In contrast, the 9 dust-obscured quasars (IRQSO-2s) comprise only 2 XQSO-1s, 2 XQSO-1.5s (of which one has consistent with zero) and 5 XQSO 2s. We thus obtain a strong, if not perfect, correlation between absorption by gas and dust, with only a few examples showing clearly anomalous gas absorption for the observed optical and mid-IR properties (broadly consistent with the results of Merloni et al. 2014. The largest observed in our XQSO-2 sample is relatively modest (only a few cm-2); it is likely that more heavily obscured sources () are excluded from our X-ray spectroscopic sample because their observed fluxes are too faint to yield the required numbers of counts, as discussed in § 2.
4. Discussion and conclusions
Overall, these results indicate that obscuration by gas and dust are strongly correlated in IR-selected luminous quasars. This correspondence indicates that gas and dust obscuration generally arise in the same structures, consistent with the predictions of the unified model but also with the simplest evolutionary models. We thus cannot draw robust conclusions about whether the obscuring material is in a small-scale torus or due to larger-scale galactic structures. A recent study of their far-IR properties using 250 m data from Herschel suggests that the IRQSO-2s have higher average rates of star formation than IRQSO-1s (Chen et al. 2014, in prep), suggesting that at least some quasars are obscured by galaxy-scale material associated with rapid star formation. However, only 4 of our 33 objects are detected at 250 m with Herschel and of these two show neither gas nor dust obscuration, while the other two are obscured in both classifications, so it is unclear whether large-scale material is responsible for any of the observed obscuration.
We find that only a small fraction of dust-unobscured quasars show clear X-ray absorption signatures. Of the quasars in our X-ray spectroscopic sample, 17% are IRQSO-1s with best-fit values of cm-2, similar to the fraction of such mismatches found by Merloni et al. (2014). We note however that all but one of these objects are consistent with having little or no gas absorption, and their distribution in the plane IR and optical luminosity (Figure 1) is indistinguishable to IRQSO-1s with no X-ray absorption. We therefore caution that the observed incidence of these mismatches must be treated as an upper limit, and that the X-ray absorbed broad-line quasars may in fact be rare in the full quasar population; an accurate census of quasars with modest obscuration provides strong motivation for future high-throughput X-ray observatories.
Overall our results serve to verify that obscured quasar selection based on optical to mid-IR color H07 preferentially identifies systems that show evidence for obscuration at other wavelengths. Even in our bright X-ray spectroscopic sample, for which the effective flux limit biases us against heavily X-ray obscured sources as discussed in § 2, we still find that the majority of dust-obscured quasar candidates show clear evidence for X-ray absorption. This indicates that the full population of dust-obscured quasars likely has a very high incidence of corresponding gas absorption. These results confirm that optical/mid-IR color selection is effective in selecting even moderately obscured quasars at the highest luminosities, providing a strong basis for future large statistical studies of obscured quasars selected based on WISE and optical photometry.
References
- Alexander et al. (2001) Alexander, D. M., Brandt, W. N., Hornschemeier, A. E., Garmire, G. P., Schneider, D. P., Bauer, F. E., & Griffiths, R. E. 2001, AJ, 122, 2156
- Alexander et al. (2008) Alexander, D. M., et al. 2008, ApJ, 687, 835
- Alonso-Herrero et al. (2006) Alonso-Herrero, A., et al. 2006, ApJ, 640, 167
- Antonucci (1993) Antonucci, R. 1993, ARA&A, 31, 473
- Ballantyne et al. (2006) Ballantyne, D. R., Shi, Y., Rieke, G. H., Donley, J. L., Papovich, C., & Rigby, J. R. 2006, ApJ, 653, 1070
- Brodwin et al. (2006) Brodwin, M., et al. 2006, ApJ, 651, 791
- Donley et al. (2008) Donley, J. L., Rieke, G. H., Pérez-González, P. G., & Barro, G. 2008, ApJ, 687, 111
- Donoso et al. (2014) Donoso, E., Yan, L., Stern, D., & Assef, R. J. 2014, ApJ submitted (arXiv:1309.2277)
- Eisenhardt et al. (2004) Eisenhardt, P. R., et al. 2004, ApJS, 154, 48
- Hasinger et al. (2005) Hasinger, G.,Miyaji, T., & Schmidt, M. 2005, A&A, 441, 417
- Hickox et al. (2007) Hickox, R. C., et al. 2007, ApJ, 671, 1365
- Hickox et al. (2011) Hickox, R. C., et al. 2011, ApJ, 731, 117
- Hopkins & Hernquist (2009) Hopkins, P. F. & Hernquist, L. 2009, ApJ, 694, 599
- Hopkins et al. (2008) Hopkins, P. F., Hernquist, L., Cox, T. J., & Kereš, D. 2008, ApJS, 175, 356
- Jannuzi & Dey (1999) Jannuzi, B. T. & Dey, A. 1999, in ASP Conf. Ser. 191: Photometric Redshifts and the Detection of High Redshift Galaxies, ed. R. Weymann, L. Storrie-Lombardi, M. Sawicki, & R. Brunner (San Francisco: ASP), 111
- Kochanek et al. (2012) Kochanek, C. S., et al. 2012, ApJS, 200, 8
- Lacy et al. (2004) Lacy, M., et al. 2004, ApJS, 154, 166
- Lanzuisi et al. (2013) Lanzuisi, A., et al. 2013, MNRAS, 431, 978
- Martínez-Sansigre et al. (2006) Martínez-Sansigre, A., Rawlings, S., Lacy, M., Fadda, D., Jarvis, M. J., Marleau, F. R., Simpson, C., & Willott, C. J. 2006, MNRAS, 370, 1479
- McCarthy (1993) McCarthy, P. J. 1993, ARA&A, 31, 639
- Merloni et al. (2014) Merloni, A., et al. 2014, MNRAS, 437, 3550
- Murray et al. (2005) Murray, S. S., et al. 2005, ApJS, 161, 1
- Page et al. (2004) Page, M. J., Stevens, J. A., Ivison, R. J., & Carrera, F. J. 2004, ApJ, 611, L85
- Polletta et al. (2006) Polletta, M. d. C., et al. 2006, ApJ, 642, 673
- Reyes et al. (2008) Reyes, R., et al. 2008, AJ, 136, 2373
- Rowan-Robinson et al. (2005) Rowan-Robinson, M., et al. 2005, AJ, 129, 1183
- Sanders et al. (1988) Sanders, D. B., Soifer, B. T., Elias, J. H., Madore, B. F., Matthews, K., Neugebauer, G., & Scoville, N. Z. 1988, ApJ, 325, 74
- Seymour et al. (2007) Seymour, N., et al. 2007, ApJS, 171, 353
- Stern et al. (2005) Stern, D., et al. 2005, ApJ, 631, 163
- Stern et al. (2002) Stern, D., et al. 2002, ApJ, 568, 71
- Taylor (2005) Taylor, M. B. 2005, in Astronomical Society of the Pacific Conference Series, Vol. 347, Astronomical Data Analysis Software and Systems XIV, ed. P. Shopbell, M. Britton, & R. Ebert, 29
- Tozzi et al. (2006) Tozzi, P., et al. 2006, A&A, 451, 457
- Treister et al. (2004) Treister, E., et al. 2004, ApJ, 616, 123
- Trouille et al. (2009) Trouille, L., Barger, A. J., Cowie, L. L., Yang, Y., & Mushotzky, R. F. 2009, ApJ, 703, 2160
- Ueda et al. (2014) Ueda, Y., Akiyama, M., Hasinger, G., Miyaji, T., & Watson, M. G. 2014, ApJ, 786, 104
- Ueda et al. (2003) Ueda, Y., Akiyama, M., Ohta, K., & Miyaji, T. 2003, ApJ, 598, 886
- Vignali et al. (2006) Vignali, C., Alexander, D. M., & Comastri, A. 2006, MNRAS, 373, 321
- Vignali et al. (2009) Vignali, C., et al. 2009, MNRAS, 395, 2189
- Xue et al. (2011) Xue, Y. Q., et al. 2011, ApJS, 195, 10
- Zakamska et al. (2005) Zakamska, N. L., et al. 2005, AJ, 129, 1212
- Zakamska et al. (2004) Zakamska, N. L., Strauss, M. A., Heckman, T. M., Ivezić, Ž., & Krolik, J. H. 2004, AJ, 128, 1002
- Zakamska et al. (2003) Zakamska, N. L., et al. 2003, AJ, 126, 2125