Efficiency determination of resistive plate chambers for fast quasi–monoenergetic neutrons
Abstract
Composite detectors made of stainless steel converters and multigap resistive plate chambers have been irradiated with quasi-monoenergetic neutrons with a peak energy of 175 MeV. The neutron detection efficiency has been determined using two different methods. The data are in agreement with the output of Monte Carlo simulations. The simulations are then extended to study the response of a hypothetical array made of these detectors to energetic neutrons from a radioactive ion beam experiment.
pacs:
29.40.CsGas-filled counters: ionization chambers, proportional, and avalanche counters and 29.38.DbFast radioactive beam techniques1 Motivation
Nuclear reactions involving nuclei close to or beyond the neutron drip line must be studied in order to understand the synthesis of the heavy chemical elements Wiescher12-ARAA . One of the experimental methods to investigate such exotic nuclear systems is the invariant mass method, which requires a kinematically complete measurement. By detecting and identifying the products of the nuclear reaction in question and determining their momentum, the invariant mass of the system can be reconstructed. Due to the abundance of neutrons in the typical nuclei under investigation, this technique usually involves neutron detection.
The R3B (Reactions with Relativistic Radioactive Beams) collaboration aims to study the properties of such exotic nuclei Aumann07-PPNP . At the present R3B setup in cave C of GSI, the Large Area Neutron Detector (LAND) Blaich92-NIMA is used. This device covers 22 m2 area and reaches a single-neutron efficiency of 90% for 0.5 GeV neutrons, with a typical time-of-flight resolution of = 250 ps Boretzky03-PRC . Similar but smaller detectors for high-energy neutrons exist at radioactive ion beam facilities in the United States Baumann05-NIMA and Japan Kobayashi13-NIMB and at the COSY-TOF spectrometer in Jülich, Germany Karsch01-NIMA .
The ongoing construction of a new infrastructure for producing radioactive ion beams named FAIR (Facility for Antiproton and Ion Research) in Darmstadt requires a more powerful neutron detector for the future R3B setup, with the working title NeuLAND NeuLAND-TDR11 .
The properties aimed for with NeuLAND are unprecedented for a fast neutron (0.2-1.0 GeV) array: at least 90% detection efficiency for single neutrons at 0.2 GeV energy, a very large angular coverage of 80 mrad at a distance of 12 m to the reaction target, an excellent time resolution of = 150 ps and the needed granularity to achieve good invariant mass resolution, e.g., =20 keV at 100 keV excitation energy above the threshold for medium mass systems. Also, the setup must be able to identify multi-neutron events with up to four neutrons per event, and correctly reconstruct their momentum.
There are two basic approaches in order to build such a device, and both have been studied in depth during the development phase of NeuLAND Aumann10-AnnRep :
-
(A)
A detector may be built out of a large, suitably subdivided volume of plastic scintillator material, exploiting the interaction of energetic neutrons with the protons included in the plastic for the detection Baumann05-NIMA ; Kobayashi13-NIMB ; Karsch01-NIMA .
-
(B)
Alternatively, a hybrid approach can be chosen, with a converter material with relatively large density and atomic charge number (e.g. iron) efficiently converting neutrons to high-energy protons. The energetic protons, in turn, are subsequently detected in a charged-particle detector with excellent time resolution. Converter and detector layers must be alternated, so that the resolution is not limited by insufficient granularity. This approach has been used for the previous LAND detector Blaich92-NIMA . For NeuLAND it was studied whether a similar approach with smaller granularity may be adopted, replacing the scintillator material with multigap resistive plate chamber (MRPC) detectors with their excellent time resolution and less expensive readout.
In the end, approach (A) was selected for NeuLAND, based on the better multi-hit capability of a fully active device NeuLAND-TDR11 when compared with a converter-based detector. However, detectors for energetic neutrons based on approach (B) may have applications in other fields, in particular where their more limited multi-neutron capability Elekes13-NIMA is sufficient and where construction and operating costs pose a challenge.
In the present work, the results from an in-beam test of a neutron detector based on approach (B) are reported. That detector, developed at HZDR, was tested in a campaign together with similar counters developed at GSI Caesar12-NIMA . The measurement campaign and the present work are part of the development effort of NeuLAND, which was recently concluded in a Technical Design Report NeuLAND-TDR11 .
2 Description of the detector under study
The detector under study was built using an iron converter and multigap resistive plate chambers (MRPCs). A resistive plate chamber is a gas-filled, parallel plate avalanche device, the electrodes of which are made from high-resistivity material. It was developed over 30 years ago Santonico81-NIM and has since been used in a number of experiments (Peskov-RPC2012, , for a review). MRPCs are known for their excellent time resolution reaching = 25 ps An08-NIMA .
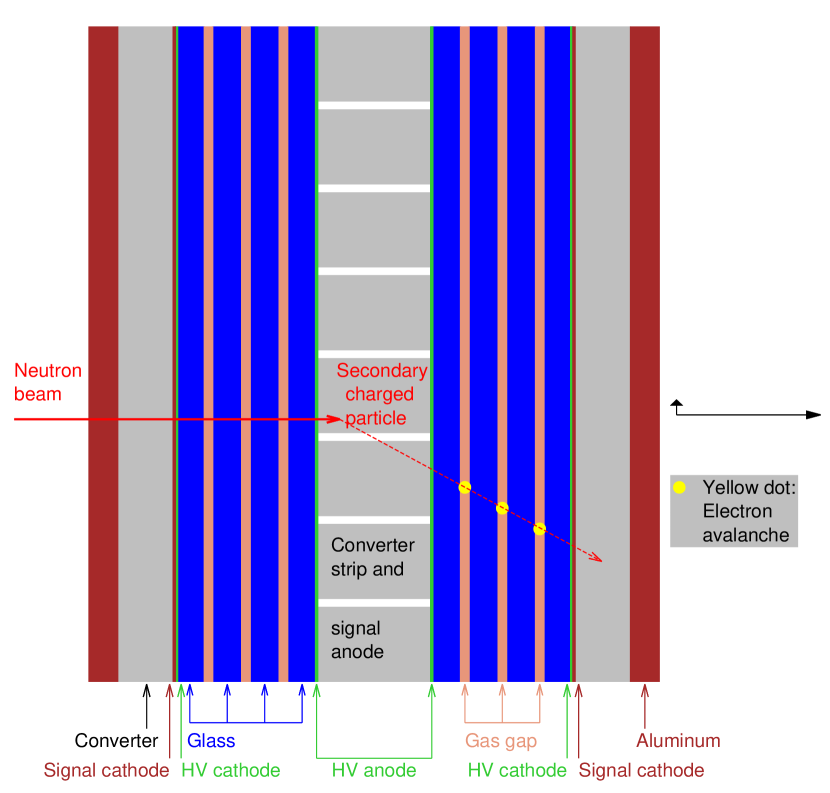
For the converter, stainless steel has been chosen. This material offers excellent structural stability in connection with a relatively high density. The impinging neutron beam passes, in sequence (fig. 1),
-
•
the 1 mm thick aluminum housing of the prototype,
-
•
then a 2 mm thick converter plate,
-
•
then the first half of the 23 gap MRPC structure,
-
•
then 4 mm thick, 25 mm wide converter strips that are also used for the read out of the electrical signal (induced charge),
-
•
then the second half of the 23 gap MRPC structure,
-
•
and finally a 2 mm thick plate of converter material.
The MRPC structure consists of three gas gaps of 0.3 mm thickness each. The working gas was a mixture of 85% Freon R134a, 10% SF6, and 5% iso-butane and was continuously flushed in order to avoid degradation of the detector performance. The gas gaps were separated by 1 mm thick layers of float glass held in place by fishing lines. A typical electric field of 110 kV/cm was applied between the outside of the structure (negative high voltage) and the center (ground potential), guaranteeing 95% efficiency for minimum ionizing particles in the present 23 gap structure. The high voltage electrodes used were made of semiconductive coated mylar.
Neutrons hitting one of the converter plates produce charged particles. These charged particles generate an electron avalanche in the gas gaps, which, in turn, generates an induced charge on the central readout anode. The central converter, which was also used to read out the signals, was segmented with a strip width of 25 mm and an interstrip spacing of 3 mm. Two different prototypes called HZDR-1b and HZDR-3c, respectively, were used. Further details on the prototypes studied here can be found elsewhere Yakorev11-NIMA .
The detector design is intended to be iterated about 50 times in order to reach 90% efficiency. In that scenario, the final 2 mm plate and the 2 mm entrance plate of the subsequent MRPC structure form together 4 mm effective thickness. The prototype studied in the present work consists of just one 23 gap MRPC structure.
During the development phase of the detector, prototypes of 4020 cm2 (reduced size) and 20050 cm2 (final size) were produced and tested. The optimization process was carried out on the reduced size prototypes and involved numerous tests at the superconducting electron accelerator ELBE, which provided an electron beam of 30 MeV with time resolution of a few ps Yakorev11-NIMA .
Both for the reduced size Yakorev11-NIMA and for the final size Elekes13-NIMA prototypes, it was proven by electron beam experiments at ELBE that the MRPC-based neutron detectors can deliver the requested 100 ps time resolution and 90% efficiency for minimum ionizing particles. Extensive Monte Carlo simulations were carried out Elekes13-NIMA in order to extend these experimental findings to a simulated response for the full detector, which should include 50 subsequent layers of the final size prototype.
In order to further firm up the conclusions from the Monte Carlo simulations, several prototypes of reduced size were transported to the quasi-monochromatic neutron beam facility of The Svedberg Laboratory (TSL) Prokofiev07-RPD at Uppsala University, Sweden.
The neutron kinetic energy of 175 MeV available at TSL is just below the lower edge of the energetic range foreseen for NeuLAND, 0.2-1.0 GeV. The performance of a converter-based detector should in principle improve with increasing kinetic neutron energy. This is so, because at higher neutron kinetic energy, secondary particles produced in the converter are more likely to have sufficient energy to reach the MRPC structure and are more forward focused, minimizing efficiency losses to the sides. The present experiment just below the lower energy range of NeuLAND is, therefore, suitable for a partial but stringent test of whether the working principle of the above described approach (B) for NeuLAND is sound.
3 Experiment at TSL Uppsala
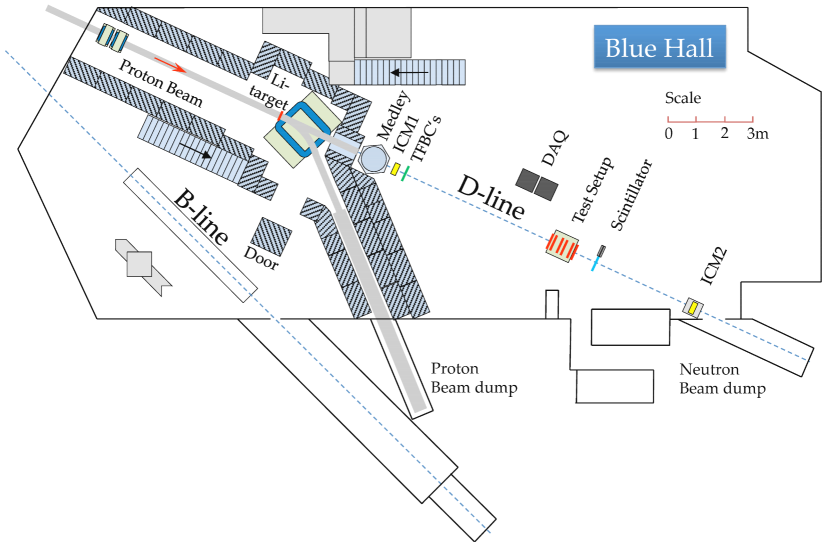
The experiment took place at the quasi-monochromatic neutron irradiation facility in the "Blue Hall" of TSL Uppsala Prokofiev07-RPD . A proton beam of 179 MeV hit a 23.5 mm thick target of metallic lithium, enriched to 99.99% in 7Li (fig. 2). The target had a rectangular shape of 2032 mm2 and was directly water-cooled. The proton beam current on target was typically 300 nA. Just downstream of the lithium target the protons were deflected by a magnet and transported to a water-cooled beam dump made of graphite. The neutron beam produced by the 7Li(p,n)7Be reaction in the target was then shaped successively by several collimators made of iron:
-
•
cylindrical with a diameter of 20 cm and a length of 80 cm placed at 137 cm from the lithium target,
-
•
conical with a diameter changing from 30.09 cm to 47.48 cm and a length of 100 cm placed at 217 cm from the lithium target,
-
•
conical with a diameter changing from 57.11 cm to 61.46 cm and a length of 25 cm placed at 331 cm from the lithium target.
These collimators were surrounded by concrete blocks, which also served to shield the user area from the production target.
Just after the exit of the collimators, there was another user setup, MEDLEY Bevilacqua11-NIMA . MEDLEY exposed only a thin reaction target of typical thickness 1 mm to the neutron beam. Thus, it attenuated the beam only negligibly, and no significant flux of disturbing particles is expected outside the MEDLEY chamber.
Downstream of MEDLEY, the detectors used for the present experiment were arranged in the path of the neutron beam. The neutron flux was measured by two ionization chamber monitors (ICMs). The first ICM was placed just downstream of MEDLEY, at a distance of 5 m from the lithium target, and the second one at the very end of the hall just before the neutron beam dump, at a distance of 16 m from the lithium target. As an additional neutron flux monitor, altogether three thin film breakdown counters (TFBCs Prokofiev99-Techreport ) were used, all of them placed just downstream of the first ICM.
For the purposes of the present analysis, the neutron flux at the irradiation position was taken to be the weighted average of the fluxes determined from the first ICM (calibrated to 10% precision), from a large TFBC (calibrated to 10%), and from the current in the proton beam dump (neutron conversion coefficient calibrated to 30%), all three fluxes converted to an effective flux at the MRPC position, properly taking the distances into account. The neutron fluxmeters were calibrated for the main, quasi-monochromatic peak in the neutron spectrum. Altogether the neutron flux was conservatively assumed to be known with 10% precision.
The MRPC detector to be tested (sec. 2) was placed in the neutron beam at a distance of 11 m from the lithium target. The electronics modules for the data acquisition were placed in the experimental cave at a distance of about 2 m from the MRPC, but out of the neutron beam.
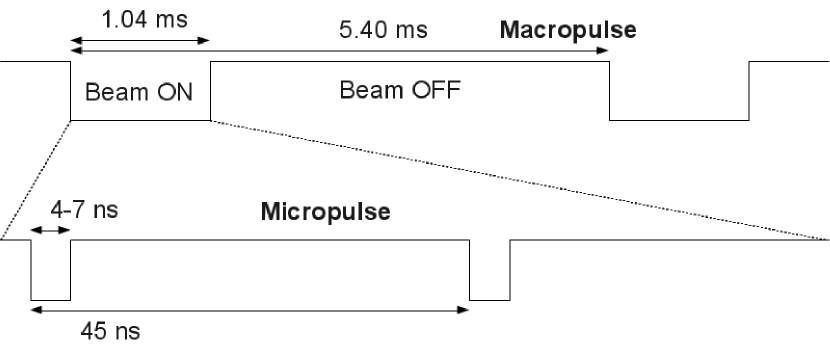
The proton beam from the Gustav Werner cyclotron had a time structure with a frequency of 185 Hz corresponding to a macropulse length of 5405 s (fig. 3).
The beam was emitted only during the so-called beam-on time window, which was conservatively taken to be 1040 s long for the purposes of the data acquisition (DAQ). The offline analysis later showed that a somewhat shorter window of 850 s might have been chosen for the beam-on flag. As the flag affected the trigger condition, it was not possible to change the time interval flagged as beam-on in the offline analysis. During the beam-on time window, micropulses of 4-7 ns width and a repetition time of 45 ns were emitted. The number of protons emitted per micropulse varied strongly during the beam-on period. Depending on the precise run conditions, only for the first 81040 s of the beam-on period protons were emitted by the cyclotron.
The beginning of the acceleration was triggered by a pulse generator, and that signal was used as logical signal for the DAQ to trigger the beam-on range. During the acceleration, the cyclotron radiofrequency (RF) followed a pre-programmed time dependence. At the end of the acceleration cycle, the RF system waited for the next trigger pulse from the generator.
4 Data acquisition
The electron avalanches in the MRPC gas gaps induced signals on the central anodes. These current signals were transported to either FOPI Ciobanu07-IEEE or PADI Ciobanu08-IEEE front end electronics (FEE). The FEEs had adjustable thresholds. They were located directly at each end of the strips and gave both a timing and a charge output.
The timing output was connected to a 25 ps multihit time-to-digital-converter (TDC, model CAEN V1290). The multihit TDC recorded all hits in a 200 ns long search window, i.e. with a certain probability it recorded hits stemming from several cyclotron pulses that were just 45 ns apart (sec. 3). The charge output was amplified and, after amplification, fed into a charge-to-digital converter (QDC, model CAEN V965).
The logic for the trigger was implemented and controlled by a field programmable gate array (FPGA, model CAEN V1495) unit. The FPGA also included programmable scalers that were driven by the TDC single trigger rates and the neutron flux monitors that were provided by the TSL facility (sec. 3). The VME bus data acquisition was administered by a GSI multi-branch system (MBS) Essel00-IEEE device.
Two different trigger conditions were used, depending on the macropulse signal provided by the accelerator:
-
T1
When the beam was on (fig. 3), a trigger was issued when the RF signal from the accelerator coincided with valid time signals on both sides of any of the eight anode readout strips from the MRPC under study. In the logic, the RF signal was delayed in such a way that its start always determined the starting flank of the trigger. The typical rate for trigger condition T1 was 16 kHz.
-
T2
When the beam was off (fig. 3), there were no RF signals from the accelerator, so trigger condition T1 could not be used as it would have prevented any data from being written. Therefore, in the beam-off range, a trigger was issued any time there were valid time signals on both sides of any of the eight anode readout strips from the MRPC under study. The typical rate was 4 kHz.
The data were exported to GSI list mode files and backed up to external servers. They were subsequently converted to Root files for the offline analysis.
5 Data analysis and efficiency determination
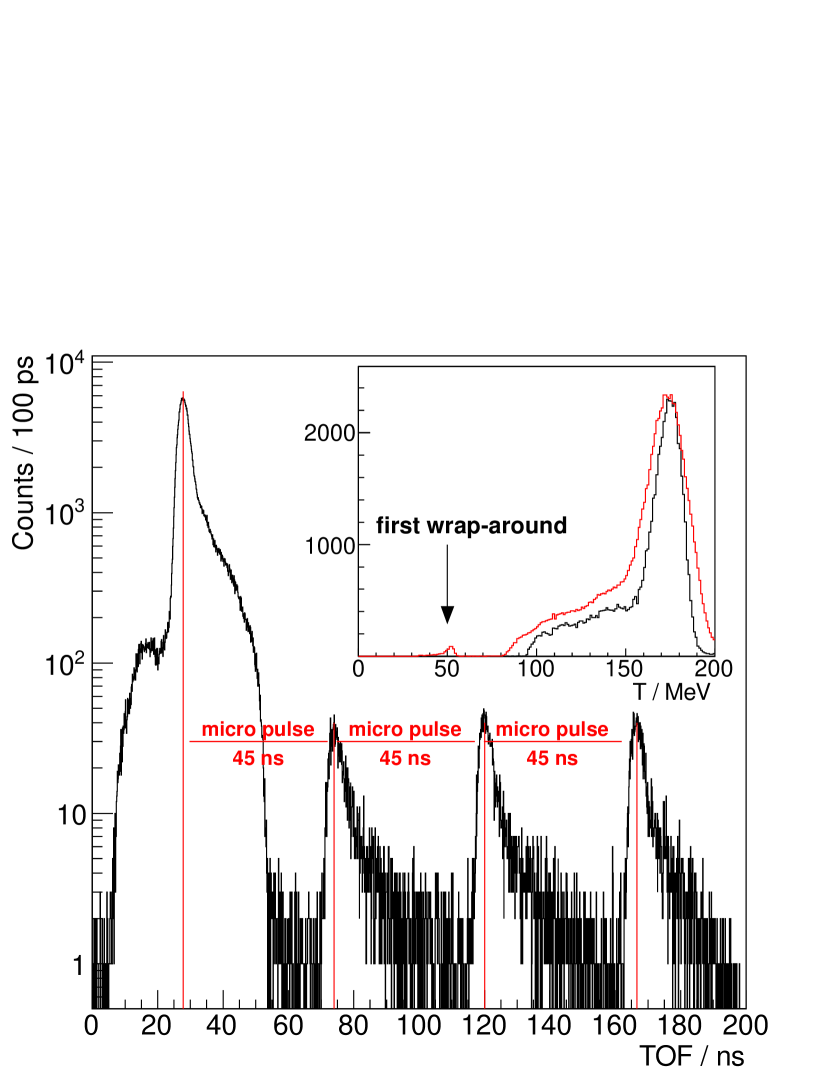
When a valid trigger was issued, in a time window of 200 ns all hits were accepted by the TDC without dead time (fig. 4).
When the beam is on, the time-of-flight (TOF) spectrum starts with a plateau-like structure given by the neutron background that is not correlated to the beam. Subsequently, the typical structure of the TSL quasi-monochromatic neutron beam becomes apparent, given by a strong peak near the nominal neutron energy followed by a shoulder at later times.
The first structure in the time-of-flight spectrum has then been converted to kinetic energy (fig. 4, inset), assuming that the main peak is located at the nominal neutron energy as shown previously Bevilacqua11-NIMA . The observed peak width is about 16 MeV full width at half maximum at 175 MeV, when the latter 200 s of the beam-on range are used for the conversion (fig. 4, thick black curve in the inset). Due to some jitter of the beam with respect to the RF signal issued to the DAQ, the peak is more smeared out, but still very apparent, when the full beam-on range is used (fig. 4, thin red curve in the inset). In the latter spectrum, also the peak due to the subsequent pulse, 45 ns later, is drawn. This so-called first wrap-around is well separated and corresponds to 50 MeV neutron kinetic energy for the present location, sufficiently low in energy that it does not disturb the analysis.
The low-energy shoulder to the left of the quasi-monochromatic peak stops at times equivalent to about 95 MeV kinetic energy, after which only the non-correlated background remains. The lower edge of the spectrum was found to be slightly lower in the MEDLEY experiment, roughly 70-80 MeV Bevilacqua11-NIMA . This discrepancy may be explained by the fact that the efficiency for the MRPC-based detector is expected to rapidly drop at lower energies, due to the thick iron converters optimized for 200-1000 MeV neutron kinetic energy.
The detection efficiency for neutrons was then determined using two different methods explained below.
5.1 Method I: Experimental dead time correction
The first method, hereafter called method I, requires a determination of the effective time the DAQ is blocked after an event is recorded. Due to the large amount of data to be transferred (high-resolution TDC and QDC information for eight strips, usually two to three MRPCs that were placed one after the other in the neutron beam), it can be expected that the dead time is 90%.
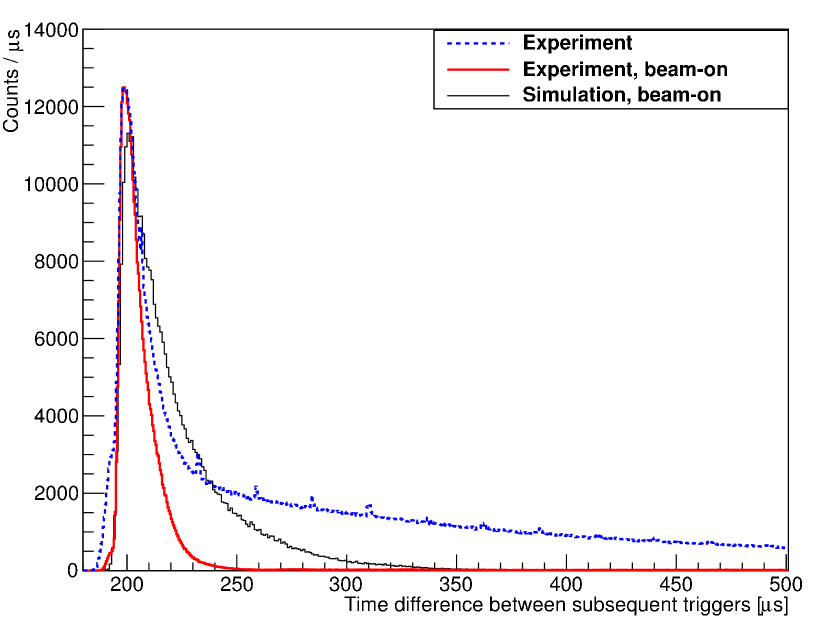
Indeed, a plot of the time difference between consecutive accepted triggers in the beam-on range shows a sharp peak at a time difference of 200 s, with almost no earlier events (fig. 5, blue dotted line). Using a Gaussian fit of this spectrum, a blocking time of 2002 s is obtained and used henceforth. The shoulder to later times is due to background events which have somewhat lower efficiency and rate and therefore higher time difference between triggers. This shoulder is suppressed by requiring both triggers for the time difference to fall within the beam-on range (fig. 5, thick red line).
Subsequently, the observed time spectrum given by the distribution of triggers during each macropulse (thick, black line in fig. 6) is used in order to derive an experimental dead time correction. This is done in the manner described below.
When the beam is on (trigger condition T1), the spectrum shows no regular structure on the microsecond time scale (fig. 6). This is due to the fact that the proton beam intensity of the cyclotron, and with it the neutron beam intensity, varies strongly and without regular structure during each macropulse. The regular 45 ns micropulses are not resolved in this time scale.
When the beam is off (trigger condition T2), a slowly decaying level of background is observed (fig. 6). It has to be noted that the background level in the beam-off region is about 10% higher than in the beam-on region, due to the more liberal trigger condition T2 applied here. Also, the long blocking time of 200 s (see above) leads to a high dead time of the system during the beam-on range, higher than in the beam-off range. These two effects raise the level of observed counts in the beam-off range with respect to the beam-on range.
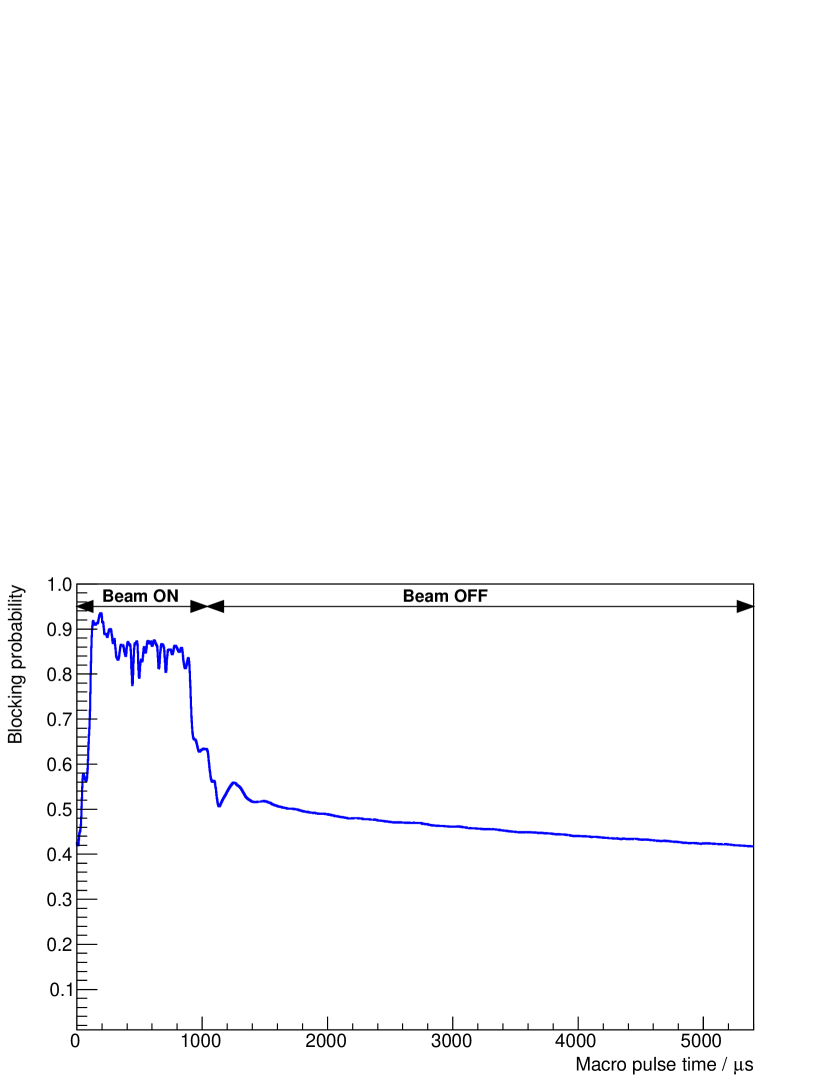
For the experimental dead-time correction, the above derived blocking time of 2002 s is assigned to each observed trigger. In a new time histogram with 1 s/channel dispersion, for each observed trigger the subsequent 200 channels are then incremented by one. In this way, a time spectrum of blocked events is created, reflecting the channel-dependent dead time. The more blocked events are found in one given channel, the higher the expected dead time for this channel. The time spectrum of blocked events is then divided by the total number of macropulses during the experimental run, giving the probability for an event to be blocked as a function of the time inside the macropulse (fig. 7).
This blocking probability, or channel-dependent dead time, is close to 90% for most of the beam-on range. At the beginning of this range, the dead time is lower, because there the blocking is still mainly given by non-correlated events from the previous beam-off range. After the end of the beam-on range, the dead time remains high for some time due to the 200s long blocking time and then drops slowly to about 50%, the value given by the non-correlated events.
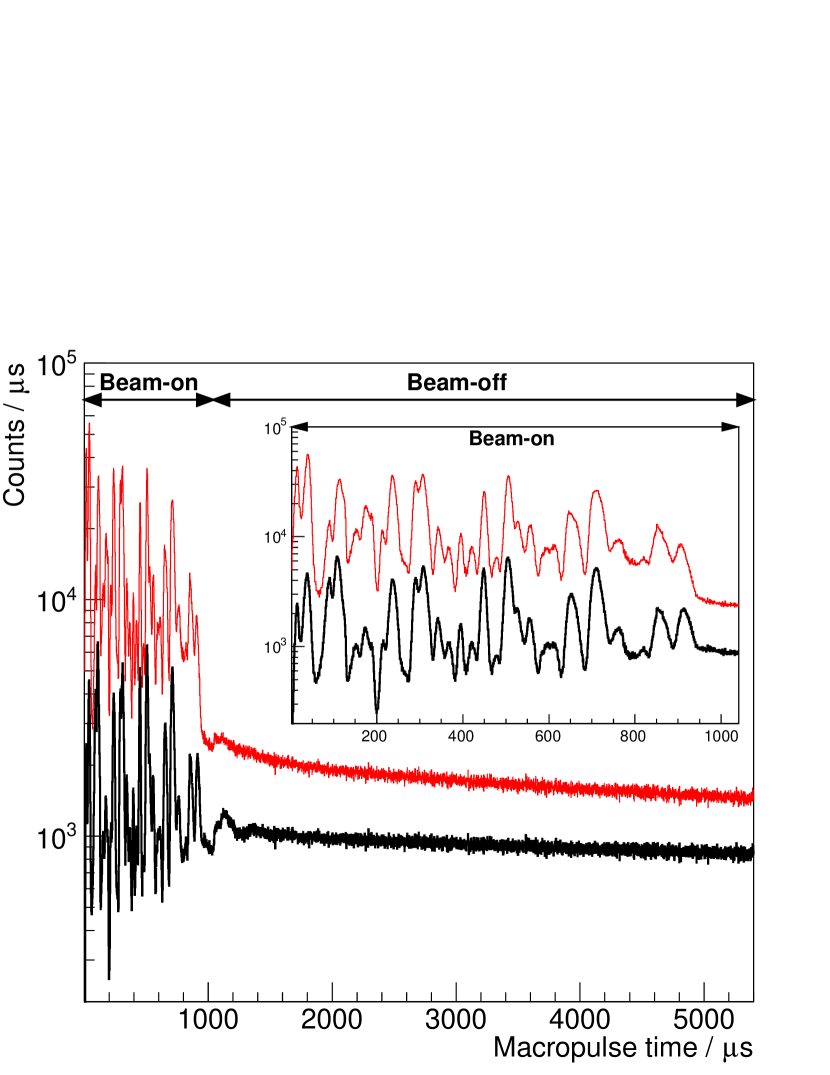
This channel-dependent dead time correction is then applied to the observed macropulse spectrum (fig. 6, thick black line) and results in a dead time-corrected macropulse spectrum (fig. 6, thin red line). From the beam-off range of this dead time-corrected spectrum, it is apparent that there is a background of about 2000 triggers/s that is due to thermalized neutrons and, more importantly, rays emitted during their capture.
The inspection of the macropulse spectrum (fig. 6) between the effective end of neutron emission at 81040 s and the end of the beam-on range at 1040 s shows that this background is also present during the beam-on range, with a level that is only about 10% lower than when the beam is off despite the different trigger condition applied. Therefore, this background is subtracted here using the average trigger rate in the last 40 s of the beam-on range. This background amounts to roughly 20% of the detected counts during the beam-on range. The efficiency is then obtained as follows:
| (1) |
with and the counts and the background in the corrected macropulse spectrum (fig. 6, thin red curve) in the beam-on range, the neutron flux as determined by the neutron monitors (sec. 3), the running time and the area of the neutron beam spot at the position of the MRPC under study.
The efficiency thus determined lies in the 1% range (Table 1). The systematic uncertainty is given by the uncertainty on (10%) and on the dead time determination (10%), altogether 14%.
| Prototype | Method | Efficiency [%] | |
|---|---|---|---|
| HZDR-1b | Experimental, I | 0.99 | 0.100.14 |
| Experimental, II | 1.00 | 0.150.11 | |
| Simulated | 0.90 | 0.01 | |
| HZDR-3c | Experimental, I | 1.00 | 0.100.14 |
| Experimental, II | 1.00 | 0.150.11 | |
| Simulated | 0.90 | 0.01 | |
5.2 Method II: Use of the second hit in the TDC search window
An alternative method that does not depend on the dead time of the system takes advantage of the fact that the TDC accepts several hits within its search window. Therefore, once the DAQ is triggered by one hit in a TDC, all subsequent hits in this and all other channels are recorded without any dead time. So there may be altogether three or four hits in the TDC range (fig. 4).
For the efficiency analysis, one requires a valid hit on both ends of one of the two central strips of the eight-strip MRPC structure and requires in addition that the weighted charge on that strip is higher than on any other strip, in order to exclude cross-talk events. Then, the peak near 75 ns in fig. 4 is integrated, both for the second hit histogram in the strip under study and in the full time spectrum of the other strips, giving . This 75 ns peak is recorded free of dead time, as discussed above. Then, , the integral of the structure from 0-60 ns in fig. 4, is determined, quantifying the number of valid events used in the analysis. The efficiency (II) is then obtained as follows:
| (2) |
with the number of neutrons per micropulse for 185 macropulses per second and 18000 micropulses per macropulse. The results compare well to the data from method I (Table 1). The systematic uncertainty for the efficiency determined by this method is given by the uncertainty on (10%) and the uncertainty in the effective macropulse length (5%), altogether 11%.
6 Monte Carlo simulation
In order to perform a comparison to simulation,
the energy spectrum and the areal size of the neutron beam were coded in Geant4 version 9.4.p01.
The low energy neutron datafile G4NDL3.14 and the HadronPhysicsQGSP_BIC_HP physics list
were used. The neutrons generated secondary particles, which were tracked by the Monte Carlo
engine.
Three parameters were applied: The threshold of the front-end electronics, a parameter characterizing the interplay between the avalanches created by the many primary electrons in the gas, and a third one to handle the space–charge effect. These parameters have been previously fixed by test experiments using an electron beam Elekes13-NIMA and were left untouched when simulating the present neutron beam data.
The simulation gave efficiency values of 0.90% for both HZDR-1b and HZDR-3c prototypes. These numbers are in good agreement with the experimental data, taking into account the systematic uncertainties (Table 1), further corroborating the results of the simulation.
As already reported recently Elekes13-NIMA , the small prototypes tested in the TSL experiment described here were scaled up to detectors of final size 20050 cm2. These very large MRPC structures were the building blocks of a possible high–efficiency array for fast neutron detection. This possible array has a layered structure, each with four MRPC elements Elekes13-NIMA . In a Geant4 simulation, it was shown that the requested efficiency for 200-1000 MeV neutrons can be reached using 50 layers, and that a very good momentum resolution is achievable Elekes13-NIMA . However, due to concerns about the multi-neutron capability, this design was not adopted for the NeuLAND detector, as discussed above in the introduction.
Even though the present detector concept will not be applied at NeuLAND and FAIR, it is of relevance to understand which properties an MRPC-based neutron time of flight detector may have at lower energies, e.g. the radioactive ion beam facilities in operation or under construction at RIKEN (Wako, Japan) and at Michigan State University (MSU, East Lansing, USA).
In order to address this question, the lower energy response (below 200 MeV) of the hypothetical array is investigated here, using the Monte Carlo code and modified ideal input described previously Elekes13-NIMA . This ideal input assumes a breakup reaction 132Sn132-xSn+xn (x=1,2,3,4) at 50, 100, 150, and 200 MeV/A beam energies, respectively. The relative energies between the fragments were set to 100 keV and 1000 keV with a resolution of =0.
Eventfiles with the momenta of the neutrons were produced by the TGenPhaseSpace class of ROOT Root-Webpage .
The neutrons were shot at the array from a distance of 12.5 m,
and 10000 events were processed for each scenario.
For the reactions when the number of emitted neutrons were more than one, the hit identification
algorithm detailed in Ref. Elekes13-NIMA was used.
For the 1n-scenario, an efficiency of 39% was found at 50 MeV/A, and higher values at higher beam energies (Table 2). The simulated resolution in the reconstructed relative energy spectra allows to study the astrophysically relevant range at 100 keV relative energy with satisfactory efficiency and resolution (Table 2).
However, as a consequence of the fact that the efficiency values for one neutron are well below 100%, there is a low detection efficiency for multineutron scenarios. It should be noted here that the efficiency does not significantly improve when adding more layers to the 50-layer setup envisaged here. Rather, the 1n-efficiency is limited by the fact that at the present intermediate energies (50-200 MeV/A) some of the charged particles produced by the neutrons might not reach the active gas layer and stop in the inactive steel and glass volumes of the MRPC structure.
Therefore, an attempt was made to try to compensate the efficiency decrease by removing the steel converters from the array, as has been done previously for the MONA array at MSU Baumann05-NIMA . This change in the setup resulted in an increase of the 1n detection efficiency at 50 MeV/A from 39% to 52%, indicating that already the unavoidable glass volumes absorb many secondary charged particles. At higher beam energies, there was even no significant improvement in detection efficiency at all. This means that for multineutron scenarios, the setup cannot be efficiently used at low energies.
| Efficiency | Resolution | ||
|---|---|---|---|
| (MeV/A) | =100 keV | =1000 keV | |
| 50 | 39% | 11 | 43 |
| 100 | 60% | 16 | 48 |
| 150 | 72% | 16 | 48 |
| 200 | 84% | 23 | 89 |
7 Summary and conclusions
A neutron time of flight detector consisting of passive steel converter and a multigap resistive plate chamber Yakorev11-NIMA was tested using the 175 MeV quasi-monochromatic neutron beam at TSL Uppsala. The detection efficiency was determined to be close to 1% for one detector layer with two independent methods: The first one based on an experimental dead time correction, and the second one based on the second hit in multihit time-to-digital converters.
The data are found to be in excellent agreement with a Monte Carlo simulation. This simulation had previously been developed and validated using a 31 MeV electron beam Elekes13-NIMA , and the present data offer important corroboration of the correctness of the simulation.
The Monte Carlo simulation has then been used in order to derive the relevant characteristics of a hypothetical neutron-detector array made of 50 layers of the present device. It was found that such a neutron detector array would work very well for scenarios where one neutron is to be detected, but only in a limited way for scenarios with several neutrons.
Acknowledgments
This work was supported in part by BMBF 06DR134I, BMBF 06KY7153, GSI F&E (DR-ZUBE), NupNET NEDENSAA (BMBF 05 P 12 ODNUG), the European Union (FP6-EFNUDAT), the Helmholtz Association Detector Technology and Systems Platform (DTSP), and TÁMOP 4.2.4.A/2-11-1-2012-0001.
References
- (1) M. Wiescher, F. Käppeler, and K. Langanke, Annu. Rev. Astron. Astroph. 50, 165 (2012).
- (2) T. Aumann, Prog. Part. Nucl. Phys. 59, 3 (2007).
- (3) T. Blaich et al., Nucl. Inst. Meth. A 314, 136 (1992).
- (4) K. Boretzky et al., Phys. Rev. C 68, 024317 (2003).
- (5) T. Baumann et al., Nucl. Inst. Meth. A 543, 517 (2005).
- (6) T. Kobayashi et al., Nucl. Inst. Meth. B 317, 294 (2013).
- (7) L. Karsch, A. Böhm, K.-T. Brinkmann, L. Demirörs, and M. Pfuff, Nucl. Inst. Meth. A 460, 362 (2001).
- (8) NeuLAND Technical Design Report, http://www.fair-center.de/fileadmin/fair/experiments/NUSTAR/Pdf/TDRs/NeuLAND-TDR-Web.pdf, 2013.
- (9) T. Aumann et al., NeuLAND - Concepts for the Detection of Fast Neutrons, Scientific Report No. PHN-NUSTAR-NR-18 (GSI, Darmstadt, Germany, 2010), .
- (10) Z. Elekes et al., Nucl. Inst. Meth. A 701, 86 (2013).
- (11) C. Caesar et al., Nucl. Inst. Meth. A 661, S145 (2012).
- (12) R. Santonico and R. Cardarelli, Nucl. Inst. Meth. 187, 377 (1981).
- (13) V. Peskov, PoS(RPC2012)083, http://pos.sissa.it/archive/conferences/159/083/ RPC2012_083.pdf (2013).
- (14) S. An et al., Nucl. Inst. Meth. A 594, 39 (2008).
- (15) D. Yakorev et al., Nucl. Inst. Meth. A 654, 79 (2011).
- (16) A. Prokofiev et al., Radiat. Prot. Dosimetry 126, 18 (2007).
- (17) R. Bevilacqua et al., Nucl. Inst. Meth. A 646, 100 (2011).
- (18) A. V. Prokofiev et al., Uppsala University, The Svedberg Laboratory Report No. TSL/ISV-99-0203, 1999 (unpublished).
- (19) M. Ciobanu, N. Hermann, K. Hildenbrand, M. Kiš, and A. Schüttauf, IEEE Trans. Nucl. Sc. 54, 1201 (2007).
- (20) M. Ciobanu, N. Hermann, K. Hildenbrand, M. Kiš, and A. Schüttauf, IEEE Nuclear Science Symposium Conference Record N30-18, 2018 (2008).
- (21) H. Essel and N. Kurz, IEEE Transactions on Nuclear Science 47, 337 (2000).
- (22) http://root.cern.ch.