ALIGNMENTS OF THE GALAXIES IN AND AROUND THE VIRGO CLUSTER WITH THE LOCAL VELOCITY SHEAR
Abstract
An observational evidence is presented for the alignment between the cosmic sheet and the principal axis of the velocity shear field at the position of the Virgo cluster. The galaxies in and around the Virgo cluster from the Extended Virgo Cluster Catalog recently constructed by Kim et al. are used to determine the direction of the local sheet. The peculiar velocity field reconstructed from the Sloan Digital Sky Survey Data Release 7 is analyzed to estimate the local velocity shear tensor at the Virgo center. Showing first that the minor principal axis of the local velocity shear tensor is almost parallel to the line of sight direction, we detect a clear signal of alignment between the positions of the Virgo satellites and the intermediate principal axis of the local velocity shear projected onto the plane of the sky. Furthermore, the dwarf satellites are found to appear more strongly aligned than the normal counterparts, which is interpreted as indication of the following: (i) The normal and the dwarf satellites fall in the Virgo cluster preferentially along the local filament and the local sheet, respectively. (ii) The local filament is aligned with the minor principal axis of the local velocity shear while the local sheet is in parallel to the plane spanned by the minor and the intermediate principal axes. Our result is consistent with the recent numerical claim that the velocity shear is a good tracer of the cosmic web.
1 INTRODUCTION
According to the density peak formalism (Bardeen et al., 1986), the formation of a galaxy cluster occurs at a rarely high peak of the linear density field where the three eigenvalues of the density Hessian have almost identical values. Since the ellipticity and the prolateness of an initial density region are expressed in terms of the differences among the three eigenvalues of its density Hessian, the geometrical shape of a proto-cluster located at a high density peak is expected to be quite spherically symmetric. Moreover, Bernardeau (1994) have analytically showed with the help of the linear perturbation theory that the collapse process of a rare density peak should follow well the spherical dynamics at first order. Several numerical experiments supported this analytic prediction: For instance, the values of the linear density contrast in the proto-cluster regions were found by Robertson et al. (2009) to converge to the spherical threshold value predicted by the spherical dynamical model (e.g., Peebles, 1980). The mass function of cluster-size dark halos determined from -body simulations showed good agreements with the analytic prediction based on the spherical excursion set theory (Maggiore & Riotto, 2010).
Meanwhile, the optical, the X-ray and the Sunyaev-Zel’dovich (SZ) effect observations of the galaxy clusters have demonstrated for long that the shapes of the galaxy clusters must be far from being spherically symmetric (e.g., Binggeli, 1982; Fabricant et al., 1984; Buote & Canizares, 1996; Kawahara, 2010; Sayers et al., 2011), which was also confirmed by the weak lensing analyses of the matter density profiles of the galaxy clusters (e.g., Evans & Bridle, 2009; Oguri et al., 2010). The non spherical shapes of the rarest bound objects have also been noted by -body experiments. For instance, very recently, Despali et al. (2014) employed an ellipsoidal halo finder algorithm to a high-resolution -body simulation and revealed that the more massive a dark halo is, the less spherical its shape is. For a comprehensive review on the non-spherical shapes of galaxy clusters, see Limousin et al. (2013).
To explain how the galaxy clusters develop non-spherical shapes even though they originate from the spherically symmetric proto-cluster sites, the ”anisotropic merging scenario” has been proposed and prevalently accepted (e.g., West et al., 1991; van Haarlem & van de Weygaert, 1993; West et al., 1995), according to which the preferential occurrence of the merging and infall of satellite galaxies along the ”cosmic web” (Bond et al., 1996) are responsible for the nonspherical shapes of the galaxy clusters. This anisotropic merging scenario makes three key predictions. First, the cluster satellites tend to be aligned with the directions of the cosmic web that interconnects the clusters to the surrounding large-scale structure (Aragón-Calvo et al., 2007a; Hahn et al., 2007b; Zhang et al., 2009; Codis et al., 2012; Forero-Romero et al., 2014). Second, the satellite galaxies around the dynamically younger clusters are more strongly aligned with the cosmic web than the relaxed ones. Third, those clusters located in the filament or sheet environments have more elongated shapes than those in the knot or void environments since the merging of their satellite galaxies occurs more anisotropically in the filament and sheet environments.
The alignments between the shapes of dark matter halos and the directions of the cosmic web induced by the anisotoropic merging have been investigated by many numerical studies (e.g., Aragón-Calvo et al., 2007a; Hahn et al., 2007b; Zhang et al., 2009; Codis et al., 2012; Forero-Romero et al., 2014). However, these investigations had one difficulty that there is no unique web-classification scheme. A variety of algorithms have been developed to classify the cosmic web, each of which has its own advantage and disadvantage: a method based on the Minimal Spanning Tree algorithm (Colberg, 2007), the Skeleton algorithm (Novikov et al., 2006; Sousbie et al., 2008), the Multiscale Morphology Filter algorithm (Aragón-Calvo et al., 2007b), the schemes based on the tidal shear (e.g., Hahn et al., 2007a; Forero-Romero et al., 2009), density Hessian (e.g., Bond et al., 2010), and velocity shear (Hoffman et al., 2012; Libeskind et al., 2013a), the SpineWeb method (Aragón-Calvo et al., 2010), the NEXUS algorithm (Cautun et al., 2013) and so on. For a concise review of those various web-classification algorithms, see Cautun et al. (2013).
Here, we employ the web-classification scheme based on the velocity shear field proposed by Hoffman et al. (2012). The knots, filaments, and sheets classified from -body simulations according to their scheme were shown to resemble very well the zero, one and two dimensional structures, respectively. In the subsequent works, Libeskind et al. (2013a) applied the web-classification of Hoffman et al. (2012) to their -body data and found that there exist strong alignments between the most elongated axes of the triaxial dark matter halos and the minor principal axes of the velocity shear tensors. The -body results obtained by Tempel et al. (2014) also revealed that the minor principal axes of the velocity shear field trace well the directions of the large-scale filaments.
Here, our goal is to observationally test the numerical claim that the directions of the cosmic web along which the satellite galaxies fall into the clusters are aligned with the principal axes of the local velocity shear. This observational test will be optimized by using a dynamically young cluster with a conspicuously elongated shape located in a filament or a sheet environment. In this respect, the nearby Virgo cluster is an appealing test-bed since it has yet to reach a dynamical equilibrium (e.g., Binggeli et al., 1987), having a conspicuously non-spherical shape elongated along the direction almost parallel to the line of the sight (e.g., West & Blakeslee, 2000; Gavazzi et al., 1999; Mei et al., 2007, and references therein), located in the Local Supercluster (see Tully, 1982, and references therein). The previous works which studied the three dimensional shapes of the Virgo cluster and its alignments with the local filaments focused largely on the central bright galaxies within the Virgo’s virial radius. Very recently, Kim et al. (2014) constructed an unprecedentedly extensive catalog which contains even faint dwarf galaxies located in the regions well outside the virial radius, which must be very useful for the study of the connection between the spatial distribution of the Virgo satellites and the local velocity shear field.
The outlines of the upcoming sections are as follows. In section 2 we explain how the velocity shear tensor at the Virgo center is determined from the peculiar velocity field reconstructed from the Sloan Digital Sky Survey Data Release 7 (SDSS DR7) (Abazajian et al., 2009). In section 3 we measure the spatial distributions of the galaxies in and around the Virgo cluster and investigate their alignments with the principal axes of the local velocity tensors. In section 4 we summarize the result and discuss its physical implication.
2 RECONSTRUCTION OF THE VELOCITY SHEAR FIELDS
Hoffman et al. (2012) defined the normalized velocity shear field by
| (1) |
where is the comoving peculiar velocity vector smoothed on a scale of and is the Hubble constant. Letting the three eigenvalues of be with , they classified the regions with as the knot environments, the regions with as the filament environments, the regions with as the sheet environments and the regions with as the void environments, where is an arbitrary threshold. Hoffman et al. (2012) empirically determined this threshold value to be which yielded the best visualisation of the geometrical characteristics of the four environments at for a flat CDM ( dominated with cold dark matter) cosmology. Note that this threshold value is likely to depend on the background cosmology as well as on the redshift.
As mentioned in Hoffman et al. (2012), on the linear scale where the peculiar velocity field is curl free, the velocity shear field in Equation (1) is identical to the tidal shear field defined as the second derivative of the gravitational potential field. Whereas, on the nonlinear scale where the peculiar velocity field is no longer curl free, the velocity shear field deviates from the tidal shear field. Very recently, however, Libeskind et al. (2014) found from a -body experiment that the directions of the principal axes of the velocity shear field are insensitive to the smooting scales, showing only slight changes when varies from the nonlinear scale Mpc to the linear scale of Mpc. Their numerical result implied that the directions of the principal axes of the real velocity shear field could be well approximated by those of the velocity shear field linearly reconstructed under the assumption that the peculiar velocity field is curl free.
To determine the local velocity shear tensor at the position of the Virgo cluster by Equation (1), we use the peculiar velocity field that Wang et al. (2012) have linearly reconstructed on a cubic volume of Mpc3 by applying the halo-tracing algorithm developed by Wang et al. (2009) to the New-York University Value-Added Galaxy Catalog (Blanton et al., 2005) from SDSS DR7 (Abazajian et al., 2009). Dividing the volume into a total of cubic grids each of which has a linear size of Mpc, Wang et al. (2012) statistically estimated the expectation value of the peculiar velocity vector on each grid, assuming a WMAP5 cosmology (Dunkley et al., 2009). For a detailed description of how the peculiar velocity field was reconstructed from the SDSS DR7, see Wang et al. (2012).
Since the peculiar velocities on those grids near the limits of the SDSS DR7 volume are likely to have been contaminated by the boundary effect (Wang et al., 2009, 2012), we consider only the innermost subvolume of Mpc3 consisting of grids located well inside the boundary of the SDSS DR7 volume for the reconstruction of the velocity shear field. The Cartesian coordinates of the selected grids in the equatorial reference frame are in the range of .
Performing the Fourier transformation of the peculiar velocity field by employing the Fast Fourier Transformation (FFT) method (Press et al., 1992), we obtain its Fourier amplitude field, . Since the peculiar velocity field reconstructed by Wang et al. (2012) is an unsmoothed version, we apply a Gaussian window function with a filtering radius of Mpc to . The Fourier amplitude of the velocity shear field smoothed on a scale of , , can be obtained as
| (2) |
Performing the inverse Fourier transform of with the help of the inverse FFT method (Press et al., 1992), we pull it off reconstructing the smoothed velocity shear field, on the subvolume.
The equatorial Cartesian coordinates of the Virgo center that almost coincides with the galaxy M87 have been found to be Mpc, Mpc, Mpc (e.g., Mei et al., 2007). Locating the grid nearest to the position of the Virgo center in the subvolume and calling it the Virgo grid, we find the local velocity shear tensor at the Virgo grid and diagonalize it via the similarity transformation to find its three eigenvectors and the corresponding eigenvalues. The major, the intermediate, and the minor principal axis of the local velocity tensor estimated on the Virgo grid is determined as its eigenvectors corresponding to the largest, the second to the largest and the smallest eigenvalue, respectively. It is found that two eigenvalues are positive while the smallest one is negative at the Virgo grid, which indicates the Virgo cluster is located in the filamentary environment according to the web-classfication scheme of Hahn et al. (2007a). Figure 1 plots the contours of the smallest (left panel), second to the largest (middle panel), and largest eigenvalue (right panel) of the velocity shear field smoothed on the scale of Mpc in the projected - plane.
We measure the orientation angles of the three principal axes of the local velocity shear tensor at the Virgo grid relative to the line of sight direction to the Virgo center and find the major, the intermediate, and the minor principal axis to be inclined , and from the direction of the sight line to the Virgo center, respectively. This result explicitly shows that the minor principal axis of the local velocity shear at the Virgo grid is well aligned with the line of sight direction while the other two principal axes tend to lie in the plane of the sky perpendicular to the sight line. Given the observational evidence found by West & Blakeslee (2000) that the elongated axis of the spatial distribution of the central bright galaxies in the Virgo cluster points almost toward the line of the sight direction (see also Gavazzi et al., 1999; Mei et al., 2007), this result indicates that the longest axis of the Virgo shape determined by the spatial distribution of the central bright galaxies is well aligned with the minor principal axis of the local velocity shear.
Provided that the spatial distribution of the central bright galaxies in the Virgo cluster is indeed elongated with the local filament as claimed by West & Blakeslee (2000), this result observationally supports the numerical predictions of Libeskind et al. (2013a) and Tempel et al. (2014) that the cosmic filaments are in the direction of the minor principal axes of the velocity shear fields. Yet, it is not guaranteed that the elongated axis of the spatial distribution of the central bright galaxies located within the virial radius of the Virgo cluster represents the direction of the local filament. It is definitely necessary to consider more galaxies in and around the Virgo cluster for the determination of the local direction of the cosmic web that connects the Virgo cluster to the surrounding large scale structure and for the measurement of its correlation with the principal axes of the local velocity shear.
3 ANISOTROPIC DISTRIBUTION OF THE VIRGO SATELLITES
To find an observational evidence for the alignments between the spatial distributions of the galaxies in and around the Virgo cluster and the principal axes of the local velocity shear tensor determined in section 2, we utilize the Extended Virgo Cluster Catalog (EVCC) constructed by Kim et al. (2014) which contains a total of galaxies with the -magnitudes less than mag corresponding to = mag at the Virgo cluster distance of 16.5 Mpc (i.e., a distance modulus = 31.1 mag) (Jerjen et al., 2004; Mei et al., 2007). These galaxies are located in the regions of square degree centered around the Virgo cluster. Information on the spectroscopic properties of the EVCC galaxies was extracted mainly from the SDSS DR7 and also from the NASA Extragalactic Database (NED). For a detailed description of the EVCC, see Kim et al. (2014).
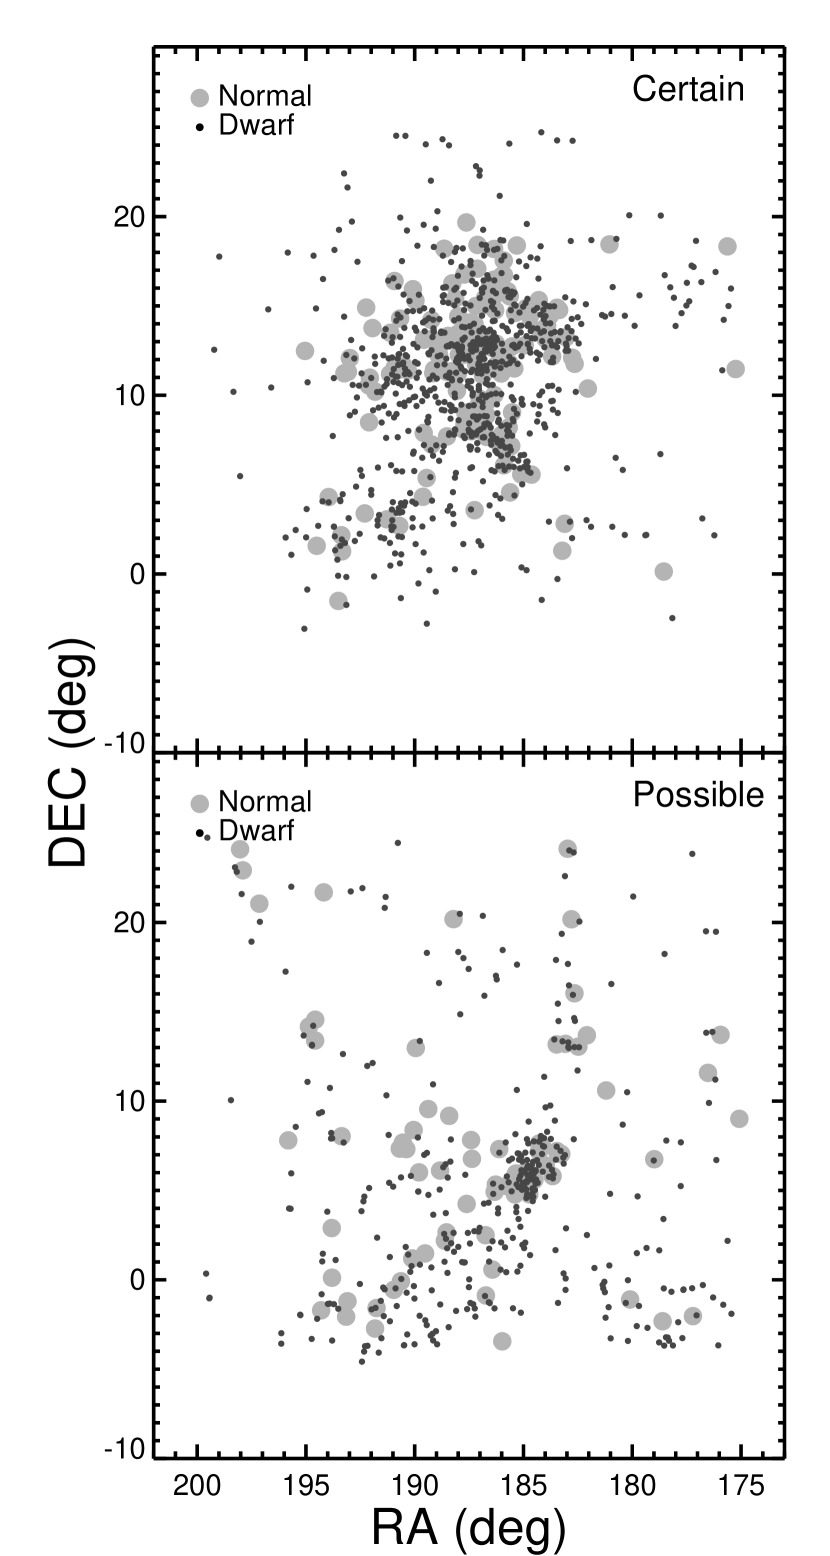
The EVCC galaxies were divided by Kim et al. (2014) into the certain and the possible members of the Virgo cluster according to their heliocentric radial velocities, , as a function of the separation distance from the Virgo center in the plane of the sky where denotes the unit vector in the radial direction. The certain members are the dynamically relaxed central galaxies of the Virgo cluster that satisfy the criterion of where denotes the threshold of the magnitude of the infall velocity at prescribed by the cluster infall model (Praton & Schneider, 1994). Whereas, the possible members in the EVCC which do not meet the above criterion could be the satellite galaxies around the Virgo cluster, being located in the cosmic web that encompasses the Virgo and the surrounding large scale structures. The EVCC includes a total of () certain (possible) members (Kim et al., 2014). The top and bottom panel of Figure 2 shows the spatial distributions of the certain and possible members, respectively, in the equatorial coordinate frame (right ascension and declination). In each panel, the black small (grey large) dots correspond to the dwarf (normal) EVCC galaxies.
The three dimensional positions of the EVCC galaxies relative to the Virgo center are hard to measure accurately due to the presence of the nonlinear redshift distortion effect (see Hamilton, 1998, for a review). To avoid the uncertainty caused by the inaccurate measurements of the positions of the Virgo satellites, we project the position vectors of the EVCC galaxies and the principal axes of the local velocity tensor reconstructed in section 2 onto the plane of the sky and measure the alignments between the projected directions. Although this process of the projection is expected to diminish the strength of an alignment signal (if any), this is the most secure way to avoid the effect of the nonlinear redshift distortion.
Using the equatorial coordinates, we first measure the position vector of each EVCC galaxy, , relative to the Virgo center, M87, under the assumption that it is at the same distances from us as the Virgo center. For the determination of the galaxy positions, we assume a WMAP5 cosmology (Dunkley et al., 2009) with , , , to be consistent with Wang et al. (2012). The two dimensional position vector, , of each EVCC galaxy is then obtained as . In a similar manner, we also project the three principal axes of the local velocity tensor at the Virgo grid onto the plane of the sky. Let and denote the projected major, intermediate, and minor principal axes of the local velocity shear tensor, respectively. In section 2, it has been already found that the minor principal axis of the local velocity shear is well aligned with . Thus, the projection would not affect much the directions of the major and the intermediate axes of the local velocity shear while the true direction of the minor principal axis must be completely lost by the projection.
We measure the angle, , between the projected principal axes of the local velocity shear tensor and the projected position vector of each EVCC galaxy as
| (3) |
where the range of is restricted to since what matters is only the relative angles between the two directions rather than their actual orientations. Binning the values of and counting the numbers of the EVCC galaxies, we determine the probability density distribution of the alignment angle as where represents the bin size, is the total number of the EVCC galaxies, and represents the numbers of the EVCC galaxies whose alignment angles lie in the differential range of . We also determine separately for the certain members and for the possible members. If the projected positions of the EVCC galaxies are preferentially aligned with (perpendicular to) one of the principal axes of the local velocity shear, then the probability density distribution, , will decrease (increase) as increases. If no alignment, then will have a constant value of over the whole range of .
Figure 3 shows with the Poisson errors versus in unit of degree for the case of all, certain, and possible members of the Virgo cluster in the top, middle, and bottom panel, respectively. The left, middle, and right panel corresponds to the alignment angles with the major, intermediate, and minor principal axis of the local velocity shear, respectively. In each panel, the dotted line represents the uniform distribution of , corresponding to the case of no alignment. The error, , of each -bin is calculated as one standard deviation of the Poisson variable as where represents the number of the EVCC galaxies belonging to each -bin. As can be seen, the projected two dimensional positions of the EVCC galaxies have a strong tendency of being aligned with (perpendicular to) the projected intermediate (major) principal axis of the local velocity tensor.
Since both of the real three dimensional major and intermediate principal axes of the local velocity tensor almost lie in the plane of the sky, the projected major and intermediate principal axes in the plane of the sky are orthogonal to each other. Therefore, the probability density distributions of the middle panels are in fact the same as of the left panels. The right panels of Figure 3 show that there is no signal of alignment between the EVCC galaxies and the projected minor principal axis, which just reflects the fact that the real direction of the minor principal axis is completely lost when projected. Henceforth, what Figure 3 essentially tells us is that the positions of the EVCC galaxies tend to be aligned with the intermediate principal axis of the local tidal shear.
Figure 3 also reveals that the possible members of the Virgo cluster are much more strongly aligned with the intermediate principal axis of the local velocity shear than the certain members. Obviously the relaxation process inside the Virgo cluster must have an effect of erasing the memory of the member galaxies about the anisotropic merging along the principal axes of the local velocity shear. Expecting that the possible members in the EVCC are located in the cosmic filament that interconnects the Virgo cluster with the surrounding matter distribution, the strong signal of the alignment detected in the bottom panel of Figure 3 provides an observational evidence for the recent claim of Libeskind et al. (2013a) and Tempel et al. (2014) that the velocity shear field is a good tracer of the cosmic web.
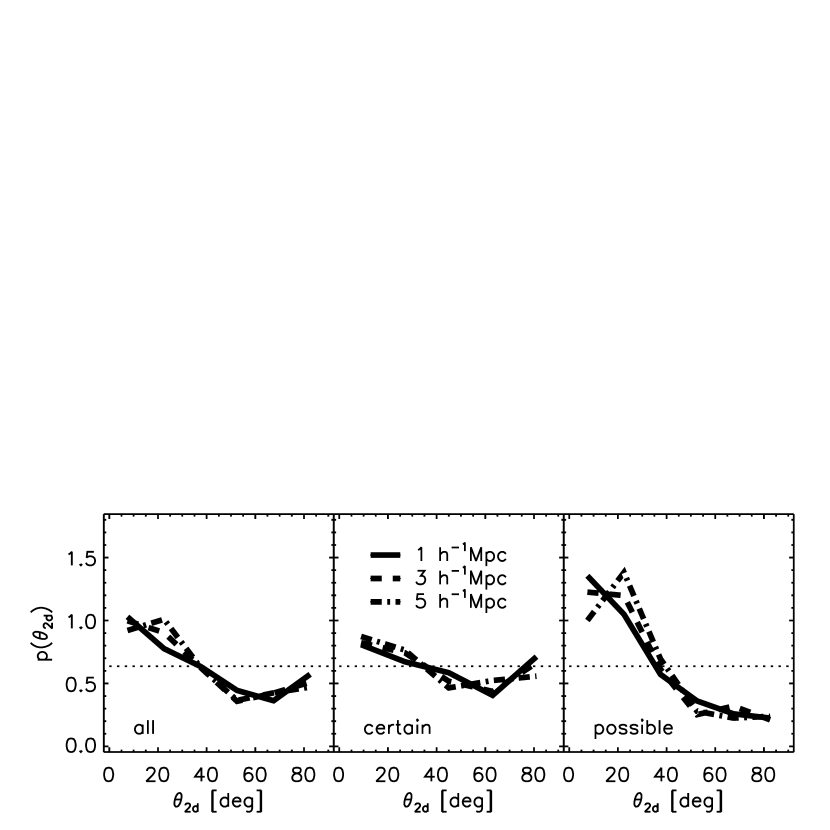
We investigate how the strength of the alignment signal changes with the smoothing scale, by repeating the determination of for three different cases of . Figure 4 show the probability density distribution of the alignment angles between the intermediate principal axes of the velocity shear tensor and the position vectors of all, certain, and possible members of the EVCC in the left, middle, and right panel, respectively. In each panel, the solid, dashed, and dot-dashed line corresponds to the case of and Mpc, respectively. As can be seen, no evolution of the alignment signal with the smoothing scale has been found, which is consistent with the recent numerical finding of Libeskind et al. (2014) that the directions of the principal axes of the the velocity shear field are quite robust against the change of the smoothing scale.
To see if and how the strength of the anti-alignment signal varies with the masses of the EVCC galaxies, we determine for the low-mass dwarf and for the high-mass normal galaxies separately. A total of galaxies in the subsample of the certain members are found to be classified as dwarfs while the subsample of the possible members contains a total of dwarf galaxies (see Kim et al., 2014, for the details of the morphology classification). In each panel of Figure 5, the solid and the dashed line corresponds to for the dwarf and for the normal galaxies, respectively. The smoothing scale for the local velocity tensor is reset again at Mpc. As can be seen, for the case of the certain members (top panel) there is almost no difference in the strength of the alignment signal between the dwarf and the normal galaxies. Whereas, for the case of the possible members (bottom panel) the dwarf galaxies yield much stronger signal of alignment than the normal galaxies.
Our physical explanation for this apparent mass-dependence of the alignment strength is as follows. For the case of the normal galaxies, the events of their merging into the Virgo cluster occur preferentially along the local filament. Provided that the local filament is aligned with the minor principal axis of the local velocity shear parallel to the line of sight direction, the alignment tendency of the normal satellites with the minor principal axis of the local velocity shear tensor would be significantly lost by the projection onto the plane of sky. Whereas, for the case of the dwarf galaxies, the merging events occur in the local sheet that encompasses the Virgo cluster and the local filament. Provided that the local sheet is parallel to the plane spanned by the intermediate and minor principal axis of the local velocity shear, the projected positions of the dwarf satellites would still appear to be strongly aligned with the intermediate principal axis of the local velocity shear tensor.
4 SUMMARY AND CONCLUSION
In the field of the large scale structure of the universe, one of the most urgent issues to address is how to trace and quantify the cosmic web whose ubiquity and coherence has been noted for long ever since Bond et al. (1996) attempted to explain its presence in the context of the CDM paradigm. In the light of the works of Hoffman et al. (2012), Libeskind et al. (2012), and Libeskind et al. (2013a) which proposed a web-classification scheme based on the velocity shear tensor and demonstrated by -body simulations that the principal axes of the velocity shear tensors are well aligned with the directions of the cosmic web, we have performed an observational test of their numerical prediction by measuring the anisotropic spatial distributions of the galaxies in and around the Virgo cluster in the principal frame of the local velocity shear tensor.
The Virgo cluster has been chosen as an optimal target for this observational test because of its proximity and young dynamical state. The positions of the galaxies in and around the Virgo cluster have been extracted from the EVCC (Kim et al., 2014) and the local velocity tensor at the Virgo center has been estimated by analyzing the peculiar velocity field reconstructed from the SDSS DR7 (Wang et al., 2012). To avoid the contamination caused by the nonlinear redshift distortion effect on the positions of the EVCC galaxies, the measurements have been made in the projected two dimensional plane of the sky orthogonal to the line of sight direction to the Virgo center. The direction of the minor principal axis of the local velocity shear has turned out to be completely lost by the projection since it has been found to be almost perpendicular to the plane of the sky, while the major and the intermediate principal axes have been found to be only slightly modified by the projection onto the plane of the sky.
A clear signal of alignment has been detected between the projected positions of the EVCC galaxies and the projected intermediate principal axis of the local velocity shear. The signal has been found to be robust against the change of the smoothing scale from to Mpc, which is consistent with the recent numerical result of Libeskind et al. (2014) that the directions of the principal axes of the velocity shear field are insensitive to the smoothing scales. Those galaxies classified by Kim et al. (2014) as possible members according to their radial velocities have been found to be more strongly aligned than those galaxies classified as certain members. This result indicates that after merging into a host cluster the positions of the satellites become randomized relative to the principal frame of the local velocity shear, providing an observational support for the previous numerical result based on -body simulations that the subhalos fallen earlier tend to be less strongly aligned with the elongated directions of the shapes of the host halos than those just fallen (e.g., Wang et al., 2014, and references therein).
Interestingly, the dwarf satellites around the Virgo cluster have been shown to be more strongly aligned with the principal axis of the local velocity shear tensor than the normal counterparts. Our interpretation is that this difference in the alignment strength between the normal and the dwarf satellites stems from the difference in the infall direction between them. The normal galaxies merge into the Virgo cluster preferentially along the local filament, while the infall of dwarf galaxies occurs in the local sheet that encompasses the Virgo cluster and the local filament. Supposing that the local filament is aligned with the minor principal axis of the local velocity shear tensor, the normal satellites are expected to be aligned with the minor principal axis parallel to the line of sight direction, so that the projection would diminish their alignment tendency. Whereas, the projection would not affect much the alignment tendency of the dwarf satellites with the intermediate axis of the local velocity shear tensor provided that the local sheet is parallel to the plane spanned by the minor and intermediate principal axis perpendicular to the line of sight direction. Henceforth, our conclusion is that the local sheet where the dwarf satellites of the Virgo cluster reside is well aligned with the principal directions of the local velocity shear , supporting the recent numerical claim of Libeskind et al. (2013a) and Tempel et al. (2014) that the velocity shear field is a good tracer of the cosmic web.
In the current work, we have used the linearly reconstructed velocity shear field to investigate the alignments between the Virgo satellites and their principal directions. Since the linear reconstruction assumes that the velocity shear field is curl free, our analysis has completely neglected the presence of the vorticity. However, a couple of recent literatures proved that the vorticity effect on the cosmic web alignments becomes important in the nonlinear regime (Libeskind et al., 2013b, 2014). We speculate that the central member galaxies of the Virgo cluster which have shown only weak signal of the alignment with the intermediate principal axis of the velocity shear field in the current work might be aligned with the direction of the vorticity. To observationally test this speculation, the nonlinear reconstruction of the peculiar velocity field will be required, which is beyond the scope of this paper.
It will be also interesting to explore how the galaxies in and around the Coma cluster are aligned with the principal axes of its local velocity shear tensor and to compare the result with our current result. The Coma cluster located in the filamentary Coma Supercluster (Gregory & Thompson, 1978) has been known to be in a dynamically unrelaxed state like the Virgo cluster (e.g., Briel et al., 1992). However, an observation has shown that not only the galaxies in the Coma cluster but also the galaxies in the Coma Supercluster show no preferential directions in their spatial orientation (Torlina et al., 2007). It might be due to a degeneracy among the three principal axes of the velocity shear tensor at the Coma site. We plan to work on these interesting topics and hope to report the results in the future.
References
- Abazajian et al. (2009) Abazajian, K. N., Adelman-McCarthy, J. K., Agüeros, M. A., et al. 2009, ApJS, 182, 543
- Aragón-Calvo et al. (2007a) Aragón-Calvo, M. A., van de Weygaert, R., Jones, B. J. T., & van der Hulst, J. M. 2007, ApJ, 655, L5
- Aragón-Calvo et al. (2007b) Aragón-Calvo, M. A., Jones, B. J. T., van de Weygaert, R., & van der Hulst, J. M. 2007, A&A, 474, 315
- Aragón-Calvo et al. (2010) Aragón-Calvo, M. A., Platen, E., van de Weygaert, R., & Szalay, A. S. 2010, ApJ, 723, 364
- Bardeen et al. (1986) Bardeen, J. M., Bond, J. R., Kaiser, N., & Szalay, A. S. 1986, ApJ, 304, 15
- Bernardeau (1994) Bernardeau, F. 1994, ApJ, 427, 51
- Binggeli (1982) Binggeli, B. 1982, A&A, 107, 338
- Binggeli et al. (1987) Binggeli, B., Tammann, G. A., & Sandage, A. 1987, AJ, 94, 251
- Blanton et al. (2005) Blanton, M. R. et al. 2005, AJ, 129, 2562
- Bond et al. (1996) Bond, J. R., Kofman, L., & Pogosyan, D. 1996, Nature, 380, 603
- Bond et al. (2010) Bond, N. A., Strauss, M. A., & Cen, R. 2010, MNRAS, 406, 1609
- Briel et al. (1992) Briel, U. G., Henry, J. P., & Boehringer, H. 1992, A&A, 259, L31
- Buote & Canizares (1996) Buote, D. A., & Canizares, C. R. 1996, ApJ, 457, 565
- Cautun et al. (2013) Cautun, M., van de Weygaert, R., & Jones, B. J. T. 2013, MNRAS, 429, 1286
- Codis et al. (2012) Codis, S., Pichon, C., Devriendt, J., et al. 2012, MNRAS, 427, 3320
- Colberg (2007) Colberg, J. M. 2007, MNRAS, 375, 337
- Despali et al. (2014) Despali, G., Giocoli, C., & Tormen, G. 2014, arXiv:1404.6527
- Dunkley et al. (2009) Dunkley, J., Komatsu, E., Nolta, M. R., et al. 2009, ApJS, 180, 306
- Evans & Bridle (2009) Evans, A. K. D., & Bridle, S. 2009, ApJ, 695, 1446
- Fabricant et al. (1984) Fabricant, D., Rybicki, G., & Gorenstein, P. 1984, ApJ, 286, 186
- Forero-Romero et al. (2009) Forero-Romero, J. E., Hoffman, Y., Gottlöber, S., Klypin, A., & Yepes, G. 2009, MNRAS, 396, 1815
- Forero-Romero et al. (2014) Forero-Romero, J. E., Contreras, S., & Padilla, N. 2014, arXiv:1406.0508
- Gavazzi et al. (1999) Gavazzi, G., Boselli, A., Scodeggio, M., Pierini, D., & Belsole, E. 1999, MNRAS, 304, 595
- Hahn et al. (2007a) Hahn, O., Porciani, C., Carollo, C. M., & Dekel, A. 2007, MNRAS, 375, 489
- Hahn et al. (2007b) Hahn, O., Carollo, C. M., Porciani, C., & Dekel, A. 2007, MNRAS, 381, 41
- Hamilton (1998) Hamilton, A. J. S. 1998, The Evolving Universe (Dordrecht: Kluwer Academic Publishers), 231, 185
- Hoffman et al. (2012) Hoffman, Y., Metuki, O., Yepes, G., et al. 2012, MNRAS, 425, 2049
- Jerjen et al. (2004) Jerjen, H., Binggeli, B., & Barazza, F. D. 2004, AJ, 127, 771
- Kawahara (2010) Kawahara, H. 2010, ApJ, 719, 1926
- Kim et al. (2014) Kim, S. et al. 2014, submitted to ApJ
- Libeskind et al. (2012) Libeskind, N. I., Hoffman, Y., Knebe, A., et al. 2012, MNRAS, 421, L137
- Libeskind et al. (2013a) Libeskind, N. I., Hoffman, Y., Forero-Romero, J., et al. 2013, MNRAS, 428, 2489
- Libeskind et al. (2013b) Libeskind, N. I., Hoffman, Y., Steinmetz, M., et al. 2013, ApJ, 766, L15
- Libeskind et al. (2014) Libeskind, N. I., Hoffman, Y., & Gottlöber, S. 2014, MNRAS, 441, 1974
- Limousin et al. (2013) Limousin, M., Morandi, A., Sereno, M., et al. 2013, Space Sci. Rev., 177, 155
- Maggiore & Riotto (2010) Maggiore, M., & Riotto, A. 2010, ApJ, 717, 515
- Mei et al. (2007) Mei, S., Blakeslee, J. P., Côté, P., et al. 2007, ApJ, 655, 144
- Novikov et al. (2006) Novikov, D., Colombi, S., & Doré, O. 2006, MNRAS, 366, 1201
- Oguri et al. (2010) Oguri, M., Takada, M., Okabe, N., & Smith, G. P. 2010, MNRAS, 405, 2215
- Peebles (1980) Peebles, P. J. E. 1980, The large-scale structure of the universe, (Princeton : Princeton University Press)
- Praton & Schneider (1994) Praton, E. A., & Schneider, S. E. 1994, ApJ, 422, 46
- Press et al. (1992) Press, W. H., Teukolsky, S. A., Vetterling, W. T., & Flannery, B. P. 1992, (Cambridge: Cambridge University Press), 2nd ed.
- Robertson et al. (2009) Robertson, B. E., Kravtsov, A. V., Tinker, J., & Zentner, A. R. 2009, ApJ, 696, 636
- Sayers et al. (2011) Sayers, J., Golwala, S. R., Ameglio, S., & Pierpaoli, E. 2011, ApJ, 728, 39
- Sousbie et al. (2008) Sousbie, T., Pichon, C., Colombi, S., Novikov, D., & Pogosyan, D. 2008, MNRAS, 383, 1655
- Tempel et al. (2014) Tempel, E., Libeskind, N. I., Hoffman, Y., Liivamägi, L. J., & Tamm, A. 2014, MNRAS, 437, L11
- Gregory & Thompson (1978) Gregory, S. A., & Thompson, L. A. 1978, ApJ, 222, 784
- Torlina et al. (2007) Torlina, L., De Propris, R., & West, M. J. 2007, ApJ, 660, L97
- Tully (1982) Tully, R. B. 1982, ApJ, 257, 389
- van Haarlem & van de Weygaert (1993) van Haarlem, M., & van de Weygaert, R. 1993, ApJ, 418, 544
- Wang et al. (2009) Wang, H., Mo, H. J., Jing, Y. P., et al. 2009, MNRAS, 394, 398
- Wang et al. (2012) Wang, H., Mo, H. J., Yang, X., & van den Bosch, F. C. 2012, MNRAS, 420, 1809
- Wang et al. (2014) Wang, Y. O., Lin, W. P., Kang, X., et al. 2014, ApJ, 786, 8
- West et al. (1995) West, M. J., Jones, C., & Forman, W. 1995, ApJ, 451, L5
- West et al. (1991) West, M. J., Villumsen, J. V., & Dekel, A. 1991, ApJ, 369, 287
- West & Blakeslee (2000) West, M. J., & Blakeslee, J. P. 2000, ApJ, 543, L27
- Zhang et al. (2009) Zhang, Y., Yang, X., Faltenbacher, A., et al. 2009, ApJ, 706, 747