Extreme dust disks in Arp 220 as revealed by ALMA
Abstract
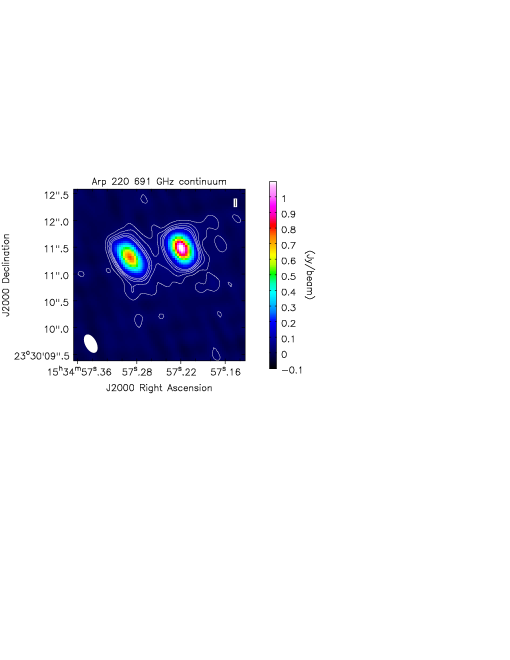
We present new images of Arp 220 from the Atacama Large Millimeter/submillimeter Array with the highest combination of frequency (691 GHz) and resolution () ever obtained for this prototypical ultraluminous infrared galaxy. The western nucleus is revealed to contain warm (200 K) dust that is optically thick (), while the eastern nucleus is cooler (80 K) and somewhat less opaque (). We derive full-width half-maximum diameters of pc and pc for the western and eastern nucleus, respectively. The two nuclei combined account for ( (calibration) (systematic))% of the total infrared luminosity of Arp 220. The luminosity surface density of the western nucleus ( in units of L⊙ kpc-2) appears sufficiently high to require the presence of an AGN or a “hot starburst”, although the exact value depends sensitively on the brightness distribution adopted for the source. Although the role of any central AGN remains open, the inferred mean gas column densities of cm-2 mean that any AGN in Arp 220 must be Compton-thick.
1 Introduction
As the closest example of an ultraluminous infrared galaxy (Soifer et al., 1984), Arp 220 has been intensively studied at a wide range of wavelengths. Much of this work has been focused on determining the energy sources powering its large infrared luminosity ( L⊙, Rangwala et al., 2011). Infrared spectroscopy has pointed to the dominance of a central starburst (Genzel et al., 1998; Armus et al., 2007; Contini et al., 2013), with the contribution of a buried active galactic nucleus (AGN) estimated to be 17% (Nardini et al., 2010). Models of submillimeter spectroscopy are not consistent with a dominant contribution from an X-ray dominated region to the global CO emission (Rangwala et al., 2011). However, high-resolution X-ray data identified a source with a hard spectrum coincident with the nuclear regions (Clements et al., 2002). Indications of HNC maser emission towards the western nucleus are also suggestive of the presence of an AGN (Aalto et al., 2009). In the radio, Arp 220 contains two compact nuclei (Baan & Haschick, 1995; Rodríguez-Rico et al., 2005), which are also seen as peaks in the near-infrared extinction maps (Scoville et al., 1998; Engel et al., 2011). High-resolution mid-infrared images show that these two nuclei account for essentially all of the 24 m flux density (Soifer et al., 1999).
Arp 220 has been intensively studied at high resolution at millimeter wavelengths in both continuum and CO spectral lines (Scoville et al., 1991, 1997; Downes & Solomon, 1998; Sakamoto et al., 1999; Downes & Eckart, 2007; Sakamoto et al., 2008; Matsushita et al., 2009; Engel et al., 2011). Sakamoto et al. (1999) conclude that most of the far-infrared luminosity originates in the two nuclei, which each contain a warm, dense gas disk pc in radius. Downes & Eckart (2007) present a detailed analysis of the brighter western nucleus and argue for the presence of an AGN based on the extremely high surface brightness. They estimate a dust temperature of 90-170 K, a radius of 35 pc, and an average gas density of cm-3. Sakamoto et al. (2008) also find dust temperatures of 90-160 K and nuclear luminosities of L⊙, with the precise values depending on the adopted source model. They conclude that the dominant energy source can be either an AGN or an extreme starburst. Matsushita et al. (2009) were also able to distinguish the two nuclei at 435 m. All these studies find evidence for continuum optical depths approaching unity at wavelengths of 0.87-1.3 mm.
In this Letter we present new high frequency, high resolution continuum imaging of Arp 220 ( Mpc, Mpc) from the Atacama Large Millimeter/submillimeter Array (ALMA). At a wavelength of 434 m, the nuclear disks have a significantly higher optical depth than the 860 m data of Sakamoto et al. (2008) while suffering less from the effects of foreground extinction than the 24 m data of Soifer et al. (1999). We use these new data to derive more precise measurements of the dust temperature, source size, and luminosity for each nucleus; although derived values depend heavily on the poorly resolved geometry of the source, the luminosity surface densities also point to the possible presence of an AGN in the western nucleus.
2 Observations
Arp 220 was observed with ALMA on 2012 December 31 with the Band 9 receivers tuned to cover the CO J=6-5 transition and adjacent continuum. Further details of the observations and calibration are given in Rangwala et al. (2014). The observations covered projected baselines from 13 to 374 m. Because the absolute flux scale had to be set using observations of the bandpass calibrator (3C279, measured to be 6.0 Jy during another observation taken within one day), we estimate the absolute calibration accuracy to be no better than 15%. We combined two line-free regions of the spectrum centered at 680.90 GHz ( GHz) and 676.75 GHz ( GHz) to make the continuum image. The mean observed frequency of the resulting image is 678.755 GHz, which at the redshift of Arp 220 (0.01813) corresponds to a rest frequency of 691.061 GHz (434 m). We applied two rounds of phase-only self-calibration followed by a final round of phase and amplitude self-calibration. The final image (Figure 1) made using uniform weighting and pixels has a beam of at position angle 28.3o with a 1 noise level of 11 mJy beam-1 (0.41 K). The two emission peaks are detected with a peak signal-to-noise ratio of 100 in the western nucleus and 70 in the eastern nucleus. Observed and derived properties of the two nuclei are given in Table 1.
3 Optical depth, source size, and dust temperature
A region centered on the peak pixel of each nucleus was fit with an elliptical gaussian to obtain the observed size and total flux density. The fitted size was analytically deconvolved from the beam to obtain the true source size. For our primary analysis, we assume each nucleus has an elliptical gaussian flux distribution. We also present selected results obtained by adopting a model of a uniform elliptical disk, for which the disk diameter is equal to 1.60 times the deconvolved gaussian full-width half-maximum (FWHM) diameter (Sakamoto et al., 2008). For the eastern nucleus, the major axis of the deconvolved dust emission is aligned with the kinematic major axis of the CO emission (Sakamoto et al., 2008; Rangwala et al., 2014). The western nucleus is not well resolved along the beam major axis, with a deconvolved diameter just 55% of the beam; in addition, we have no way to correct for any effects of radio seeing (e.g. Sakamoto et al., 2008). Thus, for the western nucleus we assume a major axis of at a position angle of 118∘, which is consistent with the kinematic major axis in this source. For our analysis, we also adopt the (deconvolved) inclination angle of obtained by Barcos-Muñoz et al. (2014) from a two-dimensional non-linear least-squares fit of a thin, tilted, exponential disk to their 33 GHz radio continuum image with resolution. Our assumed orientation for the western nucleus agrees with the east-west distribution of compact radio supernovae and supernova remnants (Parra et al., 2007).
The observed Rayleigh-Jeans peak temperature, , was converted to a true peak Rayleigh-Jeans brightness temperature, , by considering the coupling of a gaussian source to the gaussian beam, where and are, respectively, the true and observed full-width half-maximum diameter of the source. We derive a peak brightness temperature for the eastern nucleus of K, where the uncertainty is the 1 uncertainty derived from the 15% calibration accuracy of the ALMA data. Because the western nucleus is poorly resolved in one direction, its peak brightness temperature is more uncertain. Using the measured sizes gives K, while assuming the inclination angle from Barcos-Muñoz et al. (2014) gives K. We thus adopt K, where the first uncertainty is the uncertainty due to calibration and the second is the systematic uncertainty due to the unknown minor axis size.111In comparison, if we model each source as a uniform elliptical disk, the derived brightness temperatures are somewhat lower ( K for the eastern nucleus and K for the western nucleus using the observed source sizes).
In general, deriving the true dust temperature, , from the brightness temperature requires a knowledge of the optical depth, , since the two temperatures are related via
| (1) |
We estimate the optical depth at 691 GHz for each nucleus by comparing our fluxes with previous measurements at 230 GHz from Sakamoto et al. (1999) and at 345 GHz from Sakamoto et al. (2008). Because the sources are barely resolved, we assume a constant optical depth for each source, which in turn implies a constant mass surface density across each source. We correct the 230 GHz fluxes for contamination by synchrotron and free-free emission. For the western nucleus, these fluxes are estimated to be 2.7 mJy and 10 mJy, respectively (Downes & Eckart, 2007); for the eastern nucleus, we scale by the relative 43 GHz fluxes of the two sources from Rodríguez-Rico et al. (2005) to obtain estimates of 2 and 9 mJy, respectively. We also correct the 345 GHz fluxes for free-free emission by 10 and 9 mJy for the western and eastern nucleus, respectively. We assume a dust emissivity (Planck Collaboration, 2011) as seen towards high column density lines of sight with the Planck satellite. We measure the 691 GHz continuum flux for each nucleus within a radius of 0.45′′ using an image with 0.5′′ resolution to match the data from Sakamoto et al. (2008). We determine the optical depth using the 691 and 345 GHz fluxes from
| (2) |
where is the measured flux at frequency and . We use the lower signal-to-noise 230 GHz measurements as a consistency check on the fits. The solutions give a high 691 GHz optical depth in the western nucleus and thus the solutions for and are decoupled. For the eastern nucleus, we iterated between the two equations to find consistent solutions for the two parameters (Table 1). 222For the uniform elliptical disk model, the dust temperatures are somewhat lower (55 K for the eastern nucleus and 79 K for the western nucleus).
The optical depths for the two nuclei (Table 1) are larger than the value of derived from a global spectral energy distribution (Rangwala et al., 2011). The dust temperature for the eastern nucleus agrees within uncertainties with the global average value of 67 K (Rangwala et al., 2011), while the temperature for the western nucleus is roughly a factor of 2-3 higher. The 691 GHz flux attributed to the two nuclei is Jy (Table 1) while the total flux measured from the ALMA map is Jy. In comparison, the extrapolated flux from the Herschel data is Jy (Rangwala et al., 2011). Thus, there is room for an extended, low surface brightness dust component that could dominate the optical depth determined from the global fit. Indeed, the CO emission is significantly more extended than the continuum emission (Sakamoto et al., 1999; Downes & Eckart, 2007; Sakamoto et al., 2008; König et al., 2012; Rangwala et al., 2014) and there would presumably be dust mixed in with this more extended gas.
4 Discussion
4.1 Revisiting the evidence for a black hole in the western nucleus of Arp 220
Using our source sizes and dust temperatures, we can estimate the luminosity, luminosity-to-mass ratio, and luminosity surface density for each of the two nuclei. Integrating over both sides of the disk, the total luminosity of a thin inclined disk with a gaussian temperature distribution is where is the source full-width half-maximum size along the major axis. Depending on its minor axis size, the western nucleus may be up to an order of magnitude more luminous than the eastern nucleus (Table 1) and the resulting total luminosity is , where the first uncertainty is the calibration uncertainty and the second is the systematic uncertainty from the unknown minor axis of the western nuclei. We also adopt a disk geometry in calculating the total luminosity of Arp 220 (see, e.g., Scoville et al., 1997), giving a global luminosity (a factor of two smaller than the luminosity calculated assuming spherical geometry by Rangwala et al., 2011). The two nuclei together account for % of the total luminosity of Arp 220. Thus, within our calibration and systematic uncertainties, the two nuclei in Arp 220 likely contribute at least 45% and may contribute nearly all of the total infrared flux.
The flux or luminosity surface density, , is a key indicator for distinguishing between starbursts and AGN. We note that there are inconsistencies in the literature concerning this quantity, which is sometimes calculated by combining a spherical luminosity estimate with a projected source area, resulting in values a factor of 4 larger than the definition used here. In the western nucleus of Arp 220, the luminosity surface density is L⊙ kpc-2, while in the eastern nucleus it is L⊙ kpc-2 (see Table 1 for uncertainties in these quantities). Converting to the flux definition used here, the peak temperature of 162 K from Sakamoto et al. (2008) corresponds to a luminosity surface density of L⊙ kpc-2 for the western nucleus, quite similar to the value obtained here value. While Downes & Eckart (2007) quote a flux of L⊙ kpc-2 for the western nucleus, this value combines a spherical estimate of the luminosity with the projected area of the disk on the sky. Using our definition of flux and the peak dust temperature of 90 K from a gaussian source model, the Downes & Eckart (2007) data give a flux of L⊙ kpc-2. However, we note that at 1.3 mm (and possibly at 850 m) the true dust temperatures and therefore the fluxes are almost certainly underestimated due to optical depth effects.
The luminosity-to-mass ratio is another key indicator used to distinguish between starbursts and AGN. Engel et al. (2011) model the CO emission as a thin rotating disk to obtain masses of M⊙ for the western nucleus within 100 pc (with 80% of the mass within 50 pc radius) and M⊙ for the eastern nucleus within a radius of 81 pc. Combining these masses with our derived luminosities gives a luminosity-to-mass ratio of 540 L⊙ M within pc for the western nucleus and 30 L⊙ M within pc for the eastern nucleus (see Table 1 for uncertainties). Our luminosity-to-mass ratio for the western nucleus is comparable to that of Sakamoto et al. (2008), who obtained a ratio L⊙ M within pc using a dynamical mass of M⊙ and a luminosity derived assuming a spherical geometry.
The observed luminosities could be provided by a black hole with a mass of a few M⊙ accreting at the Eddington limit of L⊙ M. Engel et al. (2011) use the relation to estimate a black hole mass of M⊙ in the western nucleus. We note that Batejat et al. (2011) identify two compact radio sources that could be associated with a jet from an AGN in the western nucleus. In the eastern nucleus, an extreme starburst, with a maximum luminosity-to-mass ratio of L⊙ M and luminosity surface density of L⊙ kpc-2 (Thompson et al., 2005; Sakamoto et al., 2008), could also account for our observed values. While the luminosity surface density of the western nucleus excludes a starburst solution at the level, the derived values depend heavily on the poorly resolved geometry of the source. We also note that a more extreme “hot” starburst can produce even higher luminosity surface densities (Andrews & Thompson, 2011); with a peak temperature of K, the western nucleus could be probing this extreme starburst regime.
4.2 Gas and star formation in the Arp 220 nuclei
We made a first estimate of the gas surface density, , perpendicular to the plane of the disk from the optical depth using the value of cm2 derived from Planck data (Planck Collaboration, 2011) and using to derive . However, this surface density results in a gas mass for the western nucleus that is twice as large as the dynamical mass within the same radius (Engel et al., 2011). These results suggest that the dust optical depth per hydrogen atom, , must be larger in Arp 220 than the value from Planck Collaboration (2011), which was measured towards the Taurus molecular cloud. We note that the dust emissivity is found to increase at higher densities in the dust grain models of Ossenkopf & Henning (1993), although the models do not probe the combination of high density and temperature which we find in Arp 220 (see below). A smaller gas-to-dust mass ratio in Arp 220 than in the Milky Way could also produce a larger value of . Adopting cm2, we obtain the (uniform) gas surface densities given in Table 1. In particular, the gas surface density of cm-2 in the western nucleus implies that any buried AGN would be Compton-thick (see also Sakamoto et al., 1999; Downes & Eckart, 2007; Sakamoto et al., 2008).
Since the mean volume density of a dust disk depends on its vertical size (which is unconstrained from our data), we use a spherical source model to place lower limits on the volume density of cm-3 for the western nucleus and cm-3 for the eastern nucleus. These mean densities are significantly higher than the density of either the cold or the warm gas component traced via the CO analysis presented in Rangwala et al. (2011). Some of this difference may be attributed to the more extended nature of the warm CO emission seen in the CO 6-5 map (Rangwala et al., 2014). However, the continuum maps show that a significant fraction of the gas mass in Arp 220 occurs in a very centrally concentrated, high density component that is not traced by the high-J CO lines.
These new observations of Arp 220 reveal many similarities in the dust properties of the two nuclei. Both contain a compact, high surface density disk with a high mean gas density and warm dust temperatures. While the data provide tantalizing clues for the presence of an AGN in the western nucleus, higher resolution observations with ALMA using baselines of a few kilometers could resolve a temperature gradient in the central disk and reveal the high luminosity surface density that is a characteristic signature of an AGN.
References
- Aalto et al. (2009) Aalto, S., Wilner, D., Spaans, M. et al. 2009, A&A, 493, 481
- Andrews & Thompson (2011) Andrews, B. H. & Thompson, T. A., 2011, ApJ, 727, 97
- Armus et al. (2007) Armus, L., Charmandaris, V., Bernard-Salas, J. et al. 2007, ApJ, 656, 148
- Baan & Haschick (1995) Baan, W. A. & Haschick, A. D. 1995, ApJ, 454, 745
- Barcos-Muñoz et al. (2014) Barcos-Muñoz, L. et al., 2014, ApJ, submitted
- Batejat et al. (2011) Batejat, F., Conway, J. E., Hurley, R., et al. 2011, ApJ, 740, 95
- Clements et al. (2002) Clements, D. L., McDowell, J. C., Shaked, S., et al. 2002 , ApJ, 581, 974
- Contini et al. (2013) Contini, M., 2013, MNRAS, 429, 242
- Downes & Eckart (2007) Downes, D. & Eckart, A. 2007, A&A, 468, L57
- Downes & Solomon (1998) Downes, D. & Solomon, P. M. 1998, ApJ, 507, 615
- Elmegreen et al. (2008) Elmegreen, B. G., Klessen, R. S., & Wilson, C. D. 2008, ApJ, 681, 365
- Engel et al. (2011) Engel, H., Davies, R. I., Genzel, R., et al. 2011, ApJ, 729, 58
- Genzel et al. (1998) Genzel, R., Lutz, D., Sturm, E. et al. 1998, ApJ, 498, 579
- König et al. (2012) König S., Garc a-Marín, M., Eckart, A., Downes, D., & Scharwächter, J. 2012, ApJ, 754, 58
- Matsushita et al. (2009) Matsushita, S., Iono, D., Petitpas, G. R., et al. 2009, ApJ, 693, 56
- Nardini et al. (2010) Nardini, E., Risaliti, G., Watabe, Y., Salvati, M., & Sani, E., 2010 MNRAS, 405, 2505
- Ossenkopf & Henning (1993) Ossenkopf, V. & Henning, T. 1994, A&A, 291, 943
- Parra et al. (2007) Parra, R., Conway, J. E., Diamond, P. J. et al. 2007, ApJ, 659, 314
- Planck Collaboration (2011) Planck Collaboration, 2011, A&A, 536, A25
- Rangwala et al. (2011) Rangwala, N., Maloney, P. R., Glenn, J. et al. 2011, ApJ, 743, 94
- Rangwala et al. (2014) Rangwala, N., Wilson, C. D., Glenn, J. et al. 2014, in prep
- Rodríguez-Rico et al. (2005) Rodríguez-Rico, C. A., Goss, W. M. , Viallefond, F. et al. 2005, ApJ, 633, 198
- Sakamoto et al. (1999) Sakamoto, K., Scoville, N. Z., Yun, M. S. et al. 1999, ApJ, 514, 68
- Sakamoto et al. (2008) Sakamoto, K., Wang, J., Wiedner, M., et al. 2008, ApJ, 684, 957
- Scoville et al. (1991) Scoville, N. Z., Sargent, A. I., Sanders, D. B., & Soifer, B. T. 1991, ApJ, 366, L5
- Scoville et al. (1997) Scoville, N. Z., Yun, M. S., & Bryant, P. M., 1997, ApJ, 484, 702
- Scoville et al. (1998) Scoville, N. Z., Evans, A. S., Dinshaw, N. et al. 1998, ApJ, 492, L107
- Soifer et al. (1984) Soifer, B. T., Neugebauer, G., Helou, G., et al. 1984, ApJ, 283, L1
- Soifer et al. (1999) Soifer, B. T. et al., 1999, ApJ, 513, 207
- Thompson et al. (2005) Thompson, T. A., Quataert, E., & Murray, N., 2005, ApJ, 630, 167
| Quantity | Eastern Nucleus | Western Nucleus | units |
|---|---|---|---|
| Position (RA, Dec) | (15:34:57.29, +23:30:11.3) | (15:34:57.22, +23:30:11.5) | J2000 |
| Peak temperaturea,ba,bfootnotemark: | 27.0 | 40.1 | K |
| Flux density (691 GHz)bbFrom fitting each source separately with an elliptical gaussian; 691 GHz is the rest frequency. Reported size is FWHM; synthesized beam is at position angle 28o. | 1.51 | 1.81 | Jy |
| Observed sizebbFrom fitting each source separately with an elliptical gaussian; 691 GHz is the rest frequency. Reported size is FWHM; synthesized beam is at position angle 28o. | , 36o | , 28o | |
| Flux density (691 GHz)ccFlux density (rest frequency 691 GHz) measured within 0.45′′ radius from a 0.5′′ resolution image. | 1.45 | 1.82 | Jy |
| Flux density (345 GHz)ddFlux density (rest frequency 345 GHz) from Sakamoto et al. (2008) measured within 0.45′′ radius from a 0.5′′ resolution image. Flux is corrected for free-free emission of 9 and 10 mJy in the eastern and western nuclei; see text. | 191 | 370 | mJy |
| Flux density (230 GHz)eeFlux density (rest frequency 230 GHz) from Sakamoto et al. (1999), corrected for free-free and synchrotron emission (eastern: 9 and 2 mJy; western: 10 and 2.7 mJy); see text. | 55 | 129 | mJy |
| Deconvolved sizeffValue reported is FWHM for a deconvolved gaussian source; pc. | 0.34 0.22, 33o | , 118o | |
| g,hg,hfootnotemark: | … | ||
| hhAssuming a gaussian brightness distribution and an inclination for the western nucleus of 53.5∘; see text. | K | ||
| log(Luminosity)hhAssuming a gaussian brightness distribution and an inclination for the western nucleus of 53.5∘; see text. | L⊙ | ||
| log(Flux = ) | L⊙ kpc-2 | ||
| iiCalculated for pc for the western nucleus and pc for the eastern nucleus. | L⊙ M | ||
| Gas Massi,ji,jfootnotemark: | M⊙ | ||
| Gas Surface DensityjjAssumes ; see text. | H cm-2 | ||
| Gas Surface DensityjjAssumes ; see text. | M⊙ pc-2 | ||
| Mean Volume Densityi,j,ki,j,kfootnotemark: | H cm-3 |
Note: calibration uncertainties for all fluxes are estimated to be 15%. aafootnotetext: Rayleigh-Jeans temperature. For this resolution and frequency, 1 Jy = 36.6 K. ggfootnotetext: Calculated assuming ; see text. Uncertainties are derived from calibration uncertainties. Note that in the solutions, higher values of correspond to lower values of . kkfootnotetext: Upper limit is calculated assuming a spherical geometry (which is quite unlikely, especially for the eastern nucleus).