Softening of Granular Packings with Dynamic Forcing
Abstract
We perform numerical simulations of a two-dimensional bidisperse granular packing subjected to both a static confining pressure and a sinusoidal dynamic forcing applied by a wall on one edge of the packing. We measure the response experienced by a wall on the opposite edge of the packing and obtain the resonant frequency of the packing as the static or dynamic pressures are varied. Under increasing static pressure, the resonant frequency increases, indicating a velocity increase of elastic waves propagating through the packing. In contrast, when the dynamic amplitude is increased for fixed static pressure, the resonant frequency decreases, indicating a decrease in the wave velocity. This occurs both for compressional and for shear dynamic forcing, and is in agreement with experimental results. We find that the average contact number at the resonant frequency decreases with increasing dynamic amplitude, indicating that the elastic softening of the packing is associated with a reduced number of grain-grain contacts through which the elastic waves can travel. We image the excitations created in the packing and show that there are localized disturbances or soft spots that become more prevalent with increasing dynamic amplitude. Our results are in agreement with experiments on glass bead packings and earth materials such as sandstone and granite, and may be relevant to the decrease in elastic wave velocities that has been observed to occur near fault zones after strong earthquakes, in surficial sediments during strong ground motion, and in structures during earthquake excitation.
pacs:
45.70.-n,43.35.+d,91.30.-fI Introduction
Granular media has very unusual properties and can exhibit liquidlike behavior by flowing under certain excitations, while it can have a solidlike resistance to shear for other excitations. The jamming phase diagram, originally proposed by Liu and Nagel LiuNagel , provides a convenient description of the transition from jammed to unjammed states as a function of density, temperature, or loading. Granular media can exhibit fragile properties in which the response depends on the loading history cates ; 2001ostrovsky ; 2011jia ; reichreview . A number of studies have focused on the loading axis by applying a shear to the granular packing and studying the unjamming of the packing above a certain shear level s1 ; s2 ; s3 ; s4 ; s5 ; s6 ; s7 ; s8 ; s9 . Much work has also been performed on calculating the normal or soft modes of granular packings n1 ; n2 ; n3 ; n4 , with particular emphasis on the emergence of low frequency modes close to the jamming transition.
Most previous studies of granular matter under shear loading have considered primarily a single direction of shear, or quasistatic shearing s1 ; s2 ; s3 ; s4 ; s5 ; s6 ; s7 ; s8 ; s9 . Relatively little work has been performed on ac excitation or oscillation of granular matter in the dense state. Such dynamic shearing of dense granular packings is of particular interest in connection with prominent effects in surficial sediments from strong ground shaking from earthquakes field ; beresnev as well as the behavior of fault gouge material in response to earthquake forcing 2005johnson ; 2008johnson . Gouge is a disordered granular matter that often exists along and within the fault plane; it is produced by the long-term grinding of the tectonic plates against each other via a process known as communition gouge . It has been hypothesized to play a role in unusual nonlinear behavior of earthquake faults, such as a delayed triggering response in which a large distant earthquake can initiate an earthquake after a waiting time of days or months trigger . Moreover, large earthquakes have been observed to cause a long-lived depression of the elastic wave velocity in the mid to upper crust in localized areas, which slowly recovers over time Brengieur2008 ; Delorey as well as in near surface sediments 2004schaff ; 2007rubinstein ; 2011rubinstein .
Experiments performed with glass bead packs 2005johnson ; 2011jia and on natural materials such as sandstone show a similar decrease in the elastic wave velocity under oscillatory or dynamic loading johnsonPT ; 2001ostrovsky ; 2004tencate . One common method for probing the softening of the elastic wave velocity is the use of nonlinear resonant ultrasound spectroscopy, which can measure the nonlinear elastic state of a rock or a glass bead pack 2001ostrovsky . The frequency of an applied wave of fixed amplitude is swept or stepped across a resonant mode of the sample, and the resulting signal is measured on the opposite side of the sample johnsonPT . In diverse materials including Berea sandstone, Lavoux limestone, or synthetic slate, the resonant frequency drops with increasing amplitude of the driving wave johnsonPT ; 2000smith ; 2005johnson2 ; 2011tencate , and this indicates a drop in the velocity at which an elastic wave pulse travels through the sample 1996johnson ; 2004mashinskii ; 2011jia ; 2013knuth . In granular media, when the static confining pressure is increased, the elastic wave velocities increase goddard90 ; 99jia ; 2004makse ; 2007zimmer . Early work on elastic wave or sound propagation in a glass bead packing suggested that the detailed contact structure of grains within the packing play an important role in wave transmission 92Liu ; 93Liu , particularly in short-wavelength wave scattering 99jia . For long-wavelength coherent waves, effective medium theory indicates a link between the coordination number (the average number of contacts per grain) and the elastic wave velocity duffy ; digby ; goddard90 ; 2004makse . Simulations and experiments with 3D packings indicated that the effective medium theory fails to account quantitatively for the shear elastic modulus when the affine approximation breaks down at low static pressures or high dynamical amplitudes makse99 ; agnolin ; 2013vdw . Much is understood regarding grain behavior under shear ferdowsi13 ; ferdowsi14 ; however, despite a number of studies on sound wave propagation in two and three dimensional packings 2005somfai ; 2010khidas , a detailed microscopic understanding of the elastic wave velocity evolution with driving amplitude has not yet been obtained.
In this work, we study confined granular packings subjected to both a static pressure and to dynamic loading achieved by applying an ac compressional or shear loading to our model system. We show that the behavior of the elastic wave propagation matches what has been observed experimentally, and demonstrate that changes in the contact number of the grains are correlated with the elastic wave propagation changes. We illustrate the dynamical motion of the grains and discuss the implications of our work to dynamical triggering studies performed using earthquake catalogs.
II Simulation
We consider a two-dimensional (2D) packing of disks with Hertzian contact interactions hertz ; cundall :
| (1) |
where is the elastic constant of the grains in dimensionless units, is the diameter of particle , , , and . The two grains interact only when they are in contact with each other, for . To avoid crystallization of the packing, we use a bidisperse assembly of grains consisting of a 50:50 mixture of grains with a radius ratio of 1:1.4. We measure length in units of , the diameter of the smaller of the two sizes of grains. We include shear friction between the grains gallas of the form:
| (2) |
for the normal friction and
| (3) |
for the tangential friction. Here and are the dissipation coefficients, is the effective mass of the two grain system, is the velocity of grain , , and
| (4) |
We employ a granular dynamics simulation technique to integrate the equations of motion for each particle, given by
| (5) |
and
| (6) |
where is the mass (radius of gyration) of grain , is the angular degree of freedom of grain , and is the torque exerted on a grain through contact with other grains.
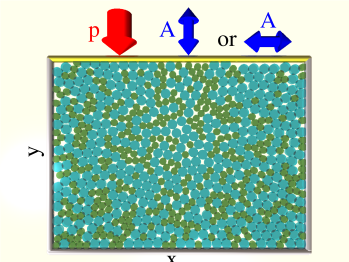
The grains are confined within four walls in our simulation box as illustrated in Fig. 1, with no periodic boundary conditions. Wall interactions are modeled using image grains that are the reflection of a grain in contact with the wall to the other side of the wall. The bottom and side walls are held at fixed positions, while the top wall is a piston used to apply a static load normal to the wall modulated by a dynamic load of the form , where for compressional loading and for shear loading. The position of the top wall is allowed to vary according to the sum of the total load and the effective forces exerted on the image grains by the actual grains. A static pressure value of corresponds to a downward force on individual grains touching the top wall of . This pressure is transmitted throughout the packing and opposed by an effective force arising from the fixed bottom wall, so that individual grains move very little when the static pressure is modified. Similarly, a dynamic compressional amplitude of contributes an oscillating force of magnitude to each grain touching the top wall, such that the motion of individual grains remains much smaller than . It is important to note that due to the confinement, once the grains have been prepared in the packing they are not able to rearrange their positions but can only make slight shifts relative to their neighbors, which do not change. We measure the net force exerted by the grains on the top wall, , and the bottom wall, , for fixed while slowly stepping across a resonant frequency . For each driving frequency , we collect data during a period of 50 drive cycles. We then compute the power spectrum of both and , and obtain the response in the form of the relative or normalized amplitudes of the output to input signals at the driving frequency, .
To prepare our system, we remove the left wall of the sample, hold the top or piston wall in a fixed position, and fill the system with a granular gas. We add a gravitational force term to each grain and allow the grains to settle into a dense packing. We then close the left wall and change the gravitational force to to force the grains toward the bottom wall of the packing; we then permit the piston or top wall to move and incrementally apply a static pressure to the piston, allowing the granular arrangement to settle to a state of no net motion between pressure increments. Once we have reached the desired static pressure level , we add a sinusoidal term to the force exerted by the piston, resulting in a sinusoidal motion of the piston. We permit the system to oscillate for 20 cycles in order to eliminate any transient effects, and then measure the wall forces and during a period of 50 cycles. In a given run we perform a frequency sweep by holding the amplitude of the oscillation of the piston fixed but increasing the frequency of the oscillation to a new value after each set of 70 cycles. To change the static pressure or the magnitude of the dynamic forcing, we start with a fresh uncompacted sample in each case. This avoids a systematic increase in density that could otherwise occur after each frequency sweep. Our simulation measurement protocol is similar to that used in the experiment described in Ref. 2005johnson , where the resonance compressional P waves are observed.
III Results
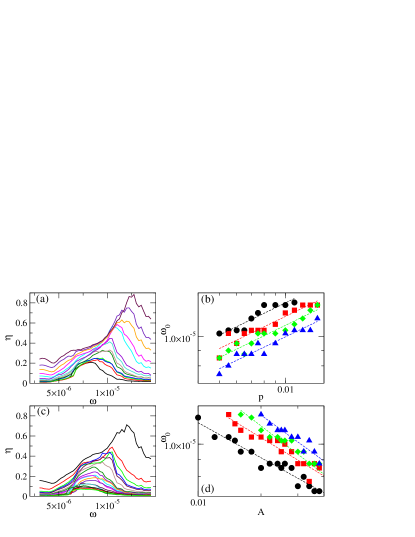
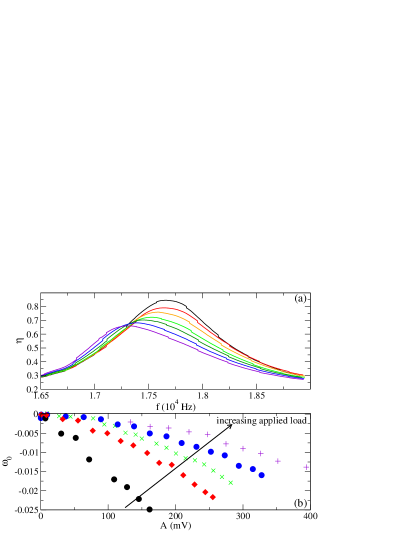
We first compare measurements of the dynamic response in the compressional and shear oscillatory simulations and in experiments. In Fig. 2(a) we plot the normalized amplitude as a function of driving frequency for fixed compressional dynamic amplitude and static pressures ranging from to . Here the resonant frequency shifts to higher values as the static pressure is increased. This indicates that the elastic wave velocity is increasing with increasing static pressure, in agreement with previous observations. By identifying the value of from each curve, we construct a plot of versus shown in Fig. 2(b) for dynamic amplitudes ranging from to . The resonant frequency increases with increasing static pressure roughly as a power law with slope ; however, there is an overall downward shift in the resonant frequency as the compressional dynamic loading increases. In Fig. 2(c) we plot versus for the compressed system at fixed static pressure and dynamic amplitudes ranging from to . Here, the peak value decreases in frequency with increasing dynamic amplitude , indicating that the elastic wave velocity is decreasing with increased dynamic driving. This softening of the system with dynamic driving is more clearly shown in Fig. 2(d) where we plot versus for values of ranging from to . The softening is very robust and appears for each value of . For comparison, we illustrate in Fig. 3(a) the experimentally obtained values of as a function of frequency for different dynamical amplitudes . The resonant frequency decreases with increasing dynamic amplitude. This is more clearly shown in Fig. 3(b), where we plot , the shift in from a reference value, versus the dynamic amplitude for different values of static pressure 2005johnson . In each case, the resonant frequency decreases with increasing dynamic amplitude in agreement with the simulation results.
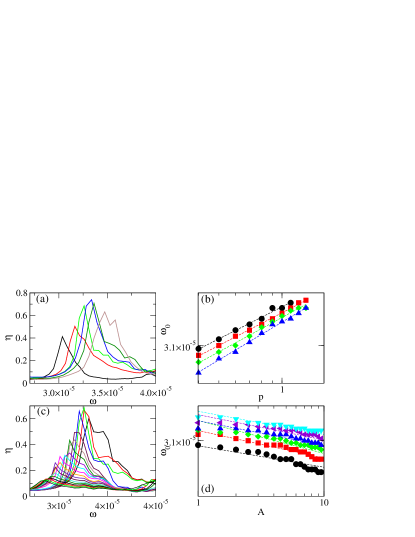
We find similar behavior for a system in which the top plate is dynamically sheared in the direction transverse to the applied static pressure. In Fig. 4(a) we illustrate representative vs curves at and increasing static pressure in the sheared system. Figure 4(b) shows a log-log plot versus curves for values of ranging from 3 to 10 in the same system. We observe a power law behavior with , a somewhat smaller exponent than in the dynamically compressed system. The resonant frequency increases with increasing , indicating an increase in the elastic wave velocity with increasing static pressure. We note that significantly larger static pressures must be applied to the dynamically sheared system than to the dynamically compressed system in order to obtain a wave signal that propagates through the entire packing and is measurable on the bottom plate. For increasing dynamic amplitude, the resonant frequency decreases, as illustrated in Fig. 4(c) for and a range of values of . The decrease is slower than linear, as shown in Fig. 4(d) where we plot versus for different values of in the dynamically sheared system. These simulation results are also in excellent agreement with our experimental observations on shear resonant modes inprep .

In Fig. 3(b) we find that experimentally, the overall magnitude of the decrease in with increasing dynamic amplitude, , becomes smaller when the static load is increased. The same behavior occurs in the simulations, as shown in Figs. 2(d) and 4(d). For the compressional dynamic simulations, we find that if we decrease the static pressure to very small values, passes through a peak value and then begins to decrease with decreasing instead of increasing. This is shown in Fig. 5, where we plot as a function of static pressure in the compressional system. For , increases with increasing static pressure, while for , decreases with increasing static pressure. The higher behavior agrees with the experimental results 2005johnson . For the remainder of this paper, we will focus on the higher pressure regime with in the compressional dynamic simulation.
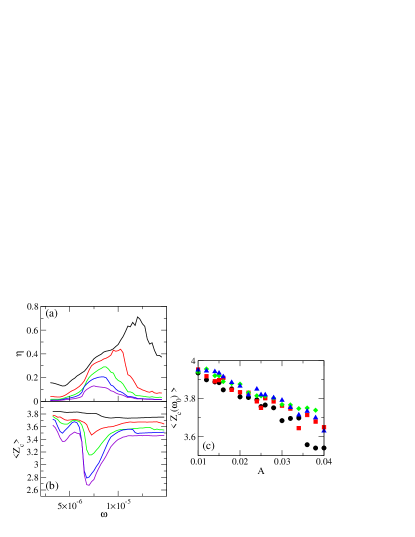
We next compare the response of the system with the average coordination number of the packing, where is the number of particles in direct contact with particle . In Fig. 6(a) we plot the normalized amplitude versus driving frequency in a compressional system with for dynamic amplitudes ranging from to . As before, we observe that the resonant frequency decreases with increased . In Fig. 6(b) we show the corresponding versus driving frequency. Near the resonance frequency there is a dip in which increases in magnitude with increasing , indicating that the packing is becoming looser as the dynamic amplitude increases. The decrease of , the value of at the resonant frequency, is shown in Fig. 6(c) as a function of . There is a slight increase in as the static pressure increases, but there is a clear decrease in with increasing . As suggested by the effective medium theory, the elastic wave velocity is proportional to the coordination number duffy ; digby ; goddard90 ; 2004makse . Thus the reduction of the number of the contacts in the packing is the physical reason for the decrease in the elastic wave velocity with increasing dynamical amplitude in the granular packing. Higher static pressure forces more grains into direct contact. In contrast, larger amplitudes of dynamical forcing tend to break contacts in the packing.
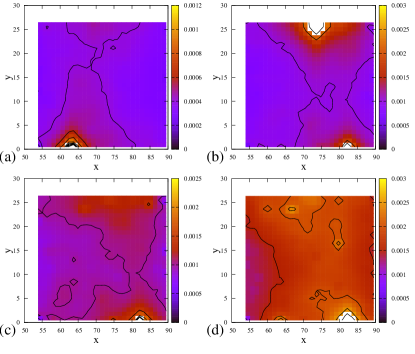
Finally, we find that the motion of the grains under excitation takes two forms. The bulk of the packing responds collectively, with a large section of the packing moving coherently in response to the dynamic forcing at and near resonance. We also observe isolated soft spots or rattler areas where an individual grain has a much higher amplitude of motion than the grains that surround it. These soft spots tend to contribute additional damping to the propagating elastic wave signature. To identify the soft spots in the compressional dynamic simulation, we compute , which is the maximum displacement of an individual particle from its average equilibrium position for a given driving frequency, amplitude, and static pressure. In Fig. 7 we show contour plots of the value of at the resonant frequency for packings with and to 0.030. The position in the packing is indicated on the and axes, while the coloring indicates the value of . The number and density of soft spots, indicated by local maxima in , increases with increasing driving amplitude, with a single spot in Fig. 7(a), two in Fig. 7(b), three in Fig. 7(c), and more than four in Fig. 7(d). This proliferation of soft spots contributes to the drop in with increasing driving amplitude.
IV DISCUSSION
Different regimes of the elastic wave velocity (compressional or shear) through 2D or 3D bead packings as a function of applied static pressure have been observed previously in experiment, with at high pressures but at low pressure duffy ; goddard90 ; gilles ; jia01 ; velicky02 ; gilles03 ; 2008coste ; 2008brunet . The results shown in Figs. 2 and 4 are more consistent with the low pressure regime. For the case of monodisperse disk packings, this effect was treated analytically in Ref. 2009pride . This scaling behavior might be correlated to the change in static pressure with the average contact number in the packing goddard90 ; henkes as has been confirmed numerically 2004makse ; 2005somfai ; 2007majmudar and in experiments 2010zhang .
Regarding the magnitude of the change in the wave velocity with dynamical amplitude, it is generally larger for low static pressure than for high static pressure 2004mashinskii ; 2005johnson , in agreement with our results in Figs. 2 and 4. In Ref. 2013vdw , this behavior was suggested to result from significant rearrangements of the contact network, resulting in a change in the average contact number but without significant motion of particles or a significant change in the packing density. Indeed, as we observe here, small shifts in the positions of individual grains can modify the local contact number enough to change the effective velocity of elastic waves in the system. We find a reduction in the average contact number when the amplitude of the dynamical forcing is increased, consistent with the experimental results. This resembles the “acoustic fluidization” effect (initially introduced for describing frictional weakening 79melosh ) that has been observed in which the elastic wave velocity can soften under large wave amplitudes even when significant contact reorganization and sliding do not occur 2011jia ; 2012espindola . If the wave amplitude were large enough to drop the average contact number below the jamming threshold in a significant portion of the sample, a “sonic vacuum” state could occur in which transmission of elastic waves would become impossible 2012gomez . Above these amplitudes, the entire packing fluidizes, as in Refs. 1994luding ; 1995luding .
Granular packings often exhibit heterogeneous responses due to their highly disordered internal contact structure. In a 2D idealized granular packing, based on the response of a single grain to a sinusoidal driving frequency, localized normal modes at high frequency were predicted to occur, likely due to the interference between scattered plane waves 1994leibig . Evidence for localized soft spots has been observed in Hertzian packings where the velocity distribution functions for the motion of individual particles have fat tails, indicating strongly non-Gaussian behavior 2013owens . These soft spots found at relatively low frequencies have been connected particularly with highly nonlinear responses such as glass-like behavior and non-affine displacement fields in granular packings n1 ; n2 ; n3 ; n4 ; tsamados ; manning ; chen .
Numerous studies have employed granular packings as a surrogate for the complex behavior occurring along fault zones in Earth gouge ; 2005johnson ; 2008daniels ; 2008johnson ; 2012johnson . Our results may suggest that the decrease in velocity observed along and near a fault after a large earthquake is analogous to a change in the granular packing to a state with a reduced number of contacts, even if no significant rearrangements of the grain positions have occurred. These contacts could gradually reconnect over time, in analogy with the slow recovery of the sound velocity that has been observed in the earth.
Indeed, in the earth, the fault blocks surrounding a fault zone contain fractures at many scales. These are analogous to the grain contacts in our simulation and laboratory experiments. As wave amplitudes increase, slip is mobilized along the fractures resulting in a bulk modulus softening of the rock. This behavior is followed by slow dynamics where contacts in fractures are re-established, as demonstrated in laboratory experiments 2005johnson ; 2011jia .
V SUMMARY
We characterize the evolution of the internal characteristics of bidisperse two-dimensional granular packings under large amplitude dynamic forcing and varied confining pressure. We find that the resonant frequency or fundamental mode of the frequency decreases with increasing dynamic amplitude at constant static pressure, in agreement with laboratory and field experiments. For fixed dynamic amplitude, the resonant frequency increases with increasing confining pressure, also in agreement with experiment. We show that the average contact number of the packing decreases both at resonance and for increasing dynamic amplitude. We characterize the heterogeneity of the packing response by measuring the vibration displacement of each grain, and find regions of high and low displacements. Our approach provides insight into the elastic nonlinear nature of unconsolidated materials such as granular packings, as well as consolidated materials such as sandstone.
Acknowledgements.
This work was supported by Institutional Support (LDRD) at Los Alamos National Laboratory. This work was carried out under the auspices of the NNSA of the U.S. DoE at LANL under Contract No. DE-AC52-06NA25396.References
- (1) A.J. Liu and S.R. Nagel, Nature 396, 21 (1998).
- (2) M.E. Cates, J.P. Wittmer, J.-P. Bouchaud, and P. Claudin, Phys. Rev. Lett. 81, 1841 (1998).
- (3) A. Ostrovsky and P.A. Johnson, Riv. Nuovo Cimiento 24, 1 (2001).
- (4) X. Jia, Th. Brunet, and J. Laurent, Phys. Rev. E 84, 020301(R) (2011).
- (5) C. Reichhardt and C.J. Olson Reichhardt, Soft Matter 10, 2932 (2014).
- (6) D. Howell, R.P. Behringer, and C. Veje, Phys. Rev. Lett. 82, 5241 (1999).
- (7) D.M. Mueth, G.F. Debregeas, G.S. Karczmar, P.J. Eng, S.R. Nagel, and H.M. Nagel, Nature 406, 385 (2000).
- (8) O. Dauchot, G. Marty, and G. Biroli, Phys. Rev. Lett. 95, 265701 (2005).
- (9) P. Olsson and S. Teitel, Phys. Rev. Lett. 99, 178001 (2007).
- (10) A. Tordesillas, Phil. Mag. 87, 4987 (2007).
- (11) C. Heussinger and J.-L. Barrat, Phys. Rev. Lett. 102, 218303 (2009).
- (12) P. Olsson, Phys. Rev. E 81, 040301(R) (2010).
- (13) D. Bi, J. Zhang, B. Chakraborty, and R.P. Behringer, Nature 480, 355 (2011).
- (14) P. Olsson and S. Teitel, Phys. Rev. E 83, 030302(R) (2011).
- (15) L.E. Silbert, A.J. Liu, and S.R. Nagel, Phys. Rev. Lett. 95, 098301 (2005).
- (16) M. Wyart, L.E. Silbert, S.R. Nagel, and T.A. Witten, Phys. Rev. E 72, 051306 (2005).
- (17) L.E. Silbert, A.J. Liu, and S.R. Nagel, Phys. Rev. E 79, 021308 (2009).
- (18) N. Xu, V. Vitelli, A.J. Liu, and S.R. Nagel, EPL 90, 56001 (2010).
- (19) E.H. Field, Y. Zeng, P.A. Johnson, and I.A. Beresnev, J. Geophys. Res. 103, 26869 (1998).
- (20) I.A. Beresnev, G.M. Atkinson, P.A. Johnson, and E.H. Field, Bull. Seism. Soc. Am. 88, 1402 (1998).
- (21) P.A. Johnson and X. Jia, Nature 437, 871 (2005).
- (22) P.A. Johnson, H. Savage, M. Knuth, J. Gomberg, and C. Marone, Nature 451, 57 (2008).
- (23) S.L. Karner and C. Marone, J. Geophys. Res. 106, 19319 (2001).
- (24) J. Gomberg and P. Johnson, Nature 437, 7060 (2005).
- (25) F. Brenguier, M. Campillo, C. Hadziioannou, N.M. Shapiro, R.M. Nadeau, E. Larose, Science, 321 1478 (2008).
- (26) A.A. Delorey, K. Chao, K. Obara, and P.A. Johnson, unpublished.
- (27) D.P. Schaff and G.C. Beroza, J. Geophys. Res. 109, B10302 (2004).
- (28) J.L. Rubinstein, N. Uchida, and G.C. Beroza, J. Geophys. Res. 112, B05315 (2007).
- (29) J.L. Rubinstein, Bull. Seism. Soc. Am. 101, 275 (2011).
- (30) J.A. TenCate, D. Pasqualini, S. Habib, K. Heitmann, D. Higdon, and P.A. Johnson, Phys. Rev. Lett. 93, 065501 (2004).
- (31) R.A. Guyer and P.A. Johnson, Physics Today 52(4), 30 (1999).
- (32) E. Smith and J.A. TenCate, Geophys. Res. Lett. 27, 1985 (2000).
- (33) P. Johnson and A. Sutin, J. Acoust. Soc. Am. 117, 124 (2005).
- (34) J.A. TenCate, Pure Appl. Geophys. 168, 2211 (2011).
- (35) E.I. Mashinskii, J. Geophys. Eng. 1, 295 (2004).
- (36) M.W. Knuth, H.J. Tobin, and C. Marone, Granular Matter 15, 499 (2013).
- (37) P.A. Johnson, B. Zinszner, and P.N.J. Rasolofosaon, J. Geophys. Res. 101, 11553 (1996).
- (38) J.D. Goddard, Proc. R. Soc. Lond. A 430, 105 (1990).
- (39) X. Jia, C. Caroli, and B. Velicky, Phys. Rev. Lett. 82, 1863 (1999).
- (40) H.A. Makse, N. Gland, D.L. Johnson, and L. Schwartz, Phys. Rev. E 70, 061302 (2004).
- (41) M.A. Zimmer, M. Prasad, G. Mavko, and A. Nur, Geophys. 72, E1 (2007).
- (42) C.-h. Liu and S.R. Nagel, Phys. Rev. Lett. 68, 2301 (1992).
- (43) C.-h. Liu and S.R. Nagel, Phys. Rev. B 48, 15646 (1993).
- (44) J. Duffy and R.D. Mindlin, J. Appl. Mech. 24, 585 (1957).
- (45) P.J. Digby, J. Appl. Mech. 48, 803 (1981).
- (46) H.A. Makse, N. Gland, D.L. Johnson, and L.M. Schwartz, Phys. Rev. Lett. 83, 5070 (1999).
- (47) I. Agnolin and J.-N. Roux, Phys. Rev. E 76, 061304 (2007).
- (48) S. van den Wildenberg, M. van Hecke, and X. Jia, EPL 101, 14004 (2013).
- (49) B. Ferdowsi, M. Griffa, R.A. Guyer, P.A. Johnson, C. Marone, and J. Carmeliet, Geophys. Res. Lett. 40, 4194 (2013).
- (50) B. Ferdowsi, M. Griffa, R.A. Guyer, P.A. Johnson, C. Marone, and J. Carmeliet, Phys. Rev. E 89, 042204 (2014).
- (51) E. Somfai, J.-N. Roux, J.H. Snoeijer, M. van Hecke, and W. van Saarloos, Phys. Rev. E 72, 021301 (2005), and references therein.
- (52) Y. Khidas and X. Jia, Phys. Rev. E 81, 021303 (2010).
- (53) K.L. Johnson, Contact mechanics. (Cambridge University Press, Cambridge, 1985).
- (54) P.A. Cundall and O.D.L. Strack, Geotechnique 29, 47 (1979).
- (55) J.A.C. Gallas, H.J. Herrmann, and S. Sokolowski, Phys. Rev. Lett. 69, 1371 (1992).
- (56) J. Laurent, Ph.D. thesis, Université Paris-Est Marne-La-Vallée, July 2011, in French.
- (57) B. Gilles and C. Coste, in Powders and Grains 2001, edited by Y. Kishino (Balkema, Lisse, 2001), p. 113.
- (58) X. Jia and P. Mills, in Powders and Grains 2001, edited by Y. Kishino (Balkema, Lisse, 2001), p. 105.
- (59) B. Velicky and C. Caroli, Phys. Rev. E 65, 021307 (2002).
- (60) B. Gilles and C. Coste, Phys. Rev. Lett. 90, 174302 (2003).
- (61) C. Coste and B. Gilles, Phys. Rev. E 77, 021302 (2008).
- (62) T. Brunet, X. Jia, and P.A. Johnson, Geophys. Res. Lett. 35, L19308 (2008).
- (63) S.R. Pride and J.G. Berryman, Acta Mech. 205, 185 (2009).
- (64) S. Henkes and B. Chakraborty, Phys. Rev. Lett. 95, 198002 (2005).
- (65) T.S. Majmudar, M. Sperl, S. Luding, and R.P. Behringer, Phys. Rev. Lett. 98, 058001 (2007).
- (66) J. Zhang, T.S. Majmudar, A. Tordesillas, and R.P. Behringer, Granular Matter 12, 159 (2010).
- (67) H.J. Melosh, Nature (London) 379, 601 (1996).
- (68) D. Espindola, B. Galaz, and F. Melo, Phys. Rev. Lett. 109, 158301 (2012).
- (69) L.R. Gomez, A.M. Turner, and V. Vitelli, Phys. Rev. E 86, 041302 (2012).
- (70) S. Luding, H.J. Herrmann, and A. Blumen, Phys. Rev. E 50, 3100 (1994).
- (71) S. Luding, Phys. Rev. E 52, 4442 (1995).
- (72) M. Leibig, Phys. Rev. E 49, 1647 (1994).
- (73) E.T. Owens and K.E. Daniels, Soft Matter 9, 1214 (2013).
- (74) M. Tsamados, A. Tanguy, C. Goldenberg, and J.-L. Barrat, Phys. Rev. E 80, 026112 (2009).
- (75) M.L. Manning and A.J. Liu, Phys. Rev. Lett. 107, 108302 (2011).
- (76) K. Chen, M.L. Manning, P.J. Yunker, W.G. Ellenbroek, Z. Zhang, A.J. Liu, and A.G. Yodh, Phys. Rev. Lett. 107, 108301 (2011).
- (77) K.E. Daniels and N.W. Hayman, J. Geophys. Res. 113, B11411 (2008).
- (78) P.A. Johnson, B. Carpenter, M. Knuth, B.M. Kaproth, P.-Y. Le Bas, E.G. Daub, and C. Marone, J. Geophys. Res. 117, B04310 (2012).