Mapping the Economic Crisis: Some Preliminary Investigations
Abstract
In this paper we describe our contribution to the PoliInformatics 2014 Challenge on the 2007-2008 financial crisis. We propose a state of the art technique to extract information from texts and provide different representations, giving first a static overview of the domain and then a dynamic representation of its main evolutions. We show that this strategy provides a practical solution to some recent theories in social sciences that are facing a lack of methods and tools to automatically extract information from natural language texts.
1 Introduction
This paper describes our contribution to the PoliInformatics 2014 challenge. The organizers of this challenge had made available a series of documents on the 2007-2008 financial crisis. The shared task consisted in developing solutions to address questions such as “Who was the financial crisis?” or “What was the financial crisis?”. Of course, these questions are too complex to receive a simple and direct answer. Consequently our strategy has been to provide tools to process and visualize the most relevant data, so that experts can easily navigate this flow of information and make sense of the data. While we believe in semi-automatic corpus exploration, we do not think it is possible or even desirable to provide fully automatic answers to the above questions.
We have mainly used available tools to extract and visualize information. More precisely, we have used the Stanford Named Entity Recognizer [Finkel et al., 2005] and the Cortext platform (http://www.cortext.net/) for information extraction. As for data visualization, we have used Gephi [Bastian et al., 2009] to observe semantic and social networks, and the Cortext platform to observe the evolution of the domain over time.
The rest of the paper is organized as follows: we first present in section 2 the corpora selected for this study and in section 3 the application of the Stanford Named Entity Recognizer; Section 4 is dedicated to the first graph construction procedure based on Gephi; in Section 5, the construction of the Sankey diagrams is explained, before concluding. Note that all the maps provided are also available at http://www.lattice.cnrs.fr/PoliInformatics2014. Some of them integrate interactive facilities (dynamic display of the complete list of terms related to a given topic, etc.) when online.
2 Corpora Selected for the Analysis
Different corpora were made available for the unshared task. From those, we chose to focus on the reports, and excluded bills and auditions as the former seemed to be informationally richer and easier to process. Therefore, we worked on three different files: the Congressional Reports “Wall Street and the Financial Crisis: Anatomy of a Financial Collapse” (referred to as AoC in the rest of the document), “The Stock Market Plunge: What Happened and What is Next?” (referred to as SMP), and the “Financial Crisis Inquiry Report” (referred to as FCIC). Each of these files was accessible as a PDF, or alternatively as a list of HTML pages, each page corresponding to a page of the PDF file.
The first task we performed was to transform the HTML files into a single text document (thanks to a Python script). In the case of AoC, an option was added to remove page numbers, which were present in the content part of the HTML file. Moreover, we normalized the files so that every space break (line breaks, multiple space breaks or tabular breaks) was changed into a single space break. After this procedure, we obtained three text files: AoC.txt, SMP.txt and FCIC.txt.
3 Named Entity Recognition and Normalization
The next step was to extract named entities from the different corpora. In order to do so, we used the Stanford NER, based on Conditional Random Fields, with MUC tags (Time, Location, Organization, Person, Money, Percent, Date) [Finkel et al., 2005]. We were indeed interested in extracting organizations and persons so as to get information about who are the actors of the financial crisis, but dates were also necessary to be able to represent the temporal evolution of the financial crisis.
Because the SMP corpus is too small, we used it for tests but results are not commented in the present article.
Certain entities appear under different forms. For instance, “Standard and Poor” might occur as “Standard & Poor”, “S&P” or “Standard & Poor’s executive board” (this last sequence in fact refers to a slightly different named entity); in a similar fashion, a person as “Mary Schapiro” may appear as “Schapiro”, or “Miss Schapiro” or “Chairman Schapiro”. A normalization process is therefore needed.
A large number of references on the subject exist: see, among many others, [Zhang et al., 2011, Han and Sun, 2011, Gottipati and Jiang, 2011, Rao et al., 2011]. We chose a rather simple approach that performed well on our corpus based on the following rules
-
•
: if two organizations ORG1 and ORG2 are made of more than one word, and share the same initials, they are considered equal; similarly, if the sequence ORG1 is in ORG2 or ORG2 in ORG1, they are considered to refer to the same entity.
-
•
: two persons PERS1 and PERS2 are supposed to refer to the same person if the sequence PERS1 is in PERS2 (or PERS2 in PERS1); the same hypothesis stands if the last string in PERS1 (resp. PERS2) is in PERS2 (resp. PERS1).
We did not notice a significant improvement when using more sophisticated methods (cf. above) so we keep these simple and traceable set of rules.
We then had to generalize the approach since the previous strategy is not enough to cluster together all the relevant linguistic sequences corresponding to a same entity. Based on the rules and , we tested two clustering approaches:
-
•
: consider the most frequent entities E1 in the set of words S1 and E2 in S2. If they are identical according to , S1 and S2 are merged into a single cluster.
-
•
: given AV the average number of occurrences of a person or oganization in the corpus, consider the sets A1 S1 and A2 S2 made of all entities that occur more than AV times in the corpus. If all items E1 A1 and all E2 A2 are identical according to , then S1 and S2 are merged.
The normalization subprocess (resp. ) is iterated until a fixpoint is reached in the set of sets of entities. After evaluation the normalization strategy based on turned to be the most efficient one. Even if basic, this normalization strategy proved helpful for further analysis.
4 Vizualizing entities
We used the Gephi software [Bastian et al., 2009] so as to create graphs for each corpus, such that:
-
•
a node corresponds to a cluster of persons or organizations in the corresponding corpus (each node is labeled with the most frequent entity in the corresponding cluster);
-
•
an edge between two nodes corresponds to the number of co-occurrences of the two nodes within the same sentence in the corpus.
We chose to consider persons and organizations together since they can play a similar role in the event, and metonymy is often used, so that a person can refer to a company (and vice versa).
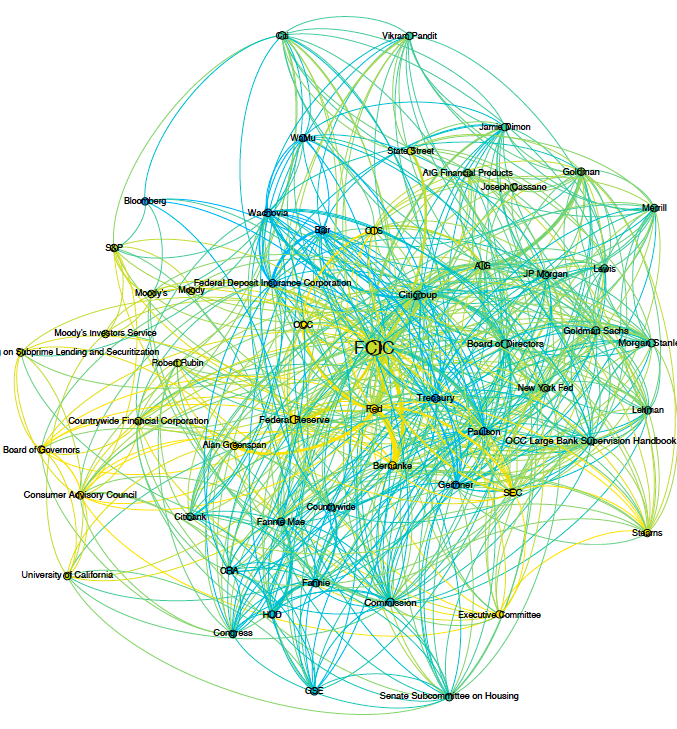
We then used the Force Atlas algorithm so that only pairs of linked nodes attract each other. We assign a measure of betweennes centrality (BC) to each node, which makes nodes with highest degrees (i.e. nodes with the highest number of links) be bigger; finally, we used a clustering algorithm: the Louvain Method [Blondel et al., 2008], to detect communities in the graph, and we colored the nodes of each community with a distinct color; intuitively, we want the number of intra-communities edges to be high, while the number of inter-communities edges is low.
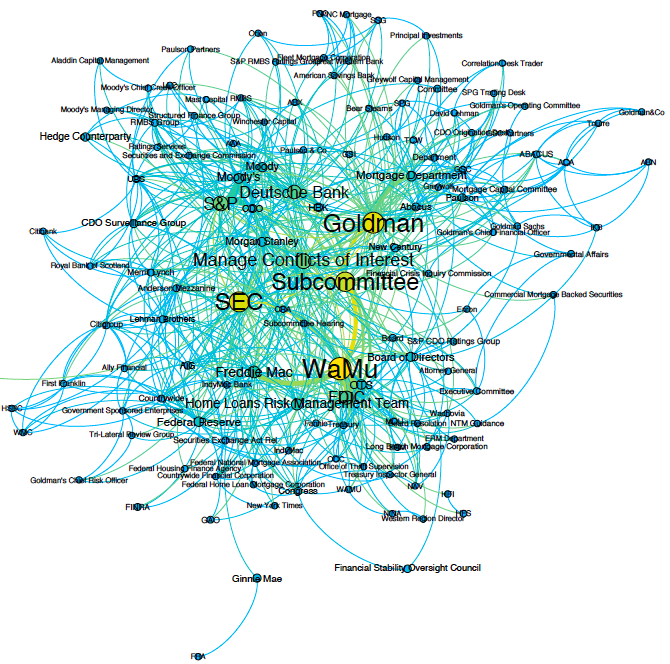
This process leads to the visualization of two properties: i) the size of a node gives a measure of the dependance of the corresponding set of entities to other sets of entities. With this measure, we expect to highlight the role of key organizations and persons during the financial crisis who have influenced other organizations/persons, etc.; ii) the same process is then used to highlight strong links between persons and organizations.
The results can be seen on figure 1 and figure 2111Due to their large size and complexity, figures presented in the end of this paper are small and not fully readable; however, we hope they give the reader a flavor of the kind of representation possible. See http://www.lattice.cnrs.fr/PoliInformatics2014 to visualize the original maps. . Of course some links are not really informative (for instance the link between an organization and its CEO); other links express information that may be registered in different knowledge bases (see for ex. the link between Scott Polakoff and OTS, or between Fabrice Tourre and Goldman Sachs). However, we expect to extract less predictable links that could be of interest for scholars and experts in the field. As an example (and even if this is still not really surprising), we can observe (figure 2) the links between the Fed Consumer Advisory Council and the Board of Governors (for ex. Bernanke, Mark Olson, and Kevin Warsh) since the first group of people (the council) warns the Board of Governors of the crisis that is just beginning.
These visualizations should be explored and tested by specialists who could evaluate their real benefits. A historic view on the data would also be useful to analyse the dynamics and the evolution of the crisis, through for example the evolution of terms associated with named entities over different periods of time.
5 Visualizing temporal evolution
We tried to explore and visualize the temporal evolution of the financial crisis, more specifically the evolution of the perceived role of organizations over time. To do so, we produced Sankey diagrams of the correlation of organizations and domain related terms in the corpus. With this strategy, Sankey diagrams take into account the temporal evolutions of entities and actions along the crisis.
To this aim, we re-used the results of the named entity recognizer (see section 3). All the data is extracted from the text itself, including dates. A dates is currently associated only with the sentence it appears in. In other words, the scope of dates (how many events / sentences depend from a given date) is currently not taken into account but this should be addressed in the near future.
Organization names as well as dates are normalized, so that only years are kept in the end (note however, that a more fine-grained representation, at the month level for example, would be desirable for further investigation). Lastly, we only selected occurrences of years in the range [1990-2020], since documents may refer to past and future legislation (but the analysis here is of course not trying to make any prediction for the future). Few but some references are made to the 1929 crisis for instance: those were not relevant for our analysis and were then removed.
We then run the Lexical Extraction module of the Cortext platform (for technical details see http://docs.cortext.net/lexical-extraction/) in order to extract the N most relevant terms in AoC and FCIC. We were thus able to extract the most representative cooccurrences of named entities along with domain specific terms over time.
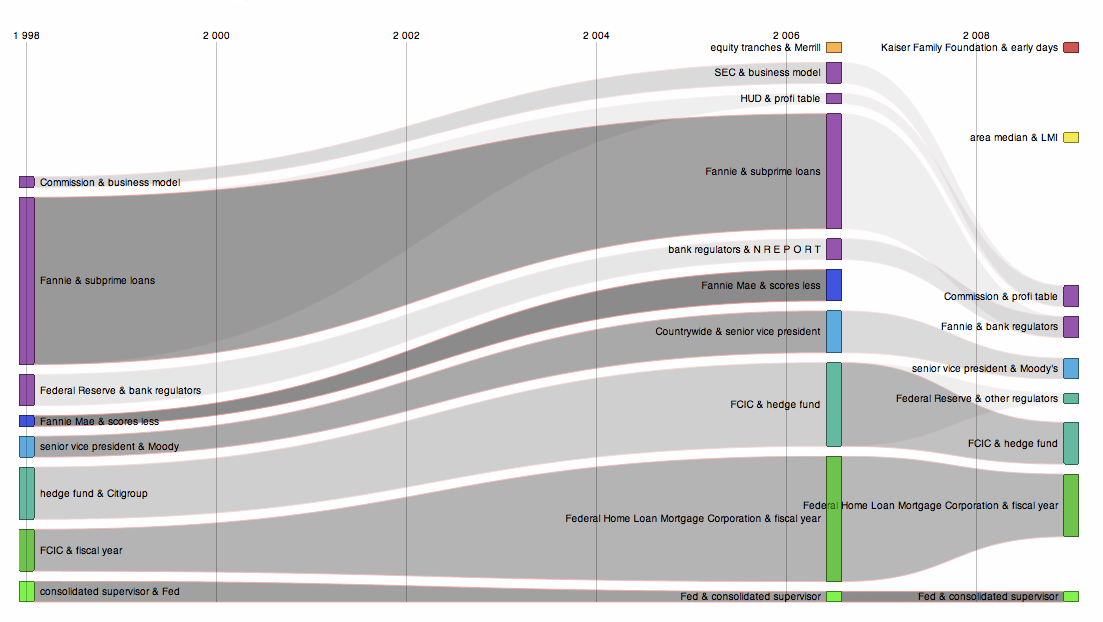
An overview of the diagram built on FCIC is given on Figure 3 for information. These representations are in fact interactive: by clicking on the different objects (the colored sticks, the grey tubes) it is possible to get the list of terms that are common (or different) between two different periods of time. Associations evolve, hence the tubes can split or merge, depending on a change in the context, i.e. in the role of an entity or in the way it is perceived by other actors.
Figure 3 reveals a modification in the data between 2006 and 2008, a period which approximates the start of the financial crisis. For instance, the stream in purple in this graph reveals many cooccurrences of Fannie Mae and subprime loans for the period 1990-2007 while for the period 2008-2010, Fannie Mae is more closely associated with ’bank regulators’, or ’Federal Financial Services Supervisory Authority’. In a more general way, all the streams of data represented in the diagram are dramatically modified after 2007.
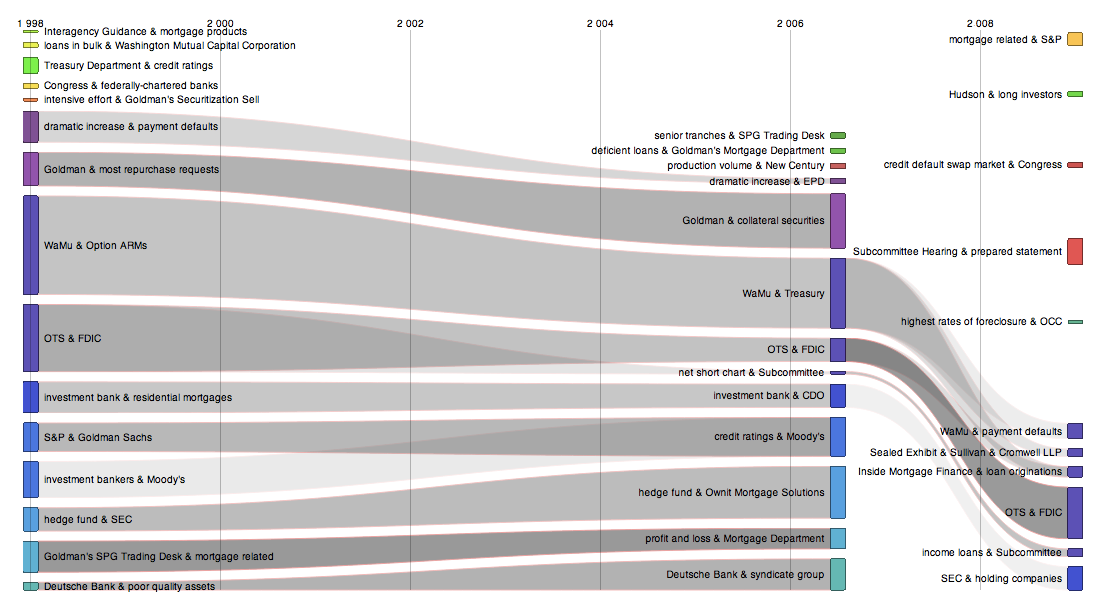
The AoC diagram (Figure 4) shows the very same modification of data streams, which suffer from a change after the 2007 time period.
This representation gives immediate access to key facts. For example, the payment default of the Washington Mutual Bank (WaMu) appears clearly. Other examples gives an immediate and meaningful view of the general situation over time but a more fine grained analysis would be both possible and desirable.
6 Discussion
In this paper, we have explored the use of natural language processing tools to extract and visualize information on the 2007-2008 financial crisis. We first presented a static view of the domain based on cooccurrences of named entities (mainly persons and organizations) within the corpus. We then showed how the evolution of the domain can be represented taking time into account. In this second experiment we focused on co-occurrences of organizations and domain specific terms and showed that the terms evolve over time as well as their association with company names, making it possible to get a picture of the domain without having to read first the whole documentation.
These representations are inspired by recent theories in social sciences that propose not to define a priori groups of interest but to directly take into account actors and observe regular patterns or regular behaviors [Law and Hassard, 1999, Latour, 2005]. Existing natural language processing tools now make it possible to generate such representation directly from texts, which was not possible until recently [Venturini and Guido, 2012]. Traditional representations based on co-word analysis are not enough any more and recent advances in named entity recognition, relation and event extraction mean that the richness of texts can be better exploited.
7 Future Work
Perspectives are twofold: on the one hand enhance data analysis so as to provide more relevant maps and representations, and on the second hand work closely with domain experts and provide interactive ways of navigating the data.
On the technical side, several improvements could be done. For instance, it would be interesting to complete the extraction of technical terms with relevant verbs so as to obtain more relevant connections between entities. The goal would be to better characterize the role played by the different entities. Also, dates considered in the temporal analysis could be scaled in months or days. In the same direction, it could be interesting to test different named entities normalization strategies, and to test our methods on more texts from different sources.
Concerning interactions with experts, it is clear that end users could provide a very valuable contribution in the selection of relevant data as well as in the way they are linked and mapped. Some experiments are currently being done with a focus group gathering social science as well as information science experts. They will assess that the solution is useful and workable and more importantly, will give feedback so as to provide better solutions.
Acknowledgments
The authors are thankful to Elisa Omodei for her help in using the Cortext platform. We would also like to thank the two reviewers from the PoliInformatics challenge for their useful feedback and suggestions on the work done. We are also grateful to the experts involved in our focus group.
This research was partially funded by the CNRS Mastodons Aresos project.
References
- [Bastian et al., 2009] Mathieu Bastian, Sebastien Heymann, and Mathieu Jacomy. 2009. Gephi: an open source software for exploring and manipulating networks. In International AAAI Conference on Weblogs and Social Media (ICWSM), pages 361–362.
- [Blondel et al., 2008] Vincent D. Blondel, Jean-Loup Guillaume, Renaud Lambiotte, and Etienne Lefebvre. 2008. Fast unfolding of communities in large networks. Journal of Statistical Mechanics: Theory and Experiment, 2008(10).
- [Finkel et al., 2005] Jenny Rose Finkel, Trond Grenager, and Christopher Manning. 2005. Incorporating non-local Information into Information Extraction Systems by Gibbs Sampling. In Proceedings of the conference of the Association for Computational Linguistics, pages 363–370.
- [Gottipati and Jiang, 2011] Swapna Gottipati and Jing Jiang. 2011. Linking entities to a knowledge base with query expansion. In Proc. of Empirical Methods in Natural Language Processing (EMNLP).
- [Han and Sun, 2011] Xianpei Han and Le Sun. 2011. A generative entity-mention model for linking entities with knowledge base. In Proc. of Association for Computational Linguistics.
- [Latour, 2005] Bruno Latour. 2005. Reassembling the Social: An Introduction to Actor-Network-Theory. Oxford University Press, Oxford.
- [Law and Hassard, 1999] John Law and John Hassard, editors. 1999. Actor Network Theory and After. Blackwell, Oxford.
- [Rao et al., 2011] Delip Rao, Paul McNamee, and Mark Dredze. 2011. Entity linking: Finding extracted entities in a knowledge base. In Multi-source, Multi-lingual Information Extraction and Summarization, pages 93–115. Springer.
- [Venturini and Guido, 2012] Tommaso Venturini and Daniele Guido. 2012. Once upon a text : an ant tale in text analysis. Sociologica (online: http://www.sociologica.mulino.it/journal/ issue/index/Issue/Journal:ISSUE:18), 3.
- [Zhang et al., 2011] Wei Zhang, Yan Chuan Sim, Jian Su, and Chew Lim Tan. 2011. Entity linking with effective acronym expansion instance selection and topic modeling. In Proc. of International Joint Conference on Artificial Intelligence, pages 1909–1914.