Comparative studies of low temperature X-ray diffraction experiments on Ir2O7 ( Nd, Eu, and Pr)
Abstract
The cubic symmetry of pyrochlore iridium oxides Ir2O7 ( Nd, Eu, and Pr) has been investigated by high resolution X-ray diffraction experiments down to 4 K, in order to clarify the relationship between the metal-insulator transition (MIT) and the small structural phase transition suggested by Raman scattering experiments in these compounds. We have found that a small negative thermal expansion of the order of Å appears only in Nd2Ir2O7 below the MIT, K, ascribable to the magnetovolume effect of the long-range order of Ir moments. However, any breaking of the cubic symmetry of three iridates has not been observed as appearance of superlattice reflections nor splittings of cubic reflections below . These results imply that lowering of the cubic symmetry plays a minor role for the change in the electronic state of these compounds, while a magnetic order of Ir moments plays a major role for the MIT.
pacs:
71.30.+h, 61.05.cf, 75.47.-m, 72.80.GaI Introduction
Geometrically frustrated magnets with metallic conduction have attracted much attention because of the realization of a new type of electronic and magnetic behavior, originating from the interplay between frustrated spins and conduction electrons Lacroix et al. (2010); Boldrin and Wills (2012). The pyrochlore iridates Ir2O7 ( Y, Pr–Lu) are one of the candidates to study such a correlated state, where an unconventional anomalous Hall effect Machida et al. (2007, 2009), giant magnetoresistance Matsuhira et al. (2013); Disseler et al. (2013), heavy Fermion behavior Nakatsuji et al. (2006); Yanagishima and Maeno (2001), and metal-insulator transition (MIT) Yanagishima and Maeno (2001); Matsuhira et al. (2007, 2011); Ishikawa et al. (2012); Ueda et al. (2012) have been observed. Band calculations Koo et al. (1998) indicate the importance of Ir 5 electrons which contribute to novel metallic properties of these compounds: the conduction band near the Fermi level consists of Ir and O orbitals in a metallic state, and the formal valence of Ir ions is expected to be tetravalent (Ir4+, ) Fukazawa and Maeno (2002). More recent theoretical considerations Pesin and Balents (2010) indicate the effective total-angular-momentum state of Ir4+ and the significance of the strong spin orbit interaction and electron correlation inherent to the Ir element, which can lead to exotic electronic and magnetic phases, including a topological Mott insulator Pesin and Balents (2010); Yang and Kim (2010); Kargarian et al. (2011); Kurita et al. (2011); Witczak-Krempa et al. (2010); Guo and Franz (2009), a Weyl semimetal Wan et al. (2011); Witczak-Krempa and Kim (2012); Chen and Hermele (2012), and an axion insulator Wan et al. (2011); Chen and Hermele (2012); Go et al. (2012).
Experimentally, most of Ir2O7 compounds exhibit MIT in accordance with magnetic phase transitions Yanagishima and Maeno (2001); Matsuhira et al. (2007). Recent studies on systematic replacement of ions Matsuhira et al. (2011) indicated that the transition temperature of the MIT, , decreases with increasing the ion radius of rare earth ions. Interestingly, it is found that the system becomes metallic in the vicinity of Nd and Pr, where the long-range magnetic order is also suppressed Nakatsuji et al. (2006) and the spin-liquid like phase is suggested Machida et al. (2009); Onoda and Tanaka (2010). Mechanical pressure experiments Sakata et al. (2011); Tafti et al. (2012) also indicated an anomalous metallic phase which can appear in the suppression of the MIT.
Stimulating these experimental results and recent extensive attention to an exotic electronic phase for transition metal systems Pesin and Balents (2010); Kim et al. (2009); Shitade et al. (2009); Witczak-Krempa et al. (2014), several experimental investigations on Ir2O7 compounds have also been performed to clarify the origin of the MIT. Raman scattering experiments Hasegawa et al. (2010) focused on a relationship between the MIT and the crystal-structure phase transition which has been often observed in transition metal oxides Imada et al. (1998). The results for sintered powder samples of Sm, Eu and a single crystal of Nd showed that an additional development of a Raman peak, a signature of the structure phase transition, was observed below for Sm2Ir2O7 and Eu2Ir2O7, while no clear signals appear for Nd2Ir2O7. More recent resonant X-ray diffraction (XRD) experiments Sagayama et al. (2013) on a single crystal of Eu2Ir2O7, however, did not observe the crystal-structure phase transition, although the experiments clarified the long-range order of Ir4+ moments consisting of an all-in all-out (AIAO) magnetic structure. Neutron diffraction experiments also suggested the long-range order of Ir moments in Nd2Ir2O7 Watahiki et al. (2011), where the AIAO structure of the ordered moments was also expected Tomiyasu et al. (2012). Therefore, in the magnetic point of view, some electronic correlation effects relating to the magnetic order of Ir moments are essential for the MIT of Ir2O7, as in the case of Cd2Os2O7 Yamaura et al. (2012). These are purely electronic mechanisms for the emergence of the MIT, which do not require the crystal-structure phase transition and its effect to the band structure. A recent theory has also suggested an electronic mechanism, examining a finite temperature effect for physical properties Witczak-Krempa et al. (2013). However, the situation is still complicated because of the discrepancy of experimental results for the crystal structure Hasegawa et al. (2010); Sagayama et al. (2013), and of the possible effect of the structural change with the lattice distortion Yang and Kim (2010). It is thus essential to clarify the low-temperature crystal structure as well as the possible emergence of the crystal-structure phase transition in these compounds.
In this study, we have performed low-temperature and high-resolution X-ray diffraction experiments on powder samples of Nd2Ir2O7 (NIO), Eu2Ir2O7 (EIO), and Pr2Ir2O7 (PIO). We focused on the previous experimental results of Raman scattering and expected that the change in the crystal-structure phase transition is very small even though there exists the phase transition. We thus used a high resolution X-ray diffractometer which can detect a change of the lattice parameter of the order of Å Goto et al. (2011); not . We have measured temperature dependence of the lattice parameter down to 4 K, since the temperature change in the lattice parameter can be precisely detected by our setup not . It is also a reason that if the crystal-structure phase transition occurs, a related structural change or a precursor of the phase transition are known to be observed in the -dependence of lattice parameters, strain, and elastic constants Kazei et al. (1998); Hirano et al. (2003); Kimura et al. (2009); Melcher (1976): thus in addition to searching the emergence of a superlattice reflection and splitting of peaks in X-ray diffraction patterns, searching of an anomaly in the -dependence of the lattice parameter is also a simple and direct way for the clarification of small changes in the crystal-structure phase transition. We have found a negative thermal expansion that appears only for NIO at temperatures below K. The crystal structure retains the cubic pyrochlore structure (space group , No.227) for all three compounds down to 4 K. These results suggest that the crystal-structure phase transition from the cubic pyrochlore structure is not the main origin of the MIT. Instead, the magnetic order of Ir4+ moments could lead to a crucial effect for the emergence of the MIT of pyrochlore iridates, which should also affect the magnetovolume effect of these compounds.
II Experimental
Polycrystalline samples of NIO, EIO and PIO were prepared by a standard solid-state reaction Matsuhira et al. (2007, 2011); Kimura et al. (2011). The appropriate amounts of Nd2O3 (99.99%, Rare Metallic Co., Ltd.), Eu2O3 (99.99%, Rare Metallic Co., Ltd.) or Pr6O11 (99.99%, Rare Metallic Co., Ltd.) and IrO2 (%, Tanaka Kikinzoku Kogyo K. K.) were mixed for 30–60 minutes and pressed into pellets. The pellets were wrapped with Pt foils and placed in evacuated quartz tubes. These products were then heated at 1173 K for about 3 days. After this reaction, additional 3% of IrO2 was added. The pellets of the mixtures, wrapped with Pt foils, were heated again at 1473 K for about 10 days in evacuated quartz tubes. In this process, several intermediate grindings were performed in order to react the samples well.
X-ray powder-diffraction experiments were carried out using a Rigaku SmartLab powder diffractometer equipped with a Cu K monochromator. The sample was mounted in a closed-cycle He-gas refrigerator and the temperature was controlled from 300 to 4 K. Details of the confirmation of the sample quality are described in a later section.
To check physical properties of obtained powder samples, the specific heat () and dc magnetic susceptibility () were measured with a commercial calorimeter (Quantum Design, PPMS) and with a SQUID magnetometer (Quantum Design, MPMS). The electrical resistivity was also measured by using a standard four-probe method for rectangular samples cut out from pellets.
III Results
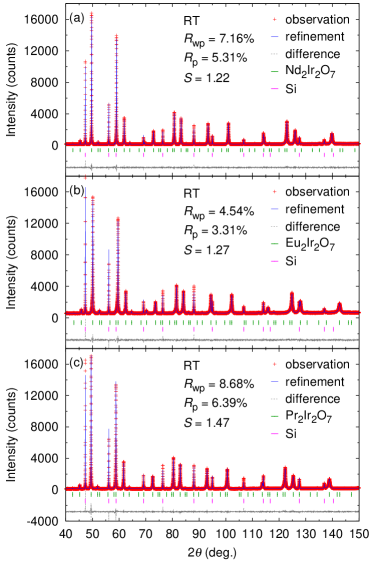
Before going to low temperature XRD experiments, we have checked the sample quality at room temperature (RT). Figure 1 shows the diffraction patterns and the results of Rietveld refinement by using RIETAN-FP Izumi and Momma (2007). We confirmed that XRD patterns of NIO, EIO, and PIO were reasonably fitted by parameters of the cubic pyrochlore structure with the space group . The refined structure parameters are listed in Table 1. The final factors of the refinements are %, %, and % for NIO, %, %, and % for EIO, and %, %, and % for PIO, respectively. The goodness-of-fit parameter, , was , , and for NIO, EIO, and PIO, respectively, indicating that the qualities of the fitting are good. Note that we confirmed a few amount (%) of an impurity phase such as Nd9.33(SiO4)6O2 in our samples, however it does not affect the peak profiles and intensities of main peaks such as (440), (444), and (800) for the low-temperature XRD experiments and physical properties. We thus considered that our powder samples were reasonable for the experiments.
| Atom | Site | x | y | z | (Å2) |
| Nd | 16d | 1/2 | 1/2 | 1/2 | 1.3(1) |
| Ir | 16c | 0 | 0 | 0 | 1.7(fix) |
| O | 48f | 0.330(1) | 1/8 | 1/8 | 5 (fix) |
| O’ | 8b | 3/8 | 3/8 | 3/8 | 5 (fix) |
| Eu | 16d | 1/2 | 1/2 | 1/2 | 4.2(2) |
| Ir | 16c | 0 | 0 | 0 | 1.7(1) |
| O | 48f | 0.336(1) | 1/8 | 1/8 | 5 (fix) |
| O’ | 8b | 3/8 | 3/8 | 3/8 | 5 (fix) |
| Pr | 16d | 1/2 | 1/2 | 1/2 | 1.9(1) |
| Ir | 16c | 0 | 0 | 0 | 1.7(fix) |
| O | 48f | 0.330(1) | 1/8 | 1/8 | 5 (fix) |
| O’ | 8b | 3/8 | 3/8 | 3/8 | 5 (fix) |
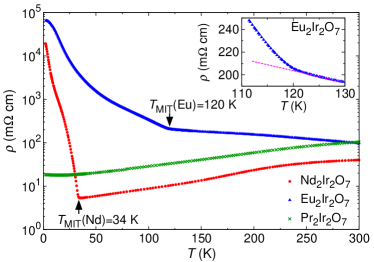
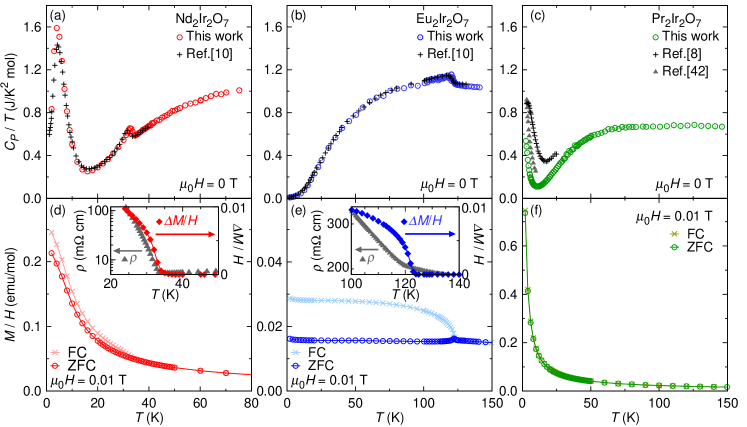
The prepared samples exhibit qualitatively the same behaviors of , , and as those of the previous reports (Figs. 2 and 3) Matsuhira et al. (2007, 2011); Kimura et al. (2011); Ishikawa et al. (2012); Tokiwa et al. (2014). We confirmed that the second-order phase transition of the MIT appear at K for NIO and at K for EIO (Fig. 2). For PIO, the metallic behavior was confirmed down to 2 K of the present lowest measured temperature, where PIO does not show any signatures of a magnetic phase transition and MIT. It can thus be considered that PIO becomes a reference compound for NIO and EIO when comparing behaviors with and without the MIT. Note that the absolute value of of PIO is slightly larger than that of Ref. [10], while it is almost the same as that of Ref. [33]. This result is probably due to the grain boundaries in the pelletized samples, which brings about a weak localization of conduction electrons. It is also noted here that a slight discrepancy between our sample and previous polycrystalline samples Yanagishima and Maeno (2001); Matsuhira et al. (2011) was observed in the -dependence of for EIO below . This result may come from the effect of a small amount of the off-stoichiometry of samples Ishikawa et al. (2012). We will discuss it in a later section.
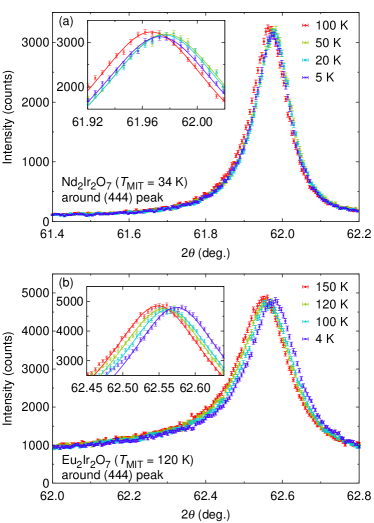
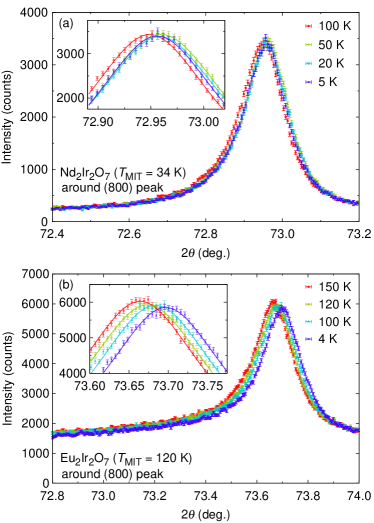
Next, we have checked the possibility of a crystal-structure phase transition for NIO and EIO by searching the emergence of a superlattice reflection and splitting of peaks in the XRD patterns at low temperatures: these are experimental signatures of a crystal-structure phase transition. However, we did not observe any superlattice reflections nor splitting and broadening of certain peaks at temperatures below : i.e., K for NIO and K for EIO. Even though there exists a superlattice reflection, peak intensities are expected to be below 0.01% of the maximum peak counts of the (111) peak, where counts were integrated in our experiments. It is thus considered that the crystal symmetry retains the cubic pyrochlore structure even for a low temperature phase of NIO and of EIO. In Figs. 4 and 5, we show representative peak profiles around the (444) and (800) peaks of NIO and EIO, respectively. One can see no splitting and broadening of the peaks below . In these experiments, the peak positions are determined within a very small experimental error of , as in the case of previous experiments on the powder sample of Tb2Ti2O7 Goto et al. (2011).
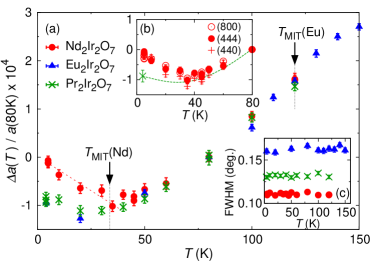
We found a different temperature dependence of the lattice parameter for EIO and NIO. EIO shows a positive thermal expansion, while NIO shows a negative thermal expansion on warming. It is slight but experimentally clear for the peak shift of those compounds [insets of Figs. 4(a) and (b) and of Figs. 5(a) and (b)], where the peak of EIO and of NIO goes forward and backward around , respectively. In Fig. 6, we show the temperature dependence of the lattice parameter of NIO and EIO, estimated from the peak position of the (444) peak at each temperature. The data was normalized by one at K, , where . For reference, we also show the results of PIO in the same experimental way. One can see that continuously decreases on cooling for three compounds. However, only NIO exhibits the negative thermal expansion below about K. The same tendency was also confirmed by using other experimental results for converting from peak positions of e.g. the (800) and (440) peaks for NIO [Fig. 6(b)]. The linear coefficient of the thermal expansion is obtained as K-1 at K and K-1 at K for NIO. We can thus estimate the discontinuity of around as K-1. Note that a very small upturn is also found at temperatures below 20 K for EIO and PIO, however the value of the changes is one order of magnitude smaller than that for NIO. In the whole measured temperature range, the full width at half maximum (FWHM) of profile peaks is almost -independent (inset of Fig. 6 for the (444) peak), implying again no reduction of the crystal symmetry below within the experimental accuracy.
It is worth noting here that we didn’t observe any obvious anomaly in at about K for NIO, where the localized moments of Nd3+ are known to exhibit an antiferromagnetic long-range order Tomiyasu et al. (2012).
IV Discussion
From our low temperature XRD data presented above, we experimentally revealed that pyrochlore iridates of NIO and EIO do not show the crystal-structure phase transition at temperatures lower than . Moreover, within the experimental accuracy, we didn’t observe appropriate differences in the temperature dependence of the peak positions of (800), (444), and (440) [Fig. 6(b)], which implies the lattice retains the cubic symmetry. We therefore think that the crystal-structure phase transition from the cubic pyrochlore structure is not the main origin of the MIT of pyrochlore iridates in real materials. In contrast, our powder samples of NIO and EIO show the MIT and the magnetic anomaly in at almost the same temperature [insets of Figs. 3(d) and (e)], implying the long-range order of the Ir4+ moments with forming the AIAO magnetic structure Tomiyasu et al. (2012); Sagayama et al. (2013). It is thus considered that the magnetic order with the AIAO magnetic structure of Ir moments brings about the change in the electronic state at . A similar case has been recently pointed out for Cd2Os2O7 Yamaura et al. (2012). On the basis of the irreducible representation of the AIAO magnetic structure at the 16c-site atom of the pyrochlore lattice Yamaura et al. (2012); Sagayama et al. (2013), the cubic structural symmetry can be preserved at temperatures above and below the magnetic phase transition. It is consistent with the present experimental results.
The incompatible behavior of the lattice expansion of NIO and of EIO can be understood semi-quantitatively by the Ehrenfest relation for a second-order phase transition: i.e., , where is the molar volume and is the peak height of the specific heat at . From present and XRD experiments and previous pressure-effect experiments Sakata et al. (2011); Tafti et al. (2012), these values are roughly estimated as K/GPa, J/K2-mol, and cm3/mol at K for NIO, while K/GPa, J/K2-mol, and cm3/mol at K for EIO, respectively. Therefore, the expected value of due to the phase transition can be calculated as K-1 for NIO and K-1 for EIO, respectively. Both compounds are expected to show the negative thermal expansion, however the change in NIO should appear as a larger effect at . In our experiments, it was estimated that K-1 for NIO. The absolute value of the experiment is somewhat smaller than that of the rough estimation above, although the order of the value is the same. We thus think that other extra effects could reduce the absolute value of the negative thermal expansion from the expected value for EIO as well. In any case, in view of the thermodynamic property of a phase transition, the negative thermal expansion observed in NIO can be understood in terms of the magnetovolume effect ascribable to the magnetic phase transition of the Ir moments at about .
We finally comment on the discrepancy of the previous results about the crystal structure Hasegawa et al. (2010); Sagayama et al. (2013) and electrical resistivity Yanagishima and Maeno (2001); Matsuhira et al. (2007, 2011); Ishikawa et al. (2012). One of the possible origins of these results may be attributed to the sample dependence. It is known that frustrated magnets often exhibit strong sample dependence due to the frustration among spin interactions and many-body effects. This tendency has also been found in pyrochlore oxides O7 ( rare earth ions, transition metal ions) Yanagishima and Maeno (2001); Matsuhira et al. (2007, 2011); Ishikawa et al. (2012); Kimura et al. (2011); Takatsu et al. (2012); Ross et al. (2012); Taniguchi et al. (2013); Koohpayeh et al. (2014), including NIO Yanagishima and Maeno (2001); Matsuhira et al. (2011) and EIO Ishikawa et al. (2012); Yanagishima and Maeno (2001); Matsuhira et al. (2011), as well as PIO Yanagishima and Maeno (2001); Matsuhira et al. (2011); Kimura et al. (2011), where the distribution of nonstoichiometric concentrations such as and of O7+y is thought to induce sample dependent physical properties Ishikawa et al. (2012); Kimura et al. (2011); Takatsu et al. (2012); Ross et al. (2012); Taniguchi et al. (2013); Koohpayeh et al. (2014). Even in our samples, we also observed a slight discrepancy in EIO for the previous results. For examples, the upturn of of EIO below is suppressed in our samples, as compared with the previous result in Ref. [10]: however, it should be noted here that in contrast to both results, the sample of EIO in Ref. [8] retains the metallic behavior without an any signature of the MIT. Recent studies on single crystalline samples of EIO showed that is quite sensitive to the off-stoichiometry of samples Ishikawa et al. (2012). According to this result, is expected for the previous polycrystalline sample of EIO in Ref. [10], while for our samples. Such a small distribution (% discrepancy) gives rise to a strong sample dependent physical property in these compounds. Therefore, we should take care of the sample quality for studying the frustrated pyrochlore magnets, although this problem could be a signature of exotic materials. In the present experiments, we used identical batch samples for experiments of , , and as well as the low- XRD experiments. We thus consider that present experimental results provide compatible and consistent data for the discussion about the relationship between the MIT and the structural phase transition in pyrochlore iridates, i.e., large structural changes do not occur even when the MIT is visible in the materials.
V Conclusion
We have performed the high-resolution and low-temperature X-ray diffraction experiments on polycrystalline samples of Ir2O7 ( Nd, Eu, and Pr), in order to clarify the relationship between the MIT and the crystal-structure phase transition. We confirmed that the structure symmetry of these compounds is not broken, preserving the cubic pyrochlore lattice symmetry even below the transition temperature of the MIT: K for Nd2Ir2O7 and K for Eu2Ir2O7. We also found the positive thermal expansion for Eu2Ir2O7 and Pr2Ir2O7, while the negative thermal expansion for Nd2Ir2O7, which may come from the magnetovolume effect attributed to the long-range order of Ir magnetic moments. These results suggest that the crystal-structure phase transition from the cubic pyrochlore structure, analogously to cases of 3 transition metal oxides, is not the origin of the MIT of Nd2Ir2O7 and Eu2Ir2O7. Instead, the results imply that the magnetic order of Ir moments should affect the change in the electronic state of these compounds at . Experimental studies using high-quality single crystals are important for further clarification of the origin of the MIT in pyrochlore iridates.
Acknowledgment
This work was partly supported by JSPS KAKENHI Grant Number 24740240.
References
- Lacroix et al. (2010) C. Lacroix, P. Mendels, and F. Mila, Introduction to Frustrated Magnetism (Springer, New York, 2010).
- Boldrin and Wills (2012) D. Boldrin and A. S. Wills, Advances in Condensed Matter Physics 2012, 615295 (2012).
- Machida et al. (2007) Y. Machida, S. Nakatsuji, Y. Maeno, T. Tayama, T. Sakakibara, and S. Onoda, Phys. Rev. Lett. 98, 057203 (2007).
- Machida et al. (2009) Y. Machida, S. Nakatsuji, S. Onoda, T. Tayama, and T. Sakakibara, Nature 463, 210 (2009).
- Matsuhira et al. (2013) K. Matsuhira, M. Tokunaga, M. Wakeshita, Y. Hinatsu, and S. Takagi, J. Phys. Soc. Jpn. 82, 023706 (2013).
- Disseler et al. (2013) S. M. Disseler, S. R. Giblin, C. Dhital, K. C. Lukas, S. D. Wilson, and M. J. Graf, Phys. Rev. B 87, 060403(R) (2013).
- Nakatsuji et al. (2006) S. Nakatsuji, Y. Machida, Y. Maeno, T. Tayama, T. Sakakibara, J. van Duijn, L. Balicas, J. N. Millican, R. T. Macaluso, and J. Y. Chan, Phys. Rev. Lett. 96, 087204 (2006).
- Yanagishima and Maeno (2001) D. Yanagishima and Y. Maeno, J. Phys. Soc. Jpn. 70, 2880 (2001).
- Matsuhira et al. (2007) K. Matsuhira, M. Wakeshita, R. Nakanishi, T. Yamada, A. Nakamura, W. Kawano, S. Takagi, and Y. Hinatsu, J. Phys. Soc. Jpn. 76, 043706 (2007).
- Matsuhira et al. (2011) K. Matsuhira, M. Wakeshita, Y. Hinatsu, and S. Takagi, J. Phys. Soc. Jpn. 80, 094701 (2011).
- Ishikawa et al. (2012) J. J. Ishikawa, E. C. T. O’Farrell, and S. Nakatsuji, Phys. Rev. B 85, 245109 (2012).
- Ueda et al. (2012) K. Ueda, J. Fujioka, Y. Takahashi, T. Suzuki, S. Ishiwata, Y. Taguchi, , and Y. Tokura, Phys. Rev. Lett. 109, 136402 (2012).
- Koo et al. (1998) H. J. Koo, M. H. Whangbo, and B. J. Kennedy, J. Solid State Chem. 136, 269 (1998).
- Fukazawa and Maeno (2002) H. Fukazawa and Y. Maeno, J. Phys. Soc. Jpn. 71, 2578 (2002).
- Pesin and Balents (2010) D. Pesin and L. Balents, Nature Physics 6, 376 (2010).
- Yang and Kim (2010) B. J. Yang and Y. B. Kim, Phys. Rev. B 82, 085111 (2010).
- Kargarian et al. (2011) M. Kargarian, J. Wen, and G. A. Fiete, Phys. Rev. B 83, 165112 (2011).
- Kurita et al. (2011) M. Kurita, Y. Yamaji, and M. Imada, J. Phys. Soc. Jpn. 80, 044708 (2011).
- Witczak-Krempa et al. (2010) W. Witczak-Krempa, T. P. Choy, and Y. B. Kim, Phys. Rev. B 82, 165122 (2010).
- Guo and Franz (2009) H.-M. Guo and M. Franz, Phys. Rev. Lett. 103, 206805 (2009).
- Wan et al. (2011) X. Wan, A. M. Turner, A. Vishwanath, and S. Y. Savrasov, Phys. Rev. B 83, 205101 (2011).
- Witczak-Krempa and Kim (2012) W. Witczak-Krempa and Y. B. Kim, Phys. Rev. B 85, 045124 (2012).
- Chen and Hermele (2012) G. Chen and M. Hermele, Phys. Rev. B 86, 235129 (2012).
- Go et al. (2012) A. Go, W. Witczak-Krempa, G. S. Jeon, K. Park, and Y. B. Kim, Phys. Rev. Lett. 109, 066401 (2012).
- Onoda and Tanaka (2010) S. Onoda and Y. Tanaka, Phys. Rev. Lett. 105, 047201 (2010).
- Sakata et al. (2011) M. Sakata, T. Kagayama, K. Shimizu, K. Matsuhira, S. Takagi, M. Wakeshima, and Y. Hinatsu, Phys. Rev. B 83, 041102(R) (2011).
- Tafti et al. (2012) F. F. Tafti, J. J. Ishikawa, A. McCollam, S. Nakatsuji, and S. R. Julian, Phys. Rev. B 85, 205104 (2012).
- Kim et al. (2009) B. J. Kim, H. Ohsumi, T. Komesu, S. Sakai, T. Morita, H. Takagi, and T. Arima, Science 323, 1329 (2009).
- Shitade et al. (2009) A. Shitade, H. Katsura, J. Kunes, X.-L. Qi, S.-C. Zhang, and N. Nagaosa, Phys. Rev. Lett. 102, 256403 (2009).
- Witczak-Krempa et al. (2014) W. Witczak-Krempa, G. Chen, Y. B. Kim, and L. Balents, Annu. Rev. Condens. Matter Phys. 5, 57 (2014).
- Hasegawa et al. (2010) T. Hasegawa, N. Ogita, K. Matsuhira, S. Takagi, M. Wakeshima, Y. Hinatsu, and M. Udagawa, J. Phys.: Conf. Ser. 200, 012054 (2010).
- Imada et al. (1998) M. Imada, A. Fujimori, and Y. Tokura, Rev. Mod. Phys. 70, 1039 (1998).
- Sagayama et al. (2013) H. Sagayama, D. Uematsu, T. Arima, K. Sugimoto, J. J. Ishikawa, E. O’Farrell, , and S. Nakatsuji, Phys. Rev. B 87, 100403(R) (2013).
- Watahiki et al. (2011) M. Watahiki, K. Tomiyasu, K. Matsuhira, K. Iwasa, M. Yokoyama, S. Takagi, M. Wakeshima, and Y. Hinatsu, J. Phys.: Conf. Ser. 320, 012080 (2011).
- Tomiyasu et al. (2012) K. Tomiyasu, K. Matsuhira, K. Iwasa, M. Watahiki, S. Takagi, M. Wakeshima, Y. Hinatsu, M. Yokoyama, K. Ohoyama, and K. Yamada, J. Phys. Soc. Jpn. 81, 034709 (2012).
- Yamaura et al. (2012) J. Yamaura, K. Ohgushi, H. Ohsumi, T. Hasegawa, I. Yamauchi, K. Sugimoto, S. Takeshita, A. Tokuda, M. Takata, M. Udagawa, et al., Phys. Rev. Lett. 108, 247205 (2012).
- Witczak-Krempa et al. (2013) W. Witczak-Krempa, A. Go, and Y. B. Kim, Phys. Rev. B 87, 155101 (2013).
- Goto et al. (2011) K. Goto, H. Takatsu, T. Taniguchi, and H. Kadowaki, J. Phys. Soc. Jpn. 81, 015001 (2011).
- (39) In this study, the temperature change in the lattice parameter was detected in a small error of Å . This accuracy is realized by the resolution of the absolute angle encoder, degrees, installed in the Rigaku SmartLab powder diffractometer used in this study. This means that a peak shift of the scattering angle is very precisely measured by using such diffractometer: the temperature change in can therefore be measured by precise observations of the temperature change in at an appropriate peak such as the (444) peak and the (800) peak (e.g., see insets of Figs. 4 and 5). When converting Å to the accuracy of , it is estimated as , which is different from the resolution width of and is instead supported by the resolution of the absolute angle encoder. We also note that the precision of in experiments is down to .
- Kazei et al. (1998) Z. A. Kazei, N. P. Kolmakova, A. A. Sidorenko, and L. V. Takunov, Phys. Solid State 40, 1513 (1998).
- Hirano et al. (2003) Y. Hirano, N. Wakabayashi, C. K. Loong, , and L. A. Boatner, Phys. Rev. B 67, 014423 (2003).
- Kimura et al. (2009) K. Kimura, T. Otani, H. Nakamura, Y. Wakabayashi, and T. Kimura, J. Phys. Soc. Jpn. 78, 113710 (2009).
- Melcher (1976) R. L. Melcher, Physical Acoustics Vol. 12 pp.1-77 (Academic Press, New York, 1976).
- Kimura et al. (2011) K. Kimura, Y. Ohta, and S. Nakatsuji, J. Phys. Conf. Ser. 320, 012079 (2011).
- Izumi and Momma (2007) F. Izumi and K. Momma, Solid State Phenom. 130, 15 (2007).
- Tokiwa et al. (2014) Y. Tokiwa, J. J. Ishikawa, S. Nakatsuji, and P. Gegenwart, Nature Materials 13, 356 (2014).
- Koohpayeh et al. (2014) S. M. Koohpayeh, J. J. Wen, B. A. Trump, C. L. Broholm, and T. M. McQueen, J Cryst. Growth 402, 291 (2014).
- Takatsu et al. (2012) H. Takatsu, H. Kadowaki, T. J. Sato, J. W. Lynn, Y. Tabata, T. Yamazaki, and K. Matsuhira, J. Phys.: Cond. Matt. 24, 052201 (2012).
- Ross et al. (2012) K. A. Ross, T. Proffen, H. A. Dabkowska, J. A. Quilliam, L. R. Yaraskavitch, J. B. Kycia, and B. D. Gaulin, Phys. Rev. B 86, 174424 (2012).
- Taniguchi et al. (2013) T. Taniguchi, H. Kadowaki, H. Takatsu, B. Fak, J. Ollivier, T. Yamazaki, T. J. Sato, H. Yoshizawa, Y. Shimura, T. Sakakibara, et al., Phys. Rev. B 87, 060408(R) (2013).