Stress localization, stiffening and yielding in a model colloidal gel
Abstract
We use numerical simulations and an athermal quasi-static shear protocol to investigate the yielding of a model colloidal gel. Under increasing deformation, the elastic regime is followed by a significant stiffening before yielding takes place. A space-resolved analysis of deformations and stresses unravel how the complex load curve observed is the result of stress localization and that the yielding can take place by breaking a very small fraction of the network connections. The stiffening corresponds to the stretching of the network chains, unbent and aligned along the direction of maximum extension. It is characterized by a strong localization of tensile stresses, that triggers the breaking of a few network nodes at around 30 of strain. Increasing deformation favors further breaking but also shear-induced bonding, eventually leading to a large-scale reorganization of the gel structure at the yielding. At low enough shear rates, density and velocity profiles display significant spatial inhomogeneity during yielding in agreement with experimental observations.
I Introduction
The non-linear mechanical response of gels is of great relevance to technological applications requiring unusual material properties, such as adaptability or self-healing (Sottos and Moore, 2011; Cordier et al., 2008; Yan et al., 2010), and has a crucial role in the functions of bio-materials and biological systems (Lieleg et al., 2011; Storm et al., 2005). It is the result of the non-trivial stress transmission through the gel network structure, that can allow for stress or strain localization (Schall et al., 2007), as well as complex spatial correlations, and it is far from being understood and controlled. Colloidal gels, that can form in suspensions of colloidal particles in the presence of attractive effective interactions, are particularly appealing as materials whose functions can be in principle designed at the level of the nanoscale (particle) components (Di Michele et al., 2013; Sacanna et al., 2013). In colloidal suspensions, gels can form even in extremely dilute systems via aggregation of the particles into a rich variety of network structures, that can be suitably tuned by changing the solid volume fraction, the physico-chemical environment or the processing conditions. Hence these handles could be used to design a specific complex mechanical response in addition to the selected nano-particle properties (Gibaud et al., 2013; Conrad et al., 2010).
Colloidal gels are typically very soft, but the variety of microstructures may lead to an equal variety in the mechanics, with elastic moduli spanning from up to Pa (Gisler et al., 1999; Laurati et al., 2009; Zaccone et al., 2009; Helgeson et al., 2014). The microstructural complexity may also enable adjustments of the mechanical response to the external deformation. Soft gels can be in principle made to yield relatively easily, but in certain cases a significant strain hardening has been observed before yielding finally occurs (Gisler et al., 1999; Pouzot et al., 2006). The extended non-linear behavior, reminiscent of the strain stiffening of biopolymer networks (Storm et al., 2005; Gardel et al., 2004; Arevalo et al., 2010), has been suggested to arise from the nonlinear response to elongation of the part of the colloidal gel structure that is responsible for stress-bearing.
The yielding of colloidal gels, due to breaking and reorganization of the network structure, can be accompanied by strong inhomogeneity of stresses and strains throughout the material (Picard et al., 2005; Mohraz and Solomon, 2005; Masschaele et al., 2009; Ovarlez et al., 2009; Fall et al., 2010; Rajaram and Mohraz, 2010; Fielding, 2013). In particular, the stress-bearing backbone of the gels can be relatively poorly connected or floppy, hence the imposed deformation can induce significant and non-trivial structural rearrangements prior to and during yielding. The stress necessary to yield and the amount of plastic deformation accumulated in the material upon yielding are fundamental quantities to control. They may be crucially affected by the gel restructuring, as well as by the strain rate, in a way that is far from being rationalized (Denn and Bonn, 2011). In this respect, most of theoretical and numerical works have focused on dense systems (Chaudhuri et al., 2012; Barrat and Lemaitre, 2011; Martens et al., 2011) and diluted gels have been hardly touched upon. In spite of a certain insight gained in various experiments into the phenomena associated to the non-linear mechanical response of low-density colloidal gels, further understanding has been severely hindered because information on local deformations or structural rearrangements is very difficult to obtain experimentally. Most of existing numerical studies on gel mechanics deal only with the linear response regime (Lodge and Heyes, 1999; Santos et al., 2013). Numerical methods to investigate non-linear phenomena are just under development (Swan et al., 2014) and even recent studies are limited to testing specific deformation mechanisms on artificially built structures (Seto et al., 2013; Lindstrom et al., 2012), because microscopic models able to investigate the deformation behaviour in the presence of the same forces that led to the gel structure through aggregation are fundamentally lacking.
Here we investigate the non-linear response of a colloidal gel at low volume fraction by numerical simulations of a microscopic model, that allows us to analyze the response to deformation arising from the network structure and from the same effective interactions that have driven its self-assembly. We have designed an athermal quasi-static deformation protocol, in the same spirit of recent numerical studies of deformation in amorphous solids (Tanguy et al., 2002; Maloney and Lemaître, 2006; Falk and Langer, 2011; Karmakar et al., 2010; Fiocco et al., 2013), that allows us to compute the load curve of the material at relatively low strain rates. By combining this approach with a space-resolved analysis of microscopic processes, deformations and stresses, we gain significant new insight into the non-linear response and the yielding of the gel.
II Model and Numerical Simulations
Gelation in diluted colloidal suspensions may be the result of an arrested phase separation, spinodal decomposition, or of a diffusion limited aggregation (Carpineti and Giglio, 1992; Lu et al., 2008; Gibaud and Schurtenberger, 2009; Eberle et al., 2011). To capture all the complexity of these phenomena is challenging and a number of particle-based models for gel formation have been devised in the last few years including short-range isotropic interactions (Charbonneau and Reichman, 2007; Tanaka and Araki, 2007; Foffi et al., 2005), valence-limited and patchy-particle models (Kern and Frenkel, 2003; Sciortino and Zaccarelli, 2011; Bianchi et al., 2011) and anisotropic effective interactions (Del Gado and Kob, 2005; Saw et al., 2009; Del Gado and Kob, 2010).
We follow here this latter approach, using an effective interaction that includes, in the form of a three-body term, the basic ingredients for a minimal model of particle gels. In fact dilute colloidal gels are characterized by open and thin network structures, where particle coordination can be very low, hence the network connections need to be fairly rigid to support at least their own weight. Experiments have proven that bonds between the colloidal particles can indeed support significant torques (Dibble et al., 2008; Ohtsuka et al., 2008; Pantina and Furst, 2005; Dinsmore et al., 2006). In our model at low volume fractions the particles self-assemble into a thin open structure, mechanically stable and locally rigid thanks to the anisotropic interactions (Colombo et al., 2013; Colombo and Del Gado, 2014). The relatively simple gel structure certainly does not capture all the structural complexity of these materials but it allows us to rationalize the connection between structure, local processes and mechanics. In this respect we consider that the particles in our model gel can be thought of as single colloidal particles in the case of very diluted stringy gels or else as chunks or aggregates that are assembled into the gel structure in the thicker gels which typically result from phase separation.
Our system consists of identical particles with position vectors , interacting via the potential energy
| (1) |
where , sets the energy scale and represents the particle diameter. Typical values for a colloidal system are and , being the Boltzmann constant and the room temperature (Trappe et al., 2001; Prasad et al., 2003; Laurati et al., 2011). The two-body term consists of a repulsive core complemented by a narrow attractive well:
| (2) |
The three-body term confers angular rigidity to the inter-particle bonds:
| (3) |
The range of the three-body interaction is equal to two particle diameters, as ensured by the radial modulation
| (4) |
The potential energy (1) depends parametrically on the dimensionless quantities , , , , . We have chosen these parameters such that for the particles start to self-assemble into a persistent particle network. The data here discussed refer to , , , , , one convenient choice to realize this condition.
We have extensively investigated the self-assembly of the gel at rest and performed a spatially resolved analysis of its cooperative microscopic dynamics in previous works (Colombo et al., 2013; Colombo and Del Gado, 2014). At low volume fractions () the network consists of chains of particles connected by crosslinks (or nodes, i.e. the branching points) as, due to local rigidity, the particles form mainly or bonds each. Density fluctuations do not show any sign of a phase separation close to gelation. Nevertheless, the gel is characterized by the coexistence of poorly connected regions, i.e. regions with a lower local density of crosslinks, where major structural rearrangements tend to take place, and densely connected domains (i.e. regions where the local density of crosslinks is higher) where internal stresses tend to concentrate. We have shown that local bond breaking processes, driven by thermal fluctuations and relaxation of internal stresses, have non-local consequences and induce structural rearrangements relatively far away along the gel network structure. The structural heterogeneity, the long range spatial correlations underlying the cooperative dynamics and the heterogeneous distribution of internal stresses in our model capture some fundamental physical characteristics of colloidal gel networks (Maccarrone et al., 2010), that probably have a major role in their complex mechanical response. Here we investigate the behavior of this model gel network under deformation, from the linear elastic behavior to the gel yielding.
All simulations were performed using the LAMMPS molecular dynamics source code (Plimpton, 1995), which we have suitably extended to include the interaction (1). The gel consists of particles in a cubic simulation box with linear size such that the dimensionless number density equals . This corresponds to an approximate volume fraction of . We use periodic boundary conditions in the Lees-Edwards formulation (Lees and Edwards, 1972), which is compatible with shear deformations.
The starting point of our study is a gel configuration equilibrated at , whose structure and relaxation dynamics have been already thoroughly characterized. At this temperature thermal fluctuations alone may cause breaking of single inter-particle bonds, although they are not sufficient to destroy the gel structure within a reasonably large simulation time window. Hence, when the material is subjected to shear deformation it displays an elastic response that is only very weakly dependent on the shear rate, within a relatively wide range of shear rates (Colombo et al., 2013).
Here we investigate the behaviour of the gel at large deformation strains, beyond the linear response regime. In particular we want to unravel the interplay between the internal stresses and the imposed deformation. In order to focus on the microscopic processes which are induced by the deformation and to distinguish them from thermal processes, we consider that the depth of the attractive potential well acting on the particles bonded in the network is much larger than the thermal energy . To capture these conditions we perform athermal simulations (i.e., at zero temperature) using the following damped molecular dynamics:
| (5) |
where is the particle mass and the coefficient of friction. As a first step we quench the initial gel configuration (i.e., the one equilibrated at finite temperature) down to zero temperature by running a simulation with the damped dynamics (5) until the kinetic energy drops to a negligible fraction (less than ) of its initial value. The resulting configuration is a local minimum of the potential energy, or inherent structure (Stillinger and Weber, 1984). Starting from the inherent structure we perform a series of incremental strain steps in simple shear geometry. Each step increases the cumulative shear strain by a quantity and comprises two phases. During the first phase we apply an instantaneous affine deformation , corresponding to simple shear in the plane, to all particles:
| (6) |
The Lees-Edwards boundary conditions are updated as well to comply with the increase in the cumulative strain. During the second phase of the strain step we relax the affinely deformed configuration by letting the system free to evolve in time while keeping the global strain constant:
| (7) |
is the time evolution operator for the damped dynamics (5) and a specified time interval .
Upon repeating the two phases for steps, the cumulative strain equals and the gel configuration is
| (8) |
where denotes the configuration of the starting inherent structure.
The procedure just outlined corresponds to the athermal quasistatic (AQS) approach extensively used to investigate the deformation behavior of amorphous solids (Tanguy et al., 2002; Maloney and Lemaître, 2006), with the following difference: while in the quasistatic case the relaxation of the affinely deformed configuration is performed directly in the potential energy landscape via an energy minimization, here we follow a more natural dynamics of the system (with viscous energy dissipation) for a prescribed time interval . As a consequence, we work at a finite shear rate , while the quasistatic case corresponds to the limit , i.e. . In our model system direct energy minimization schemes such as the steepest descent or conjugate gradient methods are not very effective, presumably because the potential energy landscape is characterized by extended relatively flat regions corresponding to floppy deformation modes of the gel (Alexander, 1998; Wyart et al., 2008; Rovigatti et al., 2011).
Disregarding effects due to the particle inertia, the microscopic dynamics (5) introduce a natural time scale , corresponding to the time it takes a particle subjected to a typical force to move a distance equal to its size. This is the relevant unit time scale here, since we refer to a system where and the characteristic time for particle diffusion is much longer than the simulation time window. Hence we express times and rates referring to this natural unit of time. Along this line, can be used to define a modified Péclet number , that quantifies the possibility for the gel particles to rearrange under the effect of internal forces while being sheared at a shear rate .
The time step for the integration of the equation of motion equals . Fixing the elementary strain increment , we shear the gel for strain steps up to a final strain . We vary the relaxation interval in order to obtain three different values of the effective shear rate: , , and . In a typical aqueous solution of colloidal particles with a diameter nm and an interaction energy (Koumakis and Petekidis, 2011) the characteristic time is s; in such a system the three shear rates we have investigated would correspond to 0.2 , 1.0 and 10 , respectively (in all cases the modified Péclet number ).
At the end of each strain step we compute the global stress tensor ( stand for the cartesian components ) using the virial definition in the formulation introduced by Thompson et al. (2009), which is valid for arbitrary many-body potentials in the presence of periodic boundary conditions. Since the velocities of the particles are small ( for all shear rates) we ignore in the calculation of the stress tensor the kinetic term , as well as any effect of the viscous drag appearing in Eq. (5). Moreover, in order to characterize the spatial stress distribution inside the gel we divide the simulation box in cubical sub-cells, and associate to each cell a local stress tensor . The local stresses are defined by grouping the contributions to the global virial in space: each cell receives the contributions of the interactions involving the particles located inside the cell. This is a convenient way of estimating the spatial variation of the state of stress in the material (Thompson et al., 2009). We divide the box in 40x40x40 cells, so that each cell contains on average about eight particles.
During the shearing we also monitor the degree of non-affinity of the microscopic particle displacements, i.e. the extent to which the local deformation departs from the one imposed at a global level. If the deformation were completely affine, at the end of -th strain step the position vector of particle would correspond to ; we therefore introduce the average (per particle) non-affine displacement , as a measure of the non affinity accumulated after steps:
| (9) |
With the approach just described we obtain the load curve of the material at different shear rates and analyze the underlying microscopic processes, in terms of local stresses and strains and of structural modifications of the gel.
III Load curve: stiffening and yielding
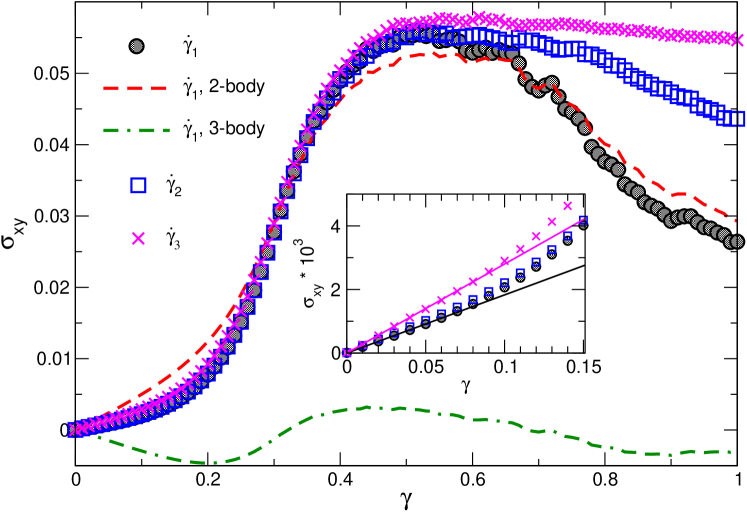
In Fig. 1 we plot the load curve of the gel, i.e. the average stress as a function of the imposed cumulative strain obtained in a system of particles with the procedure described above, for the three shear rates , and (indicated with the circles, squares and crosses, respectively). The data show that a first linear elastic behavior is followed, for deformations larger than , by a stiffening of the material. The stress increase with evolves toward a maximum around , which we define as a yielding point: after yielding the stresses progressively decrease with the imposed deformation.
This type of load curve is qualitatively very similar to the ones typically measured in colloidal gels (Laurati et al., 2011; Pouzot et al., 2006; Gisler et al., 1999). It is also reminiscent, to a certain extent, of the behaviour characterising different biopolymer networks, from collagen to actin (Storm et al., 2005).
The elastic regime extends over a maximum of of strains (see inset of Fig. 1), in agreement with experimental observations. We can extract a small, but finite shear modulus (), which increases mildly for the highest shear rate. For a typical colloidal gel where the particle diameter nm and the interaction energy , this corresponds to a shear modulus Pa, which is consistent with what measured in experiments on a few dilute colloidal gel networks (Koumakis and Petekidis, 2011; Laurati et al., 2011; Gisler et al., 1999). We have distinguished in Fig. 1 the contributions to stresses due to the two- and three-body interactions (respectively dashed and dashed-dotted lines) in the case of the low shear rate . The data show that the main contribution opposing the shear forces is due to the two-body, cohesive forces, as expected. The contribution of the bending forces to the stresses, instead, is negative in sign for and becomes positive for . Hence for small and moderate deformation, at the beginning of the stiffening regime, bending forces tend to push in the direction of the shear: this could be due to the unbending of initially compressed chains of the gels along the shear direction. Around , instead, the bending forces start to resist to shear and their contribution increases with deformation up to the end of the stiffening regime, suggesting that for higher deformation, until the material yields, most of the chains are stretched out. Therefore, at this point, the bending forces should mainly oppose the shear deformation acting at the level of the network crosslinks. In addition, the plot also shows that the 2-body contribution to the stress becomes clearly predominant with the onset of the non-linear regime, suggesting that the stiffening we detect is directly related to the stretching of the extensible interparticle bonds. This possible scenario points to further similarities between the mechanical response of our colloidal gel and the one of biopolymer networks, where the stiffening regime is ascribed to the shear deformation pulling on the stretched out biopolymers and has been also related to the presence of negative normal stresses (Jamney et al., 2007). Our gel is indeed under tension along the direction that corresponds to the velocity gradient under shear (), hence it would contract if volume changes were allowed in the simulations. In Fig. 1 we can also compare the data obtained at different shear rates: within the range investigated here, the elastic and stiffening regimes do not significantly vary with varying the shear rate, whereas the yielding regime is significantly modified. In particular, the higher the shear rate, the higher the level of the shear stresses kept in the material upon yielding. This finding is consistent with the yielding arising from the development of plastic processes in the materials, whose amount and/or extent is affected by the shear rate of the deformation applied.
In most cases the experimental investigations we are referring to are based on oscillatory rheology. We have therefore tested the picture just obtained through the new numerical protocol proposed here by performing a set of simulations under oscillatory conditions. The details of the oscillatory rheology study are reported in Appendix A and its results are in good agreement with the ones discussed so far. In addition to the linear regime, we have also investigated the non-linear one following (Hyun et al., 2011; van der Vaart et al., 2013; Ewoldt et al., 2008) and computed the third-order viscoelastic coefficients as well as a set of Lissajous-Bowditch plots. This quantitative analysis confirms that the increase of the stresses in the non-linear regime is dominated by the elastic contributions and that the material is strain stiffening.
With the aim of investigating the microscopic interplay between deformation and internal stresses underlying the load curve, we have monitored in our simulations the bond breaking and formation. In Fig. 2 we plot the total fraction of bonds broken and formed together with the load curve for the lowest () and intermediate () shear rates.
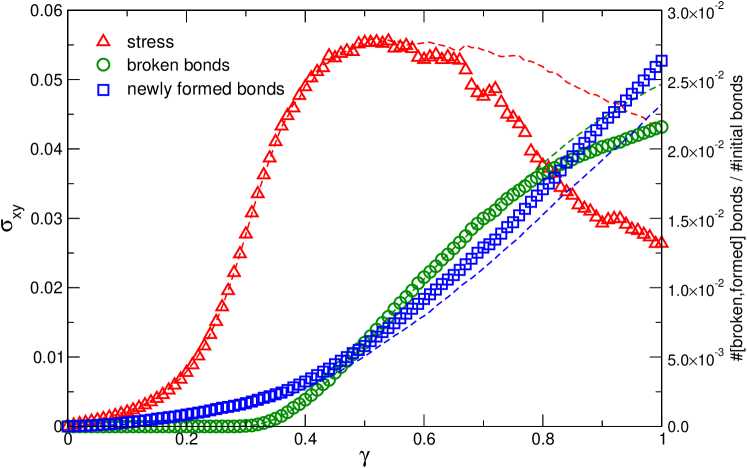
One can immediately recognize that up to , i.e. well into the non-linear stiffening regime, the deformation does induce some bond formation (although very limited) but does not break any bond. This is consistent with the picture sketched above, where the onset of the stiffening must be related to the shear deformation pulling on the stretched network chains. Beyond , the deformation starts to break bonds: because also corresponds to the change in sign of the contribution to the shear stress of the bending forces (see Fig. 1), this finding suggests that the bonds that are first broken have a specific role in stress transmission within the gel structure. Finally, around , once the fraction of broken bonds becomes of the order of, or overcomes, the fraction of newly formed ones, the yielding process sets in. When comparing the data obtained with the different shear rates, one can see that yielding reached at lower is characterised by lower shear stresses and corresponds to comparatively less broken bonds and more newly induced ones. That higher shear rates deformation may break more bonds is to be expected, but that lower levels of shear stress, obtained upon yielding at lower shear rate, correspond to comparatively more bonds formed is somewhat counter-intuitive: one would rather think, in fact, that forming more bonds would allow to recover part of the network strength and to sustain higher stresses. The picture emerging from our data is therefore that bonds formed upon yielding play quite a different role for stress bearing with respect to the gel connections at rest, suggesting that a significant reorganization of the gel structure is taking place.
In order to unravel the microscopic origin of the mechanical behavior of our model colloidal gel and test the scenarios hypothesized above, in the following we exploit further the information contained in the simulation data and perform a space-resolved analysis of the stresses and the deformations in the material.
IV Space-resolved analysis of stresses and deformations
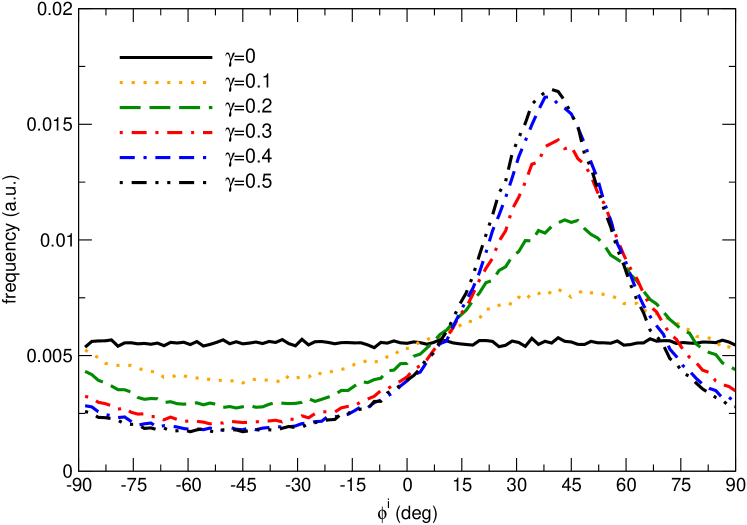
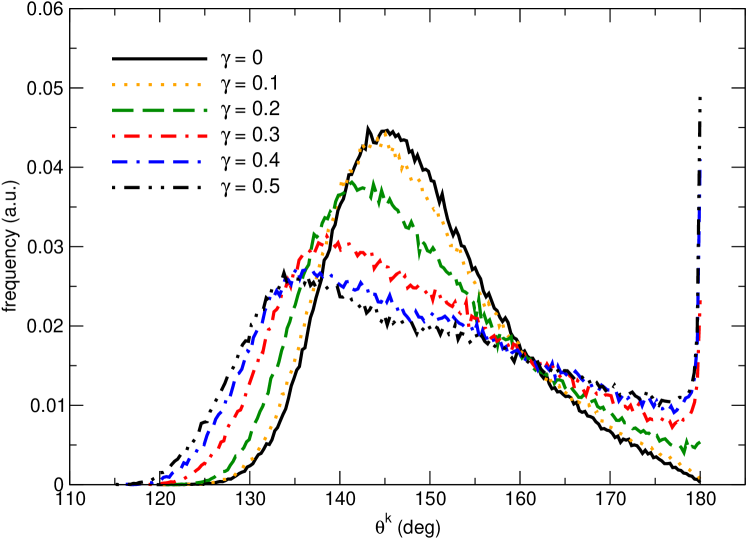
For the local stress tensor computed as explained in Section II, we define the local axis of principal tension, , as the normalized eigenvector corresponding to its largest positive eigenvalue (we take to fix an arbitrary orientation). The direction of the local tension is quantified by the angle between the projection of onto the plane of shear () and the positive axis. For each particle having two neighbors, i.e. each particle that is not a crosslink, we then consider the angle defined by , and being the two neighbors of the particle, i.e. the angle formed by the two bonds departing from the particle. These angles approach in a fully stretched chain. In Figs. 3 and 4 we plot the histograms obtained for and over the whole gel, at different values of the deformation.
The data show that, upon increasing the deformation, the non-linear stiffening regime corresponds indeed to a progressive alignment of shear stresses, causing the appearance of a peak in the histogram shown in Fig. 3. The position of the peak, i.e. the most likely orientation of the principal tension, coincides for small strain with the direction of the extensional axis of shear, namely degrees, and, at higher strains, deviates to slightly smaller angles (e.g. to about degrees at ). This deviation can be understood by considering the effect of the deformation on an initially uniform distribution of angles at , as explained in Appendix B. The data presented in Fig. 4 also reveal that the stress alignment corresponds indeed to the progressive stretching of the extensible bonds in the network chains, with a set of fully stretched chains appearing and further growing beyond . These results clarify the similarity with the non-linear mechanical behaviour of biopolymer networks (Storm et al., 2005). Finally, the histograms of and values measured across the gel network indicate that the breaking of network connections () takes place only once that the alignment of stresses and chains has grown enough to produce fully stretched chains.
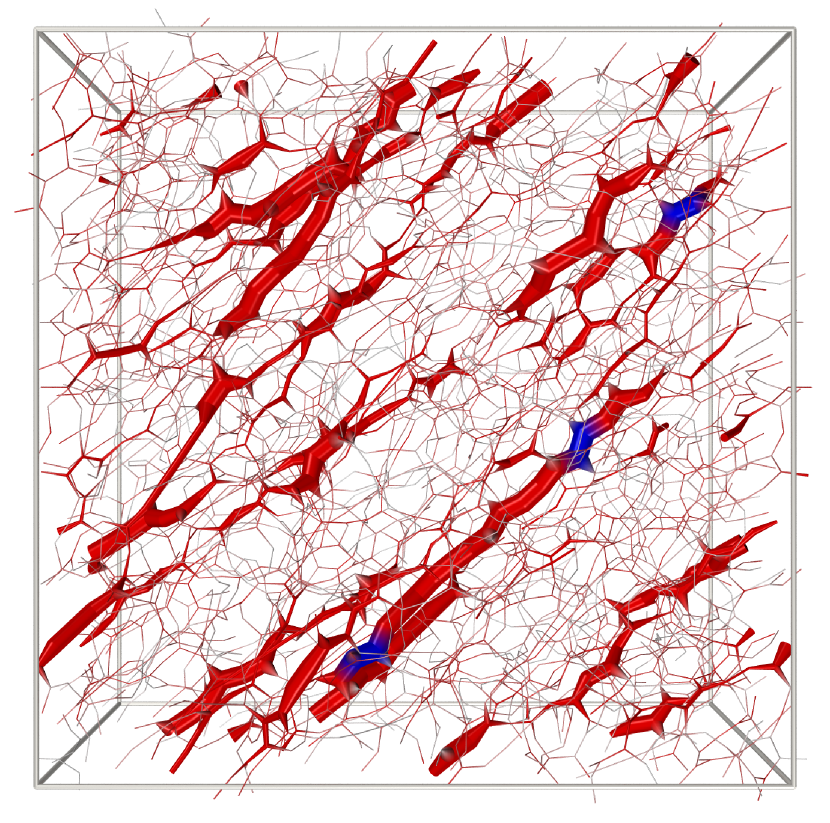
By analysing the spatial distribution of stresses in the simulation snapshots at different deformation we can clearly recognise that stress intensity becomes significantly heterogeneous upon increasing the deformation beyond the linear elastic regime. The stiffening regime corresponding to the progressive stress alignment and chain stretching shown in Figs. 3 and 4 is accompanied by a strong localization of shear stresses, whose intensity progressively concentrates on very few chains amounting to a very small part of the network structure. An example is given in Fig. 5, that shows a snapshot of the gel network at a shear deformation of : in the figure, bonded particles in the gel are represented by segments of thickness proportional to the intensity of local stresses. Most of the stresses produced by the deformation are in fact localized on very few chains: identifying the bonds subjected to the highest stresses allows us to predict where breaking events will occur (blue bonds in the figure). The emerging picture supports the scenario hypothesized in Section III and unravels the microscopic mechanisms underlying it: the stiffening of the gel is indeed due to the shear deformation pulling on the over-stretched parts of the network structure and corresponds to a progressive localization of stresses. The stress concentration eventually leads to breaking of the over-stressed bonds and triggers the yielding of the material. A previous study performed on the spontaneous relaxation dynamics of the gel has shown that tensile stresses tend to concentrate in regions of the material with higher density of crosslinks (Colombo et al., 2013). In agreement with that finding, here we see that bonds participating to crosslinks are the ones that preferentially break also under deformation.
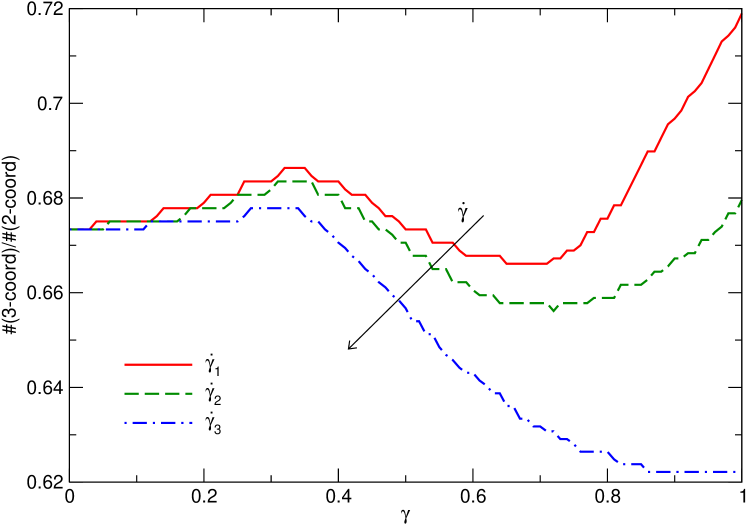
In Section III, the bond breaking and formation under increasing deformation (shown in Fig. 2) suggested that yielding might be associated to significant restructuring of the gel network, because the bonds created under deformation do not necessarily contribute to bearing larger stresses in this regime. To further investigate this point, we have analyzed in detail which type of bonds are formed under shear. At first sight, bond breaking and formation under shear may seem quite similar to the ones leading to the formation of the gel at rest and controlled by thermal fluctuations: only two- and three-coordinated particles are produced, i.e. the same types of connections favored by the effective interactions (see Eq. (1)) at rest. Nevertheless, a closer look reveals important differences, as shown in Fig. 6, where we plot the fraction of crosslinks, with respect to two-coordinated particles, as deformation increases. For the lowest shear rate considered here, the data show that after an initial slight increase, the fraction of crosslinks decreases as bond breaking proceeds, and eventually increases again for . The relative amount of crosslinks attained upon yielding diminishes with increasing the shear rate and, for the highest shear rate explored, instead, it keeps decreasing to a final value that is lower than the one in the initial gel. These results, combined with the load curves obtained at different shear rates and shown in Fig. 2, indicate that, upon decreasing the shear rate, there is an increasing amount of excess crosslinks that are created for deformations . This corresponds to a decrease of the shear stresses attained in the material at the same deformation. Hence the crosslinks created under shear do not contribute to the stress bearing part of the material structure. This observation suggests that the onset of yielding corresponds to a significant structural reorganisation of the gel.
To obtain a quantitative spatially resolved analysis, we have computed spatial correlations of local density fields at different deformation amplitudes. Using the local particle density field
| (10) |
where is the step function and is a coarse-graining radius (we omit the dependence on for notational convenience), we compute the spatial correlation function
| (11) |
With the aim of evaluating the range of spatial correlation, here for simplicity we consider its spherical average (in view of the strain induced anisotropy, one can also expand the angular part for a uniaxial symmetry around the direction of maximum extension and evaluate higher order terms that become non negligible upon increasing the deformation amplitude). We also consider the coarse-grained crosslink density field
| (12) |
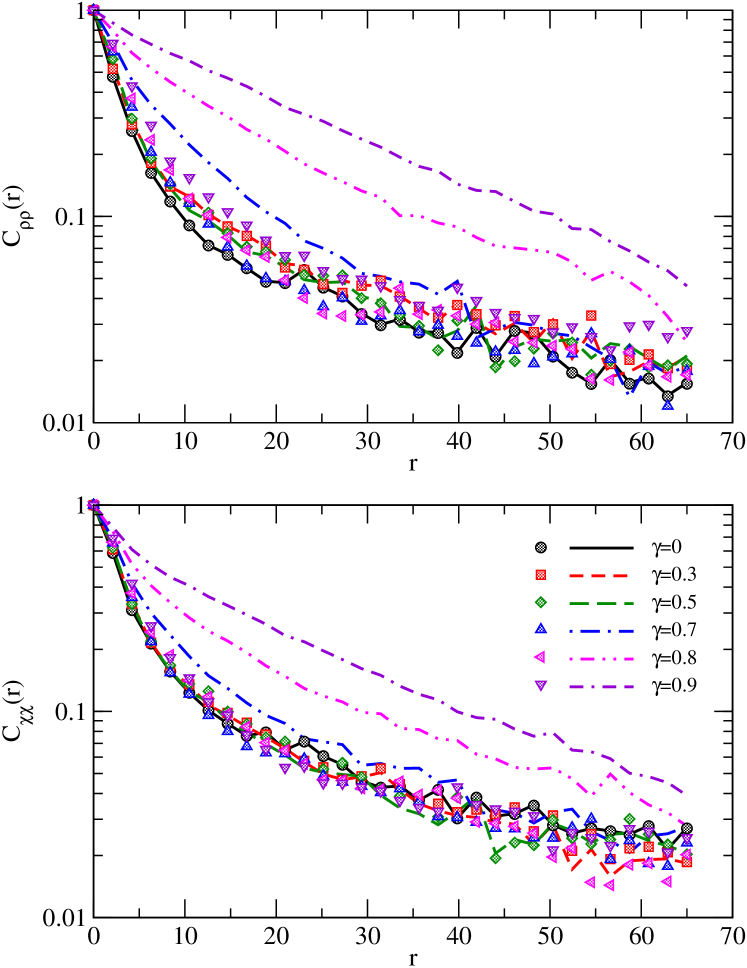
where if particle is a crosslink, otherwise, and its spatial correlation function . We plot the density correlation function in the upper panel of Fig. 7. Here we have chosen the coarse-graining radius and verified that this choice does not significantly affect the results. The curves refer to various levels of strain for a deformation at small shear rate (, lines) and for one at high shear rate (, symbols). In the linear and stiffening regimes () the correlation function changes little, meaning that no major restructuring is taking place. On the contrary, the range of increases visibly after yielding () at low shear rate, indicating the appearance of extended domains whose density is different from the average one. A comparable restructuring does not happen at high shear rate: the range of the correlation function barely increases even after yielding. The spatial correlation function of the crosslink density, depicted in the lower panel of Fig. 7, shows the same features.
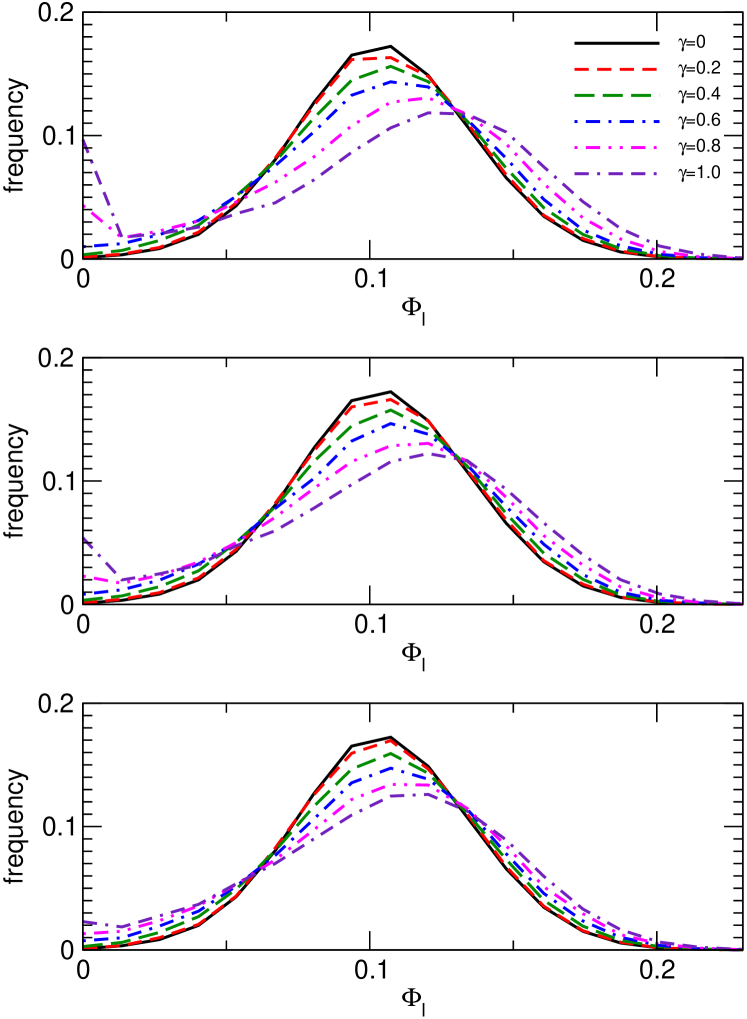
To more directly unravel the restructuring in the gel upon yielding we have monitored the local particle volume fraction, by dividing the simulation box in 40x40x40 sub-volumes and computing the effective volume fraction in each of them for different deformations. In Fig. 8 we plot the histogram of values in the gel, obtained for different and for the three shear rates considered here. The histogram measured in the gel at rest is symmetric and of course centered around the value of the total volume fraction. Upon increasing the deformation, the data becomes asymmetric, the maximum moves to higher values of the volume fraction and indicates the presence of extended empty regions. One can also recognize that this difference in the local volume fraction in the yielding gel decreases significantly upon increasing the shear rate, especially the empty regions tend to become hardly detectable. These findings suggest that during the yielding regime, and possibly in the non-linear regime at lower deformations, microscopic plastic processes can take place in the gel, as well as local rearrangements that do not necessarily follow the imposed deformation. To better elucidate this point, in the following we will quantify non-affine displacements and irreversible processes.
V Non-affine displacements and residual stresses
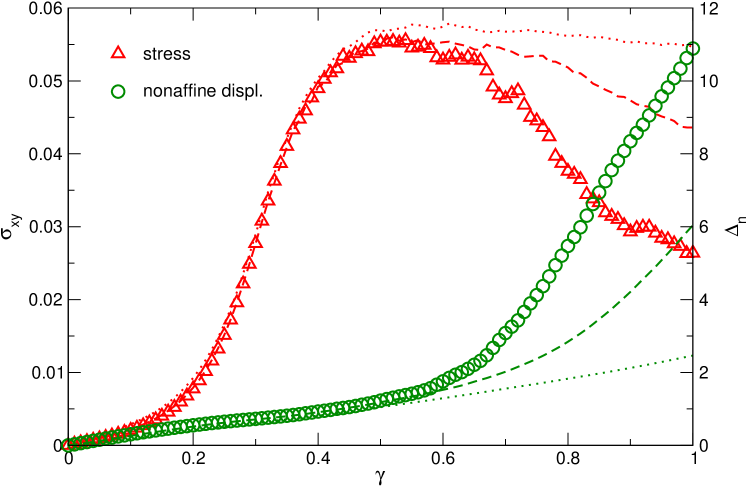
We compute , the average magnitude of particle non-affine displacements with respect to the initial configuration as explained at the end of Section II. In Fig. 9 we plot this quantity, averaged over all particles, as a function of , together with the load curve obtained at different shear rates. Interestingly, one can see that non-affine displacements are already present at low deformation, in the linear elastic regime and in the stiffening one, before any bond breaking is observed. These non-affine displacements, detected at relatively small strains and not associated to plastic processes, are apparently not affected by the shear rate and are probably due to the extended floppy modes of the gel structure (Alexander, 1998; Rovigatti et al., 2011), similarly, to a certain extent, to what hypothesized for semiflexible polymer gels (Head et al., 2003; Heussinger and Frey, 2006; Lieleg et al., 2007). We notice that here the increase of non-affine displacement with the strain does not seem to change between the linear elastic and the stiffening regimes. Once parts of the gel structure start to break and the yielding sets in, instead, the magnitude of non-affine displacements dependence on the strain changes qualitatively: its increase becomes much faster and depends strongly on the shear rate, with higher shear rates significantly reducing the non-affine displacements.
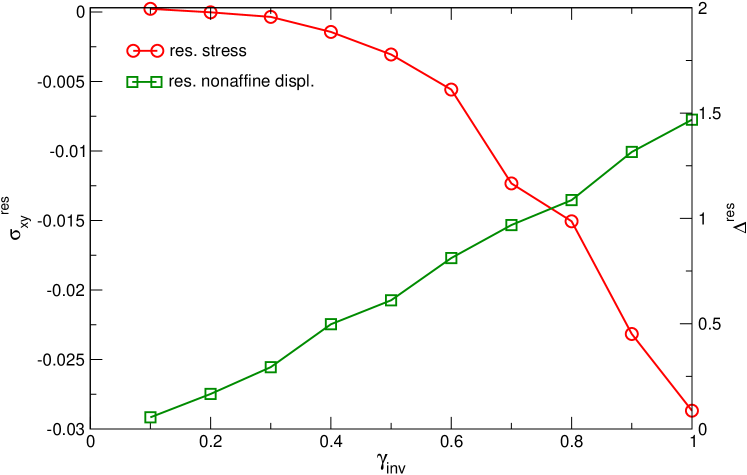
In order to investigate the connection between nonaffine displacements and plasticity, we use the following procedure. Starting from the undeformed gel configuration (), we shear the gel at the lowest shear rate up to a prescribed inversion strain . Then, we invert the direction of shearing and, with the same rate , we bring the gel back to zero strain. At this point we measure the stress in the material, which we call residual stress , and the nonaffine displacement with respect to the initial configuration—the residual nonaffine displacement . In Fig. 10 the residual stresses and the residual non-affine displacement magnitude, accumulated up to the deformation , are plotted as a function of . The data confirm that, up to , where bond breaking under deformation starts, there is no significant macroscopic plasticity in the material. Whereas non-affine displacements continuously increase as a function of the deformation amplitude, once that deformation starts to induce breaking of the gel structure, the residual stresses increase rapidly with the deformation applied. Hence the end of the stiffening regime and the yielding correspond indeed to a non-negligible plasticity in the material response, consistent with the shear rate dependence shown by the formation of excess crosslinks and by the change in the local volume fraction (see Figs. 6 and 8). These findings suggest that the plastic behavior of the material is intimately related to the mesoscale reorganization of the gel structure under shear, that accompanies its yielding. We have seen that this corresponds to the appearance of regions with significantly higher and significantly lower solid volume fraction, with respect to the initial microstructure. We would like now to analyze the effect of this micro-structural changes on the local deformations.
VI Shear banding
The non-affine displacement plot in Fig. 9 suggests that in the yielding regime the deformation of the gel might depart significantly from a homogeneous shear flow, the more so the smaller the shear rate is. The local density histograms in Fig. 8, by showing that in the same regime some regions of the system densify while others are depleted of particles, point to the same fact. It is indeed well known that many soft materials (including foams, emulsions and colloidal suspensions) behaving as yield stress fluids exhibit heterogeneous yielding dynamics (Masschaele et al., 2009; Ovarlez et al., 2009; Fall et al., 2010; Rajaram and Mohraz, 2010; Gibaud et al., 2010). These often take the form of shear bands, regions of unequal shear rate coexisting in the material at a common value of the shear stress (Schall and van Hecke, 2009; Møller et al., 2008); they can be either transient, marking the transition to a homogeneous flow, or permanent (Martin and Hu, 2012; Fielding, 2013).
In order to investigate whether the yielding of our model system might be associated to such mechanical inhomogeneities, we compute during each strain step a displacement profile, by evaluating the average particle displacement in the direction of shear () as a function of the gradient direction (). More precisely, we divide the simulation box in slabs of width , being the box size, along the gradient coordinate () and compute in each slab the component of the average particle displacement occurring in the -th strain step:
| (13) |
where the summation extends to all particles that at the end of the step are found inside the slab, and represents their number.
The displacement profile may be interpreted as a velocity profile upon dividing by the duration of the elementary strain step. We report in Fig. 11 the displacement profiles for selected values of the cumulative shear strain ; the three panels refer to different values of the strain rate, from low (, top) to high (, bottom). For ease of visualization and comparison we plot displacements relatively to the displacement of the bottom layer, so that equals zero for all curves.
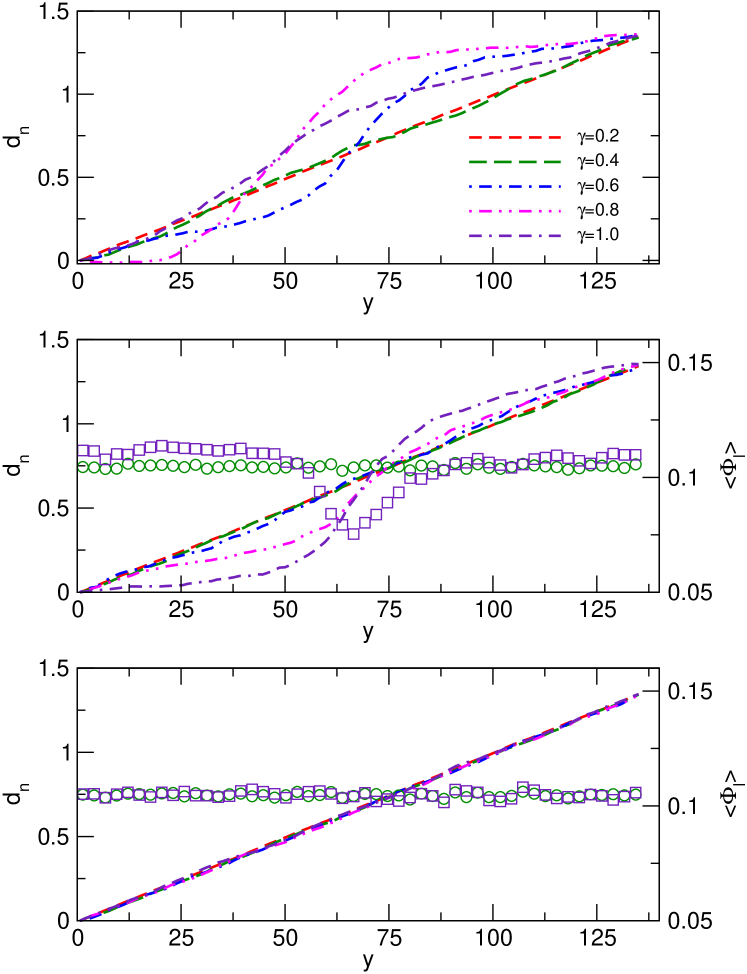
Before any yielding occurs () the profiles are linear regardless of the strain rate, meaning that the deformation is macroscopically homogeneous. Of course even in this regime there exist microscopic displacements that are non-affine; nonetheless, the average deformation in the direction of shear follows the overall imposed gradient without any macroscopic inhomogeneity (i.e. inhomogeneity comparable in size to the system size). In the case of the high strain rate (, bottom panel) this is so even in the yielding regime, presumably because the gel does not have time to significantly rearrange between one strain step and another and major inhomogeneities cannot develop. On the contrary, in the case of the lower strain rates the average deformation profiles develop, upon yielding, inhomogeneities on length scales comparable to the system size, i.e. shear bands. Because of the periodic boundary conditions used in the simulations, the profiles are bound to have the same slope at the bottom and at the top of the box, but, apart from this, they are reminiscent of the ones typically measured in experiments (Divoux et al., 2012). It can also be observed that, in the case of the lowest shear rate (, top panel) the bands develop earlier () than in the case of the intermediate rate (, middle panel, where bands appear at ). This finding seems to fit in with recent experimental investigations in systems displaying transient shear banding, in which the authors found that the duration of the transient bands is inversely proportional to the magnitude of the strain rate (Divoux et al., 2010). It is also consistent with the results of numerical simulations in dense jammed suspensions in Chaudhuri et al. (2012).
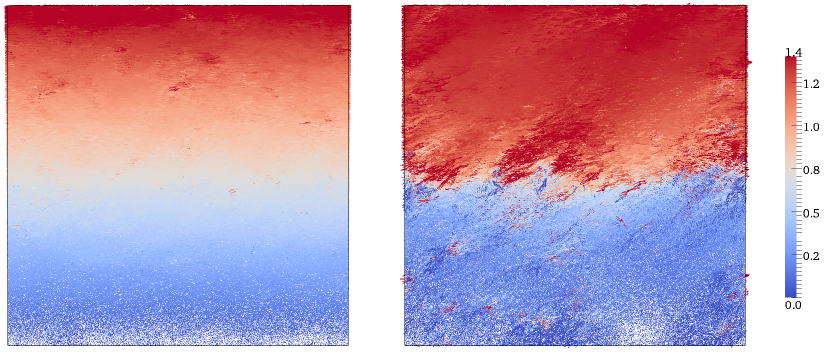
In Fig. 12 we present spatial maps of particle displacements, providing additional evidence for the existence of shear bands. We project all the particles onto the plane of shearing () and represent the displacement of each particle in a given strain step as an arrow; the color of the arrow varies with the component of the displacement, from small (blue) to large (red). The two maps refer to different values of the cumulative strain: in the left map, whereas in the right map; in both cases the gel is being sheared at the lowest strain rate (). While in the first case the displacement field increases at constant rate from bottom to top, in the second case the rate of variation in the middle of the box is much faster, giving rise to a shear band.
We end this section by discussing only briefly the microscopic origin of shear banding in our model gel. A thorough analysis of this phenomenon requires a deeper investigation that is out of the scope of this paper. Future work will be devoted, for example, also to analyze whether in our model system shear bands are transient, eventually leading to a homogeneous flow profile, or permanent, in the context of the experiments (Divoux et al., 2010). Figure 8 suggests that in the present system shear banding couples to the fluctuations in the local density of particles. Figure 11 shows that this is indeed the case: the open symbols appearing in the second and third panels show the gel density profile along the gradient direction obtained in the same way as the displacement profile. It is apparent that shear banding correlates with inhomogeneities in the density profile: the layers of lower density are also the layers where the higher displacement gradients appear. The emerging scenario is that, beyond the stiffening regime and as yielding sets in, deformation induces density fluctuations that are absent at rest and gradually lead to the formation of colloid-rich and colloid-poor regions in the gel. Shear induced bond formation results into an excess of crosslinks in denser regions, that are therefore presumably stiffer. Nevertheless, these localized excess crosslinks do not necessarily reinforce the stress-bearing backbone of the gel. On the contrary, the presence of extended colloid-poor domains leads to an overall lower average stress and probably helps developing a slip plane (see Fig. 12) and the shear banding. Another possibility is instead that the shear banding develops earlier and induces the fluctuations in the local density of the gel. Elucidating this point calls for further work, but it seems very likely that the two phenomena are strongly coupled and reinforce each other.
Another important point is the role of hydrodynamics, which is not included in our simulations. Because the phenomena we are focusing on develop upon lowering the shear rate and the modified Péclet number , we expect that the scenario described here is not qualitatively modified by the presence of hydrodynamic interactions. Nevertheless, they could well play a role in the major reorganisation of the gel upon yielding, especially for higher shear rates (Bergenholtz et al., 2002), hence including hydrodynamics in this type of study, although still challenging, would be extremely interesting.
VII Conclusions
We have investigated the mechanical response of a model colloidal gel under shear, with a new numerical procedure that allows to follow deformations at relatively low shear rates. Moreover, differently from most existing numerical studies, we do not impose an artificial gel structure nor specific microscopic processes: the gel network and its mechanical response are the result of the interplay between the same effective interactions that stabilize the gel structure at rest and the imposed shear deformation. The effective interactions include a bending rigidity for the colloidal bonds and lead to the formation of a soft solid at relatively low solid volume fractions in a colloidal suspension, consistent with experimental observation. The load curve of the gel displays, after an initial linear elastic response for deformation amplitudes , a significant stiffening and, at , a final yielding. By means of a space-resolved analysis of stresses and deformations in the gel network, we have shown that the strain hardening corresponds first to a progressive alignment of stresses and stretching of parts of the structure (the chains or less connected parts of the gel network) along the direction of maximum extension under shear, and eventually to the shear deformations pulling on the over-stretched chains. This phenomenon is qualitatively similar to the strain stiffening typical of biopolymer networks. We also find that the strain hardening of the gel is accompanied by an increasing stress localization, with the highest stress magnitude concentrating in few parts of the structure, where eventually, starting from , breaking occurs. Because of the strong localization of stresses in the material, a small fraction of broken bonds is sufficient to trigger the yielding. Once yielding sets in, we observe the arising of shear induced density fluctuations in the gel, that seems to coarsen into colloid-rich and colloid-poor domains. This phenomenon is apparently coupled to the onset of significant strain inhomogeneities in the material that can be related to a shear banding, very similar to what observed in recent experiments. We have been able to elucidate here that the strain-induced reorganization of the gel and the shear banding are accompanied by an excess of crosslinks that are formed preferentially in the denser regions and therefore increase only the local stiffness of those domains, but not the overall capacity of the yielded gel to support higher stresses. This phenomenon is reminiscent of shear induced structural changes in other gels, that might arise from the imposed deformations acting differently on softer and stiffer domains (Onuki, 1992), and it might also have some similarities with the coupling between shear deformations and density fluctuations proposed for complex fluids (Milner, 1993; Schmitt et al., 1995; Fielding and Olmsted, 2003) or with the rupture of the material (Mohraz and Solomon, 2005). The shear induced density fluctuations, the shear banding and the final level of stress attained in the gel upon yielding are strongly affected by the shear rate. Higher shear rates do not allow for rearrangements of the gel that can accommodate local changes in density, as signaled by a decreasing amount of non-affine displacements: this limits density fluctuations and the shear induced bond formation, resulting in higher stresses attained upon yielding.
Overall this study has offered new, significant insight into the behavior, under deformation, of soft solids and in particular of colloidal gel networks. On the one hand, the results discussed here give, for the first time, a microscopic physical picture of how phenomena like stiffening, yielding and shear banding may occur in these materials. On the other, they highlight issues such as the stress localization or the feedback between density fluctuations and shear banding or strain inhomogeneities that have been hardly addressed in numerical studies in spite of being probably ubiquitous in experimental observations. Our numerical investigation and methodology have therefore interesting potential to complement experiments and lead to new theoretical development in this area of research.
VIII Acknowledgments
The authors thank for insightful discussions Daniel Blair, Thibaut Divoux, Sudeep Dutta, David Head, Sébastien Manneville, Peter Olmsted and Dimitris Vlassopoulos. This work was supported by Swiss National Science Foundation (SNSF) (Grants No. PP00P2_126483/1).
Appendix A Oscillatory rheology
We have performed a limited set of simulations under oscillatory conditions on a gel sample with 4000 particles. The shear strain was modulated periodically according to the equation , with a fixed angular frequency and a strain amplitude increasing from 1% to 30% in 1% steps. The value of the angular frequency was chosen such that the maximum rate of deformation falls within the range of shear rates () investigated for the steady shear startup in the main text. The discrete-step deformation protocol that we have used for the steady shear simulations is not readily applicable to an oscillatory setup. We have instead used for this purpose the following equations of motion:
| (14) |
where is a unit vector along the axis. For the integration of the equations of motion we have used the same timestep as in the steady shear simulations; the shear strain and the Lees-Edwards boundary conditions were updated at each simulation step. By monitoring the time evolution of the shear stress one can extract the -th order viscoelastic coefficients and , , in the following way:
| (15) | ||||
| (16) |
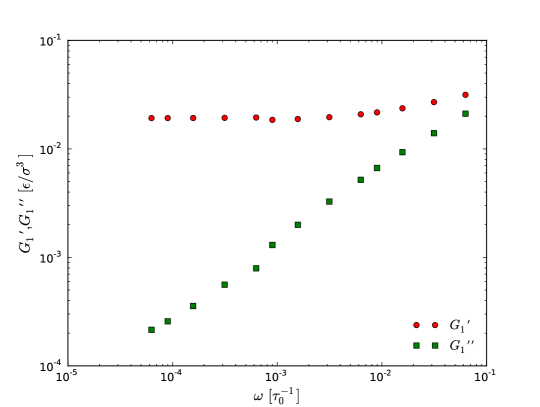
at steady state the result is independent of the choice of the time instant . In Fig. 13 we show the results of the frequency sweeps performed with , in the linear response regime, showing that increases linearly with and the values of are consistent with the ones measured in the steady shear protocol. We plot in Fig. 14 the first-order storage and loss moduli, and , as a function of the strain amplitude . An inspection of the plot confirms the set of features that we could already identify from the stress-strain curves in steady shear conditions. The gel behaves as a solid material (), with a storage modulus that is roughly constant () in the range .
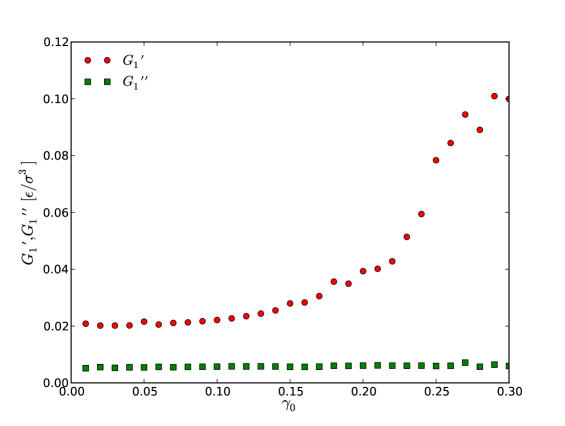
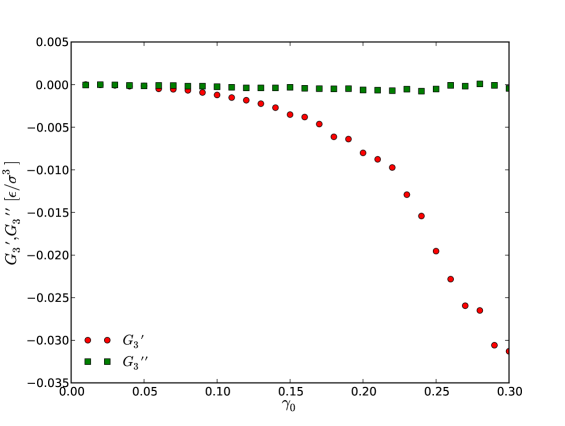
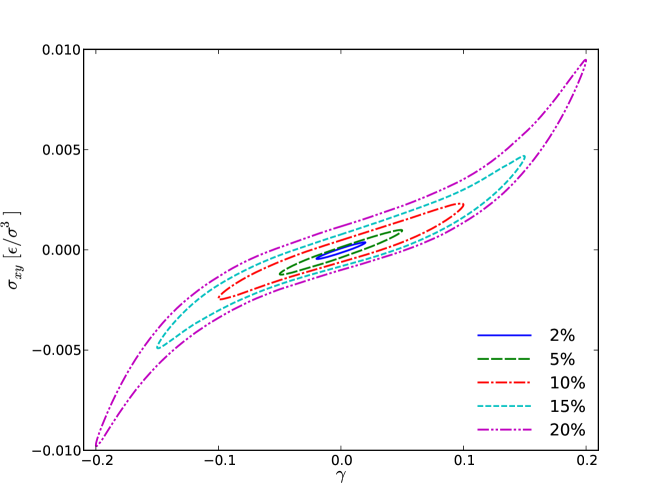
After this initial linear regime, the gel undergoes a pronounced stiffening: the storage modulus increases with the strain amplitude , whereas the loss modulus is constant. To further characterize the nonlinear regime we have also calculated the third-order viscoelastic coefficients and , which we plot in Fig. 15. The third-order coefficient becomes progressively more negative, a behavior that characterizes strain-stiffening materials (see for instance Ewoldt, Hosoi and McKinley, J. Rheol. 52, 1427 (2008)), whereas the nonlinear loss modulus is essentially zero. Finally, we present in Fig. 16 a set of Lissajous-Bowditch plots, i.e. plots of shear stress vs. shear strain under oscillatory conditions, for different values of the strain amplitude . While for small the curves are ellipses, signaling a linear viscoelastic response, for larger deformations intra-cycle strain stiffening is clearly visible, without any apparent increase in the dissipation. The physical picture for the nonlinear regime that we get from these results is completely consistent with the one resulting from the steady shear startup simulations reported in the main text.
Appendix B Alignment of the interparticle bonds with increasing strain
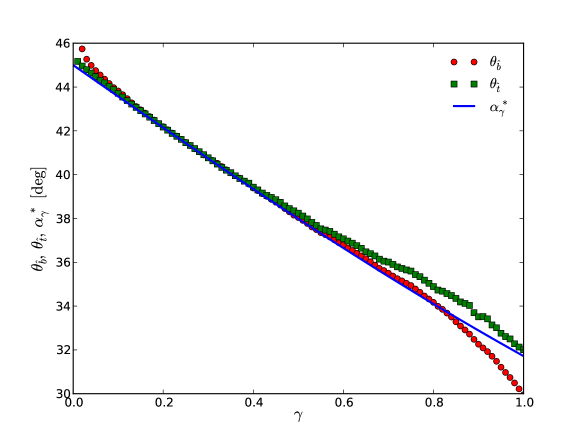
The most likely orientation of the principal tension shown in Fig. 3 begins at (i.e. the direction of the extensional axis of shear), but systematically deviates to smaller angles with increasing strain (e.g. to about at ). We can rationalize this observation as follows.
(a) The most likely stress orientation follows the most likely bond orientation. We already know from the stress decomposition shown in Fig. 1 that an important part of the stress—most of it in the stiffening regime—is borne by the stretching of the interparticle bonds. It is therefore reasonable to expect that the direction along which the material can sustain the largest tension correspond to the most likely orientation of the interparticle bonds. We define the most likely bond orientation as in the following:
| (17) |
where runs over the set of the interparticle bonds. Similarly, as already stated in Sec. IV we define the direction of principal tension as the normalized eigenvector corresponding to the largest (positive) eigenvalue of the global stress tensor . We further denote by (resp. ) the angle that the projection onto the plane of the vector (resp. ) forms with the positive axis; we take (resp. ) to fix an orientation. In Fig. 17 we plot and as a function of the shear strain for the lowest shear rate : the two quantities are indeed close to each other. Note that the two match perfectly in the stiffening regime, confirming that bond stretching is the mechanically most relevant process to be considered there.
(b) The most likely bond orientation begins at 45∘ for small strain, but deviates to lower angles with increasing strain. This feature has a purely geometrical origin and can be explained by a simple argument. Consider an interparticle bond whose projection onto the plane forms in the undeformed gel configuration () an angle with the positive axis (we fix again an orientation by requiring that the component of the bond vector be positive). After a purely affine deformation the same bond vector will be characterized by a new angle given by
| (18) |
where is the shear strain. If is the distribution of bond angles in the undeformed configuration, the distribution of angles after the deformation will be
| (19) |
If we now assume that the initial distribution is uniform ( constant), by maximizing the right hand side of the previous equation with respect to we find that the angle distribution in the deformed configuration will be peaked around the value given by
| (20) |
This function starts at for , but systematically deviates to smaller angles with increasing shear strain (it approaches 0 for ). The prediction (expressed in degrees) is represented in Fig. 17 by the full line: even though the real deformation is not completely affine, the outcome of this simple argument explains the data quite well, especially in the stiffening regime.
References
- Alexander (1998) Alexander, S., “Amorphous solids: their structure, lattice dynamics and elasticity,” Physics Reports 296, 65 (1998).
- Arevalo et al. (2010) Arevalo, R. C., J. S. Urbach, and D. L. Blair, “Size-dependent rheology of type-I collagen networks,” Biophysical journal 99(8), L65–L67 (2010).
- Barrat and Lemaitre (2011) Barrat, J.-L., and A. Lemaitre, Heterogeneities in amorphous systems under shear in Dynamical Heterogeneities in Glasses, Colloids, and Granular Media - International Series of Monographs on Physics, edited by L. Berthier, G. Biroli, J.-P. Bouchaud, L. Cipelletti and W. van Saarloos (Oxford University Press, 2011).
- Bergenholtz et al. (2002) Bergenholtz, J., J. F. Brady, and M. Vicic, “The non-newtonian rheology of dilute colloidal suspensions,” Journal of Fluid Mechanics 456, 239–275 (2002).
- Bianchi et al. (2011) Bianchi, E., R. Blaak, and C. N. Likos, “Patchy colloids: state of the art and perspectives,” Phys. Chem. Chem. Phys. 13, 6397–6410 (2011).
- Carpineti and Giglio (1992) Carpineti, M., and M. Giglio, “Spinodal-type dynamics in fractal aggregation of colloidal clusters,” Phys. Rev. Lett. 68, 3327–3330 (1992).
- Charbonneau and Reichman (2007) Charbonneau, P., and D. R. Reichman, “Phase behavior and far-from-equilibrium gelation in charged attractive colloids,” Phys. Rev. E 75, 050401 (2007).
- Chaudhuri et al. (2012) Chaudhuri, P., L. Berthier, and L. Bocquet, “Inhomogeneous shear flows in soft jammed materials with tunable attractive forces,” Phys. Rev. E 85, 021503 (2012).
- Colombo and Del Gado (2014) Colombo, J., and E. Del Gado, “Self-assembly and cooperative dynamics of a model colloidal gel network,” Soft Matter 10, 4003–4015 (2014).
- Colombo et al. (2013) Colombo, J., A. Widmer-Cooper, and E. Del Gado, “Microscopic picture of cooperative processes in restructuring gel networks,” Phys. Rev. Lett. 110, 198301 (2013).
- Conrad et al. (2010) Conrad, J., H. Wyss, V. Trappe, S. Manley, K. Miyazaki, L. Kaufman, A. Schofield, D. Reichman, and D. Weitz, “Arrested fluid-fluid phase separation in depletion systems: Implications of the characteristic length on gel formation and rheology,” Journal of Rheology (1978-present) 54(2), 421–438 (2010).
- Cordier et al. (2008) Cordier, P., F. Tournilhac, C. Soulie-Ziakovic, and L. Leibler, “Self-healing and thermoreversible rubber from supramolecular assembly,” Nature 451, 977 (2008).
- Del Gado and Kob (2005) Del Gado, E., and W. Kob, “Structure and relaxation dynamics of a colloidal gel,” Europhys. Lett. 72, 1032 (2005).
- Del Gado and Kob (2010) Del Gado, E., and W. Kob, “A microscopic model for colloidal gels with directional effective interactions: network induced glassy dynamics,” Soft Matter 6(7), 1547–1558 (2010).
- Denn and Bonn (2011) Denn, M., and D. Bonn, “Issues in the flow of yield-stress liquids,” Rheologica Acta 50(4), 307–315 (2011).
- Di Michele et al. (2013) Di Michele, L., F. Varrato, J. Kotar, S. H. Nathan, G. Foffi, and E. Eiser, “Multistep kinetic self-assembly of dna-coated colloids,” Nature Communications 4, 2007 (2013).
- Dibble et al. (2008) Dibble, C. J., M. Kogan, and M. J. Solomon, “Structural origins of dynamical heterogeneity in colloidal gels,” Phys. Rev. E 77, 050401 (2008).
- Dinsmore et al. (2006) Dinsmore, A. D., V. Prasad, I. Y. Wong, and D. A. Weitz, “Microscopic structure and elasticity of weakly aggregated colloidal gels,” Phys. Rev. Lett. 96, 185502 (2006).
- Divoux et al. (2010) Divoux, T., D. Tamarii, C. Barentin, and S. Manneville, “Transient shear banding in a simple yield stress fluid,” Phys. Rev. Lett. 104, 208301 (2010).
- Divoux et al. (2012) Divoux, T., D. Tamarii, C. Barentin, S. Teitel, and S. Manneville, “Yielding dynamics of a herschel–bulkley fluid: a critical-like fluidization behaviour,” Soft Matter 8(15), 4151–4164 (2012).
- Eberle et al. (2011) Eberle, A. P. R., N. J. Wagner, and R. Castañeda Priego, “Dynamical arrest transition in nanoparticle dispersions with short-range interactions,” Phys. Rev. Lett. 106, 105704 (2011).
- Ewoldt et al. (2008) Ewoldt, R. H., A. E. Hosoi, and G. H. McKinley, “New measures for characterizing nonlinear viscoelasticity in large amplitude oscillatory shear,” Journal of Rheology (1978-present) 52(6) (2008).
- Falk and Langer (2011) Falk, M. L., and J. Langer, “Deformation and failure of amorphous, solidlike materials,” Annual Review of Condensed Matter Physics 2(1), 353–373 (2011).
- Fall et al. (2010) Fall, A., J. Paredes, and D. Bonn, “Yielding and shear banding in soft glassy materials,” Phys. Rev. Lett. 105, 225502 (2010).
- Fielding (2013) Fielding, S. M., “Shear banding in soft glassy materials,” ArXiv e-prints, arXiv:1309.3422 [cond-mat.soft] (2013).
- Fielding and Olmsted (2003) Fielding, S. M., and P. D. Olmsted, “Early stage kinetics in a unified model of shear-induced demixing and mechanical shear banding instabilities,” Phys. Rev. Lett. 90, 224501 (2003).
- Fiocco et al. (2013) Fiocco, D., G. Foffi, and S. Sastry, “Oscillatory athermal quasistatic deformation of a model glass,” Phys. Rev. E 88, 020301 (2013).
- Foffi et al. (2005) Foffi, G., C. De Michele, F. Sciortino, and P. Tartaglia, “Arrested phase separation in a short-ranged attractive colloidal system: A numerical study,” The Journal of chemical physics 122, 224903 (2005).
- Gardel et al. (2004) Gardel, M. L., J. H. Shin, F. C. MacKintosh, L. Mahadevan, P. Matsudaira, and D. A. Weitz, “Elastic behavior of cross-linked and bundled actin networks,” Science 304(5675), 1301–1305 (2004).
- Gibaud et al. (2010) Gibaud, T., D. Frelat, and S. Manneville, “Heterogeneous yielding dynamics in a colloidal gel,” Soft Matter 6(15), 3482–3488 (2010).
- Gibaud and Schurtenberger (2009) Gibaud, T., and P. Schurtenberger, “A closer look at arrested spinodal decomposition in protein solutions,” Journal of Physics: Condensed Matter 21(32), 322201 (2009).
- Gibaud et al. (2013) Gibaud, T., A. Zaccone, E. Del Gado, V. Trappe, and P. Schurtenberger, “Unexpected decoupling of stretching and bending modes in protein gels,” Phys. Rev. Lett. 110, 058303 (2013).
- Gisler et al. (1999) Gisler, T., R. C. Ball, and D. A. Weitz, “Strain hardening of fractal colloidal gels,” Phys. Rev. Lett. 82, 1064–1067 (1999).
- Head et al. (2003) Head, D. A., A. J. Levine, and F. C. MacKintosh, “Distinct regimes of elastic response and deformation modes of cross-linked cytoskeletal and semiflexible polymer networks,” Phys. Rev. E 68, 061907 (2003).
- Helgeson et al. (2014) Helgeson, M. E., Y. Gao, S. E. Moran, J. Lee, M. Godfrin, A. Tripathi, A. Bose, and P. S. Doyle, “Homogeneous percolation versus arrested phase separation in attractively-driven nanoemulsion colloidal gels,” Soft matter 10(17), 3122–3133 (2014).
- Heussinger and Frey (2006) Heussinger, C., and E. Frey, “Floppy modes and nonaffine deformations in random fiber networks,” Phys. Rev. Lett. 97, 105501 (2006).
- Hyun et al. (2011) Hyun, K., M. Wilhelm, C. O. Klein, K. S. Cho, J. G. Nam, K. H. Ahn, S. J. Lee, R. H. Ewoldt, and G. H. McKinley, “A review of nonlinear oscillatory shear tests: Analysis and application of large amplitude oscillatory shear (laos),” Progress in Polymer Science 36(12), 1697 – 1753 (2011).
- Jamney et al. (2007) Jamney, P. A., M. E. McCormick, S. Rammensee, J. L. Leight, P. C. Georges, and F. C. MacKintosh, “Negative normal stress in semiflexible biopolymer gels,” Nature Materials 6(1), 48–51 (2007).
- Karmakar et al. (2010) Karmakar, S., E. Lerner, I. Procaccia, and J. Zylberg, “Statistical physics of elastoplastic steady states in amorphous solids: Finite temperatures and strain rates,” Phys. Rev. E 82, 031301 (2010).
- Kern and Frenkel (2003) Kern, N., and D. Frenkel, “Fluid cfluid coexistence in colloidal systems with short-ranged strongly directional attraction,” The Journal of Chemical Physics 118(21) (2003).
- Koumakis and Petekidis (2011) Koumakis, N., and G. Petekidis, “Two step yielding in attractive colloids: transition from gels to attractive glasses,” Soft Matter 7(6), 2456 (2011).
- Laurati et al. (2011) Laurati, M., S. Egelhaaf, and G. Petekidis, “Nonlinear rheology of colloidal gels with intermediate volume fraction,” J. Rheol. 55(3), 673 (2011).
- Laurati et al. (2009) Laurati, M., G. Petekidis, N. Koumakis, F. Cardinaux, A. B. Schofield, J. M. Brader, M. Fuchs, and S. U. Egelhaaf, J. Chem. Phys. 130, 134907 (2009).
- Lees and Edwards (1972) Lees, A., and S. Edwards, “The computer study of transport processes under extreme conditions,” Journal of Physics C: Solid State Physics 5(15), 1921 (1972).
- Lieleg et al. (2007) Lieleg, O., M. M. A. E. Claessens, C. Heussinger, E. Frey, and A. R. Bausch, “Mechanics of bundled semiflexible polymer networks,” Phys. Rev. Lett. 99, 088102 (2007).
- Lieleg et al. (2011) Lieleg, O., J. Kayser, G. Brambilla, L. Cipelletti, and A. R. Bausch, “Slow dynamics and internal stress relaxation in bundled cytoskeletal networks,” Nature Materials 10(3), 236 (2011).
- Lindstrom et al. (2012) Lindstrom, S. B., T. E. Kodger, J. Sprakel, and D. A. Weitz, “Structures, stresses, and fluctuations in the delayed failure of colloidal gels,” Soft Matter 8, 3657–3664 (2012).
- Lodge and Heyes (1999) Lodge, J. F. M., and D. M. Heyes, “Rheology of transient colloidal gels by brownian dynamics computer simulation,” Journal of Rheology (1978-present) 43(1), 219–244 (1999).
- Lu et al. (2008) Lu, P. J., E. Zaccarelli, F. Ciulla, A. B. Schofield, F. Sciortino, and D. A. Weitz, “Gelation of particles with short-range attraction,” Nature 453, 499 (2008).
- Maccarrone et al. (2010) Maccarrone, S., G. Brambilla, O. Pravaz, A. Duri, M. Ciccotti, J. M. Fromental, E. Pashkovski, A. Lips, D. Sessoms, V. Trappe, and L. Cipelletti, “Ultra-long range correlations of the dynamics of jammed soft matter,” Soft Matter 6(21), 5514–5522 (2010).
- Maloney and Lemaître (2006) Maloney, C. E., and A. Lemaître, “Amorphous systems in athermal, quasistatic shear,” Physical Review E 74(1), 016118 (2006).
- Martens et al. (2011) Martens, K., L. Bocquet, and J.-L. Barrat, “Connecting diffusion and dynamical heterogeneities in actively deformed amorphous systems,” Phys. Rev. Lett. 106, 156001 (2011).
- Martin and Hu (2012) Martin, J. D., and Y. T. Hu, “Transient and steady-state shear banding in aging soft glassy materials,” Soft Matter 8(26), 6940–6949 (2012).
- Masschaele et al. (2009) Masschaele, K., J. Vermant, and J. Fransaer, “Direct visualization of yielding in model two-dimensional colloidal gels subjected to shear flow,” J. Rheol. 53, 1437 (2009).
- Milner (1993) Milner, S. T., “Dynamical theory of concentration fluctuations in polymer solutions under shear,” Phys. Rev. E 48, 3674–3691 (1993).
- Mohraz and Solomon (2005) Mohraz, A., and M. J. Solomon, “Orientation and rupture of fractal colloidal gels during start-up of steady shear flow,” Journal of Rheology (1978-present) 49(3) (2005).
- Møller et al. (2008) Møller, P. C. F., S. Rodts, M. A. J. Michels, and D. Bonn, “Shear banding and yield stress in soft glassy materials,” Phys. Rev. E 77, 041507 (2008).
- Ohtsuka et al. (2008) Ohtsuka, T., C. P. Royall, and H. Tanaka, “Local structure and dynamics in colloidal fluids and gels,” Europhys. Lett. 84, 46002 (2008).
- Onuki (1992) Onuki, A., “Scattering from deformed swollen gels with heterogeneities,” J. Phys. II France 2, 45 (1992).
- Ovarlez et al. (2009) Ovarlez, G., S. Rodts, X. Chateau, and P. Coussot, “Phenomenology and physical origin of shear localization and shear banding in complex fluids,” Rheologica Acta 48(8), 831–844 (2009).
- Pantina and Furst (2005) Pantina, J., and E. Furst, “Elasticity and critical bending moment of model colloidal aggregates,” Phys. Rev. Lett. 94(13), 138301 (2005).
- Picard et al. (2005) Picard, G., A. Ajdari, F. m. c. Lequeux, and L. Bocquet, “Slow flows of yield stress fluids: Complex spatiotemporal behavior within a simple elastoplastic model,” Phys. Rev. E 71, 010501 (2005).
- Plimpton (1995) Plimpton, S., “Fast parallel algorithms for short–range molecular dynamics,” J. Comp. Phys. 117, 1–19 (1995).
- Pouzot et al. (2006) Pouzot, M., T. Nicolai, L. Benyahia, and D. Durand, “Strain hardening and fracture of heat-set fractal globular protein gels,” Journal of Colloid and Interface Science 293(2), 376 – 383 (2006).
- Prasad et al. (2003) Prasad, V., V. Trappe, A. D. Dinsmore, P. N. Segre, L. Cipelletti, and D. A. Weitz, “Rideal lecture. Universal features of the fluid to solid transition for attractive colloidal particles,” Faraday Discuss. 123, 1 (2003).
- Rajaram and Mohraz (2010) Rajaram, B., and A. Mohraz, “Microstructural response of dilute colloidal gels to nonlinear shear deformation,” Soft Matter 6, 2246–2259 (2010).
- Rovigatti et al. (2011) Rovigatti, L., W. Kob, and F. Sciortino, “The vibrational density of states of a disordered gel model,” The Journal of chemical physics 135, 104502 (2011).
- Sacanna et al. (2013) Sacanna, S., M. Korpics, K. Roriguez, L. Colón-Melendez, S.-Y. Kim, D. J. Pine, and G.-R. Yi, “Shaping colloids for self-assembly,” Nature Communications 4, 1688 (2013).
- Santos et al. (2013) Santos, P. H. S., O. H. Campanella, and M. A. Carignano, “Effective attractive range and viscoelasticity of colloidal gels,” Soft Matter 9, 709–714 (2013).
- Saw et al. (2009) Saw, S., N. Ellegaard, W. Kob, and S. Sastry, “Structural relaxation of a gel modeled by three body interactions,” Phys. Rev. Lett. 103(24), 248305 (2009).
- Schall and van Hecke (2009) Schall, P., and M. van Hecke, “Shear bands in matter with granularity,” Annual Review of Fluid Mechanics 42(1), 67 (2009).
- Schall et al. (2007) Schall, P., D. A. Weitz, and F. Spaepen, “Structural rearrangements that govern flow in colloidal glasses,” Science 318(5858), 1895–1899 (2007).
- Schmitt et al. (1995) Schmitt, V., C. M. Marques, and F. m. c. Lequeux, “Shear-induced phase separation of complex fluids: The role of flow-concentration coupling,” Phys. Rev. E 52, 4009–4015 (1995).
- Sciortino and Zaccarelli (2011) Sciortino, F., and E. Zaccarelli, “Reversible gels of patchy particles,” Current Opinion in Solid State and Materials Science 15(6), 246–253 (2011).
- Seto et al. (2013) Seto, R., R. Botet, M. Meireles, G. K. Auernhammer, and B. Cabane, “Compressive consolidation of strongly aggregated particle gels,” Journal of Rheology (1978-present) 57(5), 1347–1366 (2013).
- Sottos and Moore (2011) Sottos, N., and J. S. Moore, “Material chemistry: Spot on healing,” Nature 472, 299 (2011).
- Stillinger and Weber (1984) Stillinger, F. H., and T. A. Weber, “Packing structures and transitions in liquids and solids,” Science 225(4666), 983–989 (1984).
- Storm et al. (2005) Storm, C., J. J. Pastore, F. C. MacKintosh, T. Lubensky, and P. A. Jamney, “Nonlinear elasticity in biological gels,” Nature 435(7039), 191–194 (2005).
- Swan et al. (2014) Swan, J. W., R. N. Zia, and J. F. Brady, “Large amplitude oscillatory microrheology,” Journal of Rheology (1978-present) 58(1), 1–41 (2014).
- Tanaka and Araki (2007) Tanaka, H., and T. Araki, “Spontaneous coarsening of a colloidal network driven by self-generated mechanical stress,” EPL (Europhysics Letters) 79(5), 58003 (2007).
- Tanguy et al. (2002) Tanguy, A., J. Wittmer, F. Leonforte, and J.-L. Barrat, “Continuum limit of amorphous elastic bodies: A finite-size study of low-frequency harmonic vibrations,” Physical Review B 66(17), 174205 (2002).
- Thompson et al. (2009) Thompson, A. P., S. J. Plimpton, and W. Mattson, “General formulation of pressure and stress tensor for arbitrary many-body interaction potentials under periodic boundary conditions,” The Journal of Chemical Physics 131, 154107 (2009).
- Trappe et al. (2001) Trappe, V., V. Prasad, L. Cipelletti, P. Segre, and D. Weitz, “Jamming phase diagram for attractive particles,” Nature 411(6839), 772 (2001).
- van der Vaart et al. (2013) van der Vaart, K., Y. Rahmani, R. Zargar, Z. Hu, D. Bonn, and P. Schall, “Rheology of concentrated soft and hard-sphere suspensions,” Journal of Rheology (1978-present) 57(4) (2013).
- Wyart et al. (2008) Wyart, M., H. Liang, A. Kabla, and L. Mahadevan, “Elasticity of floppy and stiff random networks,” Phys. Rev. Lett. 101, 215501 (2008).
- Yan et al. (2010) Yan, C., A. Altunbas, T. Yucel, R. P. Nagarkar, J. P. Schneider, and D. J. Pochan, “Injectable solid hydrogel: mechanism of shear-thinning and immediate recovery of injectable -hairpin peptide hydrogels,” Soft Matter 6, 5143 (2010).
- Zaccone et al. (2009) Zaccone, A., H. Wu, and E. Del Gado, “Elasticity of arrested short-ranged attractive colloids: Homogeneous and heterogeneous glasses,” Phys. Rev. Lett. 103, 208301 (2009).