Self-assembly and cooperative dynamics of a model colloidal gel network
Abstract
We study the assembly into a gel network of colloidal particles, via effective interactions that yield local rigidity and make dilute network structures mechanically stable. The self-assembly process can be described by a Flory-Huggins theory, until a network of chains forms, whose mesh size is on the order of, or smaller than, the persistence length of the chains. The localization of the particles in the network, akin to some extent to caging in dense glasses, is determined by the network topology, and the network restructuring, which takes place via bond breaking and recombination, is characterized by highly cooperative dynamics. We use and Molecular Dynamics as well as Langevin Dynamics and find a qualitatively similar time dependence of time correlations and of the dynamical susceptibility of the restructuring gel. This confirms that the cooperative dynamics emerge from the mesoscale organization of the network.
I Introduction
Gels are disordered elastic materials that can form also via reversible aggregation and even in extremely diluted particles suspensions Trappe et al. (2001); Lu et al. (2008). Their heterogeneous microscopic structure—a particle network holding the solvent therein—is the result of the complex interplay of aggregation, phase separation and arrested kinetics and the stress transmission through it under deformation is far from trivial. Although being able to design the smart mechanics of these fascinating materials at the level of their nanoscale components could be ground-breaking for several technological applications Di Michele et al. (2013); Sacanna et al. (2013); Yan et al. (2010); Capone et al. (2012), there is still little theoretical understanding of the physical mechanisms underlying the development of their mechanical response. The elastic moduli and the mechanical strength are not only determined by the solvent-mediated effective interactions between the primary particles, but are also affected by the mesoscale organization of the network and its topology: local rigidity, connectivity and degree of heterogeneity of the structure can vary a lot depending on the system and on the arrest conditions that eventually lead to gelation. Various internal deformation modes, in particular the soft ones, depending on the network topology, may dominate the elastic response Alexander (1998); Widmer-Cooper et al. (2008); Wyart et al. (2008). The nonlinear behavior is also a hallmark of the mechanics of these materials Laurati et al. (2011); Grest et al. (2000). Nonaffine microscopic deformations of the weakly connected structure certainly play an important role, but here also the possible restructuring of the gel network has to be taken into account. It has been suggested that breaking of weakly connected parts of the gel structure may be determinant for the nonlinear response Koumakis and Petekidis (2011); Laurati et al. (2011) and that their sudden breaking or recombination produces its structural aging Bouchaud and Pitard (2001); Cipelletti et al. (2003). Investigations of the microscopic dynamical processes indicate slow cooperative dynamics very similar to the ones of dense glassy systems Cipelletti et al. (2003); Duri and Cipelletti (2006); Fierro et al. (2008); Del Gado and Kob (2007a); Saw et al. (2009) and the dynamical heterogeneities observed in various studies have also been connected to several aspects of the formation of the gel structure Gado and Kob (2008); Del Gado and Kob (2005). The link between structural features, microscopic dynamical processes and mechanical response still needs to be established.
In recent years a number of approaches for simulating colloidal gelation have been proposed, including short-range isotropic interactions Testard et al. (2011); Charbonneau and Reichman (2007); Tanaka and Araki (2007); Foffi et al. (2005), valence-limited and patchy-particle models Zaccarelli et al. (2006); Sciortino and Zaccarelli (2011); Rovigatti and Sciortino (2011), dipolar particles Blaak et al. (2007), and anisotropic effective interactions Del Gado and Kob (2010); Colombo et al. (2013); Saw et al. (2009). We follow here this latter approach, using an effective interaction that includes, in the form of a three-body term, the basic ingredients for a minimal model of particle gels. Using this approach, we were able to show in a previous work that bond-breaking events in physical gels strongly couple to the complex network topology and result in cooperative dynamics that are absent in chemical gels, in which bonds are permanent Colombo et al. (2013). This is due to the fact that bond breaking has nonlocal consequences, because the network structure entails long range correlations: bond breaking is more likely to occur in specific parts of the network, i.e. its soft parts, but induces an enhancement of particle mobility and significant particle rearrangements relatively further away. We expect these features of restructuring networks to play a crucial role in the mechanical response of physical gels.
In the present paper we thoroughly analyze the self-assembly process and the spatial structure of the networks obtained within our model, and we present two main contributions concerning the relaxation dynamics of colloidal gels. First, we characterize the cooperative dynamics of the gels by means of the dynamical susceptibility . This quantity has been extensively analyzed in numerical simulations of dense glassy systems Berthier et al. (2011), but it has been relatively less studied in gels Cipelletti et al. (2003); Duri et al. (2005); Duri and Cipelletti (2006); Abete et al. (2007); Coniglio et al. (2008); Abete et al. (2008), in spite of the fact that experimental measures of in colloidal gels have already been performed Duri et al. (2005); Duri and Cipelletti (2006). We compute and its dependence on the scattering wave vector in networks with varying density, discussing possible connections with experimental observations. Second, we assess to what extent the cooperative dynamics of the gel are affected by the choice of the microscopic particle dynamics employed in the simulation (Newtonian vs. stochastic, with different conserved quantities). In fact, in simulations of dense glasses it has been shown that the amplitude of the dynamical fluctuations depends both on the statistical ensemble and on the microscopic particle dynamics adopted Berthier et al. (2007). We address this problem in our model gel and confirm that the measured dynamical fluctuations, i.e. the peak amplitude of , depend on the microscopic particle dynamics, but the average long-time dynamics do not. Nonetheless, the scaling behavior of the peak with the scattering wave vector is robust with respect to changes in the microscopic dynamics. Overall, we provide evidence that the cooperative character of the long-time rearrangements in the gel is determined by its mesoscopic network structure and is thus a feature appearing irrespective of the nature of the underlying microscopic dynamics.
The paper is organized as follows. In Sec. II we describe our model for colloidal gel networks and provide the details of the numerical simulations we performed. In Sec. III we analyze the self-assembly process through which the particles aggregate into stress-bearing percolating networks, and characterize the structure of the resulting gels. Section IV is devoted to the analysis of the average particle dynamics and relaxation processes. Section V deals with dynamical fluctuations and cooperative dynamics. In Sec. VI we analyze the dependence of our findings on the microscopic particle dynamics chosen for the numerical simulation. Finally, in Sec. VII we present a summary of the main results and some concluding remarks.
II Model and numerical simulations
Dilute colloidal gels are characterized by open and thin network structures, where particle coordination can be very low (two to three) Dibble et al. (2008); Ohtsuka et al. (2008). Hence the network connections need to be fairly rigid to support at least their own weight and experiments have proven that bonds between the colloidal particles can indeed support significant torques Pantina and Furst (2005). We consider these as the two basic ingredients for a minimal model of particle gel networks, in the same spirit as recent work Del Gado and Kob (2007b); Saw et al. (2011); Blaak et al. (2007), where anisotropic interactions promote the assembly of thin open structures and stabilize them at low volume fraction.
Our model system consists of identical particles with mass , interacting via the potential
| (1) |
where , being the position vector of particle number , sets the energy scale, and represents the particle diameter. Typical values for a colloidal system are and , being the Boltzmann constant and the room temperature Trappe et al. (2001); Prasad et al. (2003); Laurati et al. (2011). The two-body term consists of a repulsive core complemented by a narrow attractive well:
| (2) |
The three-body term confers angular rigidity to the interparticle bonds and prevents the formation of compact clusters:
| (3) |
The intensity of the the three-body interaction decays with increasing distance from the central particle in accordance with the radial modulation
| (4) |
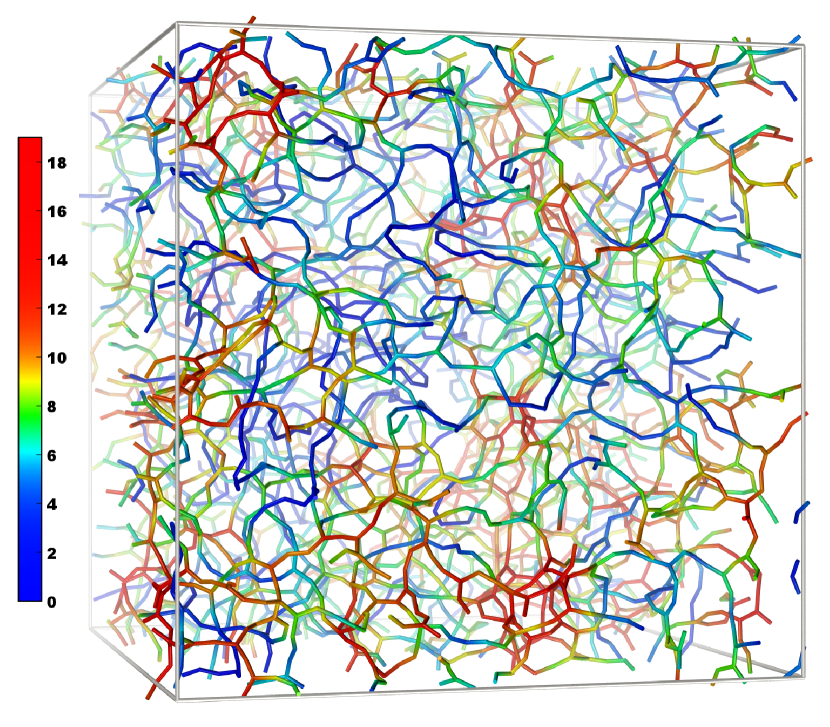
The potential energy (1) depends on the dimensionless parameters . In our study the model is not tailored to any specific colloidal system: we have chosen these parameters such that for of the order of the particles start to self-assemble into a persistent particle network like the one represented in Fig. 1. The data here discussed refer to , one convenient choice to realize this condition.
In the following we will express distance in units of , energy in units of , time in units of , and temperature in units of .
We performed molecular dynamics simulations with the LAMMPS source code Plimpton (1995), that we have suitably extended to include the potential (1). We used a cubic simulation box with periodic boundary conditions. We have investigated systems with number density , , , and ; these correspond to approximate particle volume fractions , , , and , respectively. The simulations we will report in the following were performed with 16384 particles unless stated otherwise. We performed simulations in the canonical () ensemble using the velocity Verlet algorithm coupled to a chain of Nosé-Hoover thermostats, with a timestep ; a typical production run consisted in steps. In order to equilibrate the network we started at high temperature () and cooled the system to a prescribed lower temperature over the course of timesteps; afterwards, the temperature was kept fixed at the target value. In the range of temperatures we will report, structural and dynamical quantities did not show any aging with time after equilibration. In order to investigate the role of different microscopic dynamics in our model gel we have also performed simulations in the microcanonical () ensemble, and with Langevin dynamics, using in both cases the same timestep as for dynamics. For the simulations in the ensemble we first equilibrated the system at the target temperature with the Nosé-Hoover thermostat; we then evolved the system at constant energy for steps. In the case of Langevin dynamics we used a drag force with a drag coefficient , and a typical production run covered steps.
In the range of temperatures of interest here, interparticle bonds are not permanent: thermal fluctuations favor breaking of existing bonds and formation of new ones between particles that were previously nonbonded. In order to identify how these processes affect the network dynamics we have also performed simulations where we added a narrow potential barrier to the two-body term (2) of the interaction potential:
| (5) |
with , , and . This enabled us to switch at will, for the same gel, between a restructuring network, in which bonds may be broken and created, to a nonrestructuring one, where the particle connections do not change over time Saika-Voivod et al. (2004); Saw et al. (2009).
III Self-assembly, spatial correlations and network structure
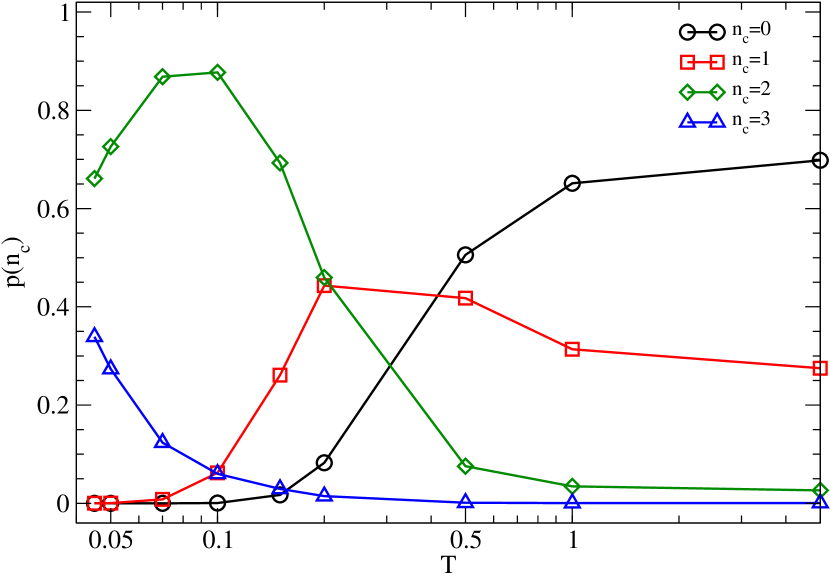
Upon lowering the temperature the particles progressively assemble into a network. Pairs of particles separated by a distance , around which is centered the first minimum of the radial distribution function, are considered bonded.222Since we will be interested in detecting the breaking and the formation of bonds over the course of time, we find it convenient to adopt a bond criterion with hysteresis, which helps in reducing false positives due to vibrations of the bonds: two particles are considered bonded as soon as their distance becomes smaller than a first threshold , but an existing bond is considered broken only when their distance becomes larger than a second threshold . We stress that this is just a criterion used for the purpose of data analysis: there is no such distinction between bonded and nonbonded particles in the potential (1). All results discussed here are not sensitive to the specific choice of and , as long as they bracket . The average fraction of particles with bonds, , is shown as a function of temperature in Fig. 2. At high temperature most particles do not form any long-lived bond and exist as monomers (), although there is a certain fraction of transient dimers (). Upon lowering the temperature chains with an increasing number of particles begin to form, so that the fraction of two-coordinated particles increases significantly. We can distinguish a first regime where increases while is roughly constant. Below chains grow at the expense of dimers and in the region the chains branch, with a notable growth of three-coordinated particles (crosslinks or nodes) at the expense of two-coordinated particles.
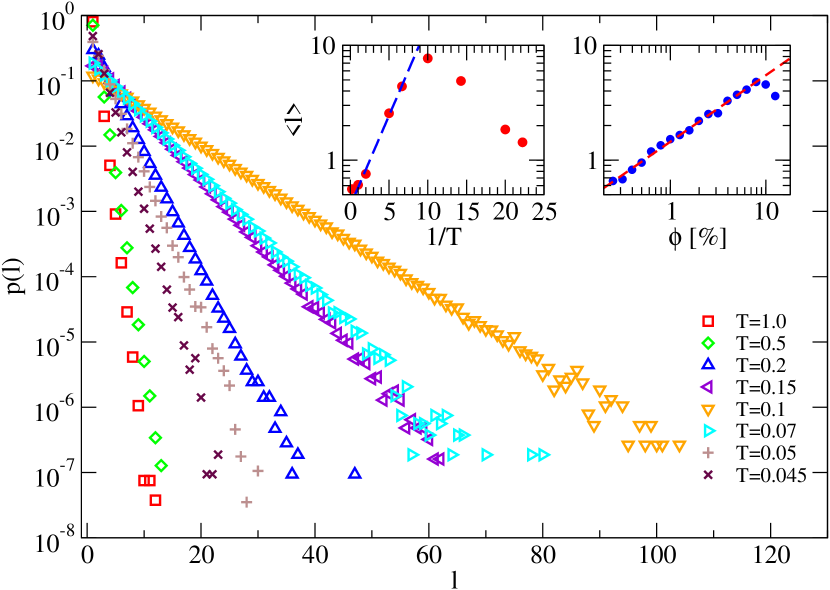
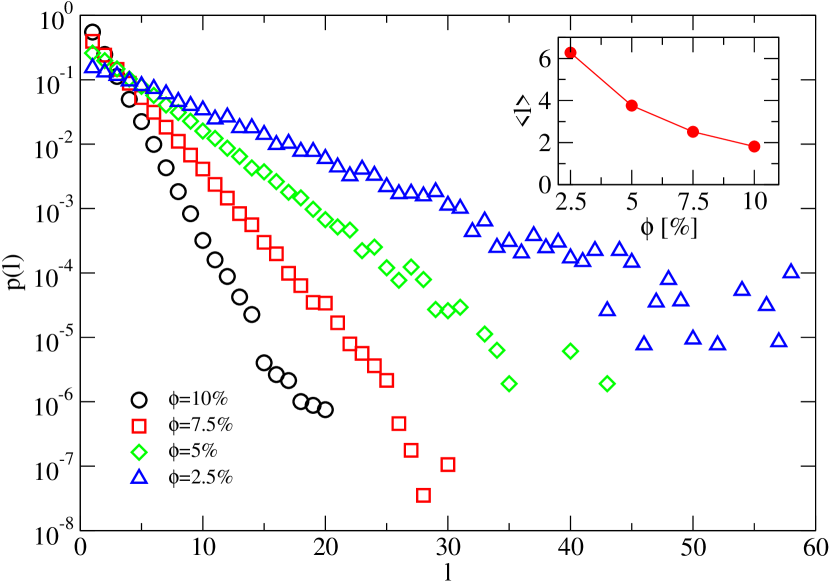
Having defined the chains as clusters of bonded one- or two-coordinated particles, the fraction of chains with length , , is plotted in Fig. 3 (main plot) for different temperatures. For , i.e. before the onset of branching, we expect the chain length distribution to be well described by a Flory-Huggins (mean field) type of theory De Gennes (1979); Cates and Candau (1990), and hence that at relatively low volume fractions the chain length follows an exponential law , with an average that increases with lowering the temperature or increasing the density as , in which is the scission energy of a chain and . Our data is compatible with the expected dependence on both the temperature (left inset of Fig. 3) and density (right inset). When branching of chains comes into play, i.e. around in the left inset and in the right inset, the average chain length becomes instead progressively smaller with decreasing temperature or increasing density, respectively.
To investigate also the regime where branching or crosslinking of the chains becomes important, we define more generally clusters that are maximal connected subsets of particles. The fraction of clusters made of bonded particles significantly deviates, at low temperatures, from the exponential size distribution typical of transient, short-lived clusters formed upon particle collisions. It is shown in Fig. 4 for and different temperatures.
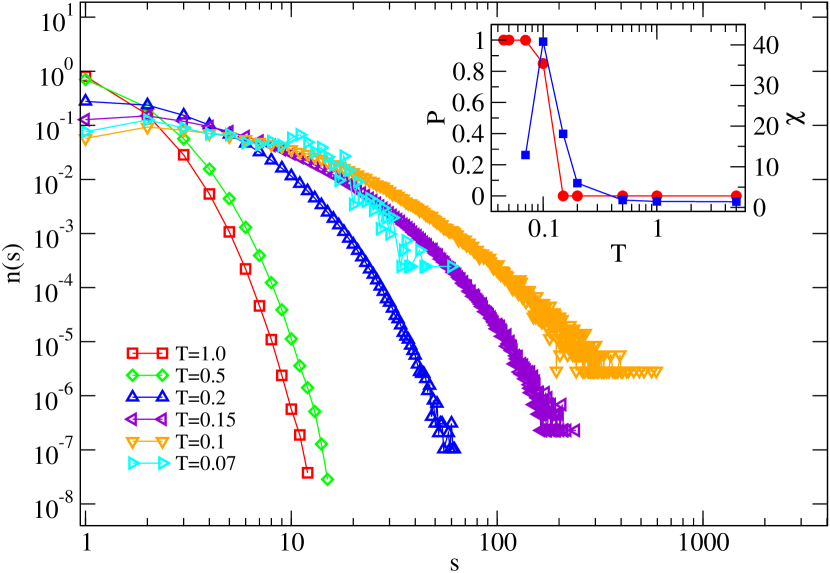
We also consider that a cluster is percolating if contains a path connecting a particle to one of its periodic images. From the high-temperature exponential law indicating the formation of short-lived clusters upon particle collisions, by lowering the temperature the cluster size distribution becomes nonmonotonic, with dimers having a higher statistical frequency than monomers, and eventually develops a power-law tail, compatible with a percolation phenomenon Stauffer and Aharony (1994). The fraction of particles belonging to a percolating cluster shows a sudden increase when the temperature drops below , where the mean cluster size , defined as , also displays a peak (inset of Fig. 4). For practically all particles (more than ) belong to a single percolating cluster, that is a persistent, connected network of particles spanning the whole system.
In order to characterize the structure of the network over different length scales we compute the static structure factor
| (6) |
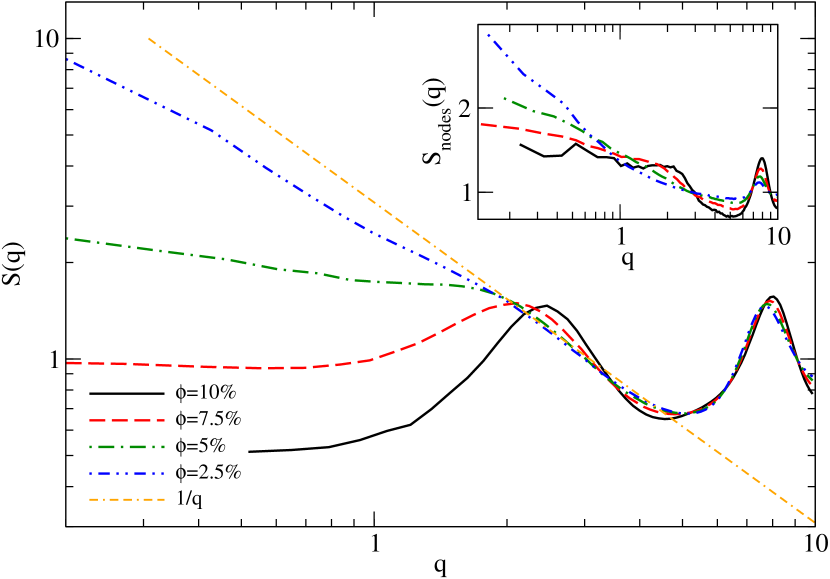
that quantifies spatial correlations between particle positions over distances (where is in units of ), regardless of whether they are connected or not through the network. The high-temperature is essentially featureless, but upon lowering the temperature it develops patterns that allow to follow the network development. In Fig. 5 we plot computed in networks obtained at for different volume fractions. The peak at corresponds to distances of the order of the typical bond length and hence quantifies the contribution of bonded particles. This is weakly dependent on density within the range investigated. The peak at signals spatial correlations between particles separated by distances -. These and, even more, the correlations over larger length scales are instead significantly affected by density. For intermediate wave vectors the behavior expected for linear chains is approached. The departure from this regime shifts to lower wave vectors upon lowering the volume fraction, signaling an increase in the average chain length.
To clarify the origin of the mesoscale correlations and in particular of the peak at we compute the mesh size of the network by evaluating the distribution of chain lengths between nodes, which is plotted in Fig. 6 for various volume fractions. From the exponential distributions we extract the average chain length that gives us an estimate of the average mesh size of the network, shown in the inset. The data show that both the value of and its dependence on are consistent with the position of the peak at low in the structure factor.
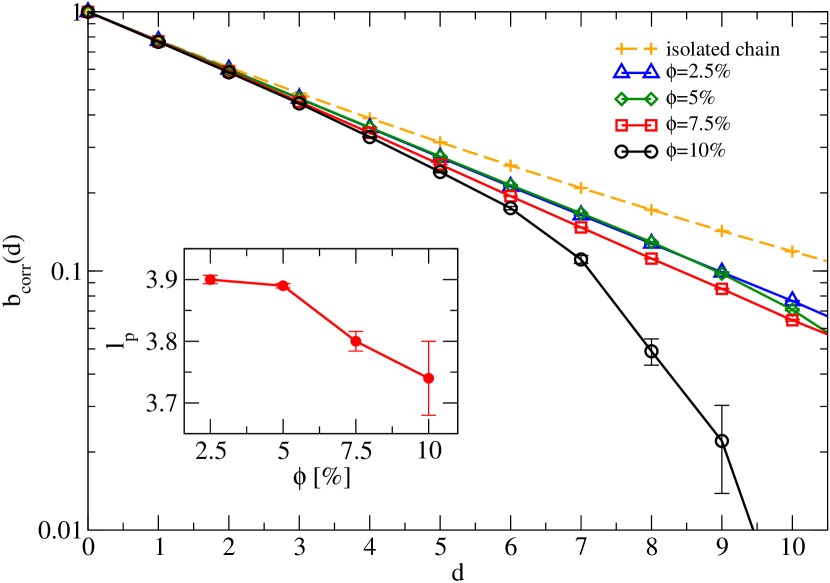
In addition to the network connectivity, another origin of mesoscale correlations in the network could be the local rigidity of the chains. We estimate the persistence length of the network chains by introducing an orientational correlation function of the chain bonds, as explained in the following. Considering a chain of length in a given network configuration, we denote by the sequence of particle indices corresponding to the sequence of particles forming the chain. The -th particle-particle bond in the chain is then , with . The correlation function measures the coherence between the orientation of two bonds separated by particles along the same chain; it is defined by , the angular brackets denoting an average over (i) the set of all chains in a given network configuration, and (ii) a sequence of configurations sampling the time evolution of the network. The range of the correlation function is restricted to the maximum chain length and is therefore density-dependent. The results are plotted in Fig.7 and compared to the same bond orientational correlations obtained for long, isolated chains, i.e. chains not embedded in a network: from the exponential decay we obtain a persistence length bonds (see inset). Being , we can conclude that correlations over these length scales must be also due to the persistence length of the chains, that therefore certainly contributes to the peak at in the structure factor. Nevertheless, does not change significantly within the range of densities investigated here, therefore the fact that the position of the peak moves towards lower upon decreasing the density is instead controlled by the mesh size (or the length of the chains at higher temperatures, when the network has not formed yet). It is interesting to note that the persistence length of the chains in the networks is larger than, or of the order of, their contour length, indicating that this gel network could have features quite similar to semiflexible networks typical of biopolymer systems Das et al. (2007); Broedersz et al. (2012); Cyron et al. (2013).
The contribution to of the network nodes alone is shown in the inset of Fig. 5: the data indicates that a certain fraction of them are nearest or next-nearest neighbors, creating densely connected regions. This is confirmed when we associate to each particle a local density of nodes that measures the number of nodes lying within a distance of bonds along the network: the spatial distribution of is highly inhomogeneous, ranging from 0 in loosely connected regions to in strongly connected ones Colombo et al. (2013). The reader may appreciate the existence of regions with different density of crosslinks also by looking at the gel snapshot in Fig. 1. The strong signal in the node at small shows another common feature of dilute networks, emerging from long-range spatial correlations between nodes across loosely connected domains Del Gado and Kob (2010).
IV Particle localization in the gel network
We first characterize the average single-particle dynamics using the mean square displacement (MSD)
| (7) |
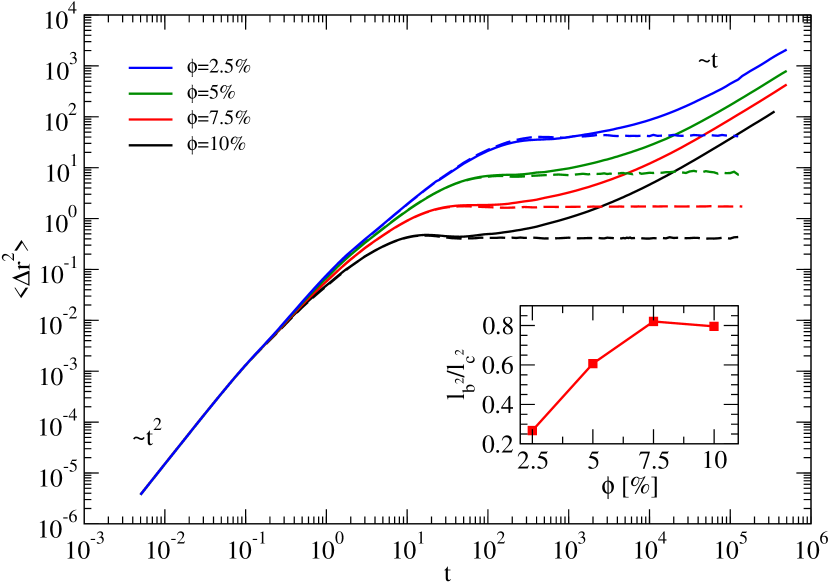
which we plot in Fig. 8 for and different volume fractions. In the restructuring networks (full lines) has a transition from a ballistic behavior () at short times (due to the Newtonian dynamics we use here) to a diffusive behavior () at long times. A pronounced plateau—corresponding to a time window in which particles are transiently localized—separates the two regimes. The point of inflection of the mean square displacement defines a density-dependent localization time , which increases from at to at . The corresponding localization length, defined as , increases from to . This type of particle localization is strongly reminiscent of the caging in the dynamics of dense glasses Götze (2009), but whereas there this is due to the particles being embedded in a crowded environment, in the gel it is a consequence of the particles being constrained by the network structure. Consequently, the localization length of the particles can be much larger than the one typical of dense glasses Zaccarelli et al. (2005); De Michele et al. (2011). Figure 8 in fact shows the mean square displacements in the nonrestructuring networks (dashed lines), which up to coincide with the ones of the restructuring networks; after the localization time they are instead constant and roughly equal to . This shows that the localization length is mainly controlled by the network topology (having fixed the effective interactions that stabilize the structure), i.e. the average fraction of two- and three-coordinated particles. On the contrary, the long-time diffusion of particles in the gel hinges on network restructuring.
One might think that the escaping of a particle from its cage is a completely local process, corresponding to the breaking of one or more bonds linking the particle to the rest of the network. In order to test this hypothesis we partition the trajectory of each particle , starting at time and ending at time corresponding to the entire simulation window, into a set of blobs, on the basis of changes in the coordination number of the particle. Whenever the particle acquires a new neighbor, or it looses an existing neighbor, the current blob ends and the next one starts: . We define the size of a blob as the variance of the particle position over the corresponding time interval:
| (8) |
and compute the mean blob size by averaging over the blobs of all particles:
| (9) |
This mean blob size quantifies the extent of particle localization on the time scale typical of changes in the local particle environment. In the inset of Fig. 8 we plot as a function of the volume fraction. The data show that the localization length measured in this way in between bond-breaking events is of the order of the one detected by the MSD at volume fractions , but becomes significantly smaller than that upon decreasing the volume fraction. This suggests that the cage effect detected by the MSD should not be thought of in terms of the two-three bonds linking the particle to the network, but rather in terms of a relatively larger portion of the structure constraining the particle motion.
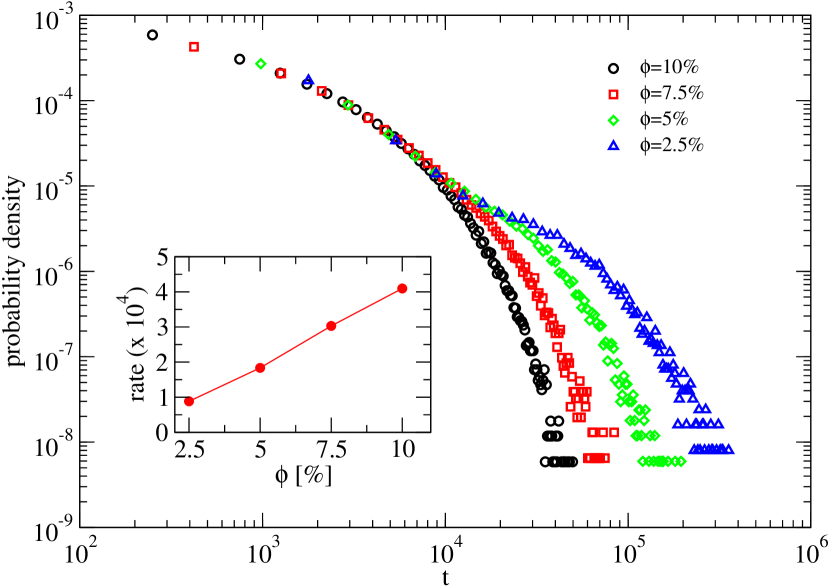
Useful information on the bond-breaking processes in the network can be obtained by computing the probability distribution (i.e. normalized histogram) of the time lag between the formation of a bond and its subsequent breaking, which is shown in Fig. 9; the data refer to and various volume fractions . One can see that the long-time behavior of the distribution varies significantly with , suggesting that bond breaking is not simply a thermally activated process, but is instead significantly affected by the large scale structure of the network, which changes with , as indicated by the structure factor (Fig. 5).
We analyze now the spatial dependence of the single-particle dynamics by computing the incoherent scattering function
| (10) |
where indicates a time average and
| (11) |
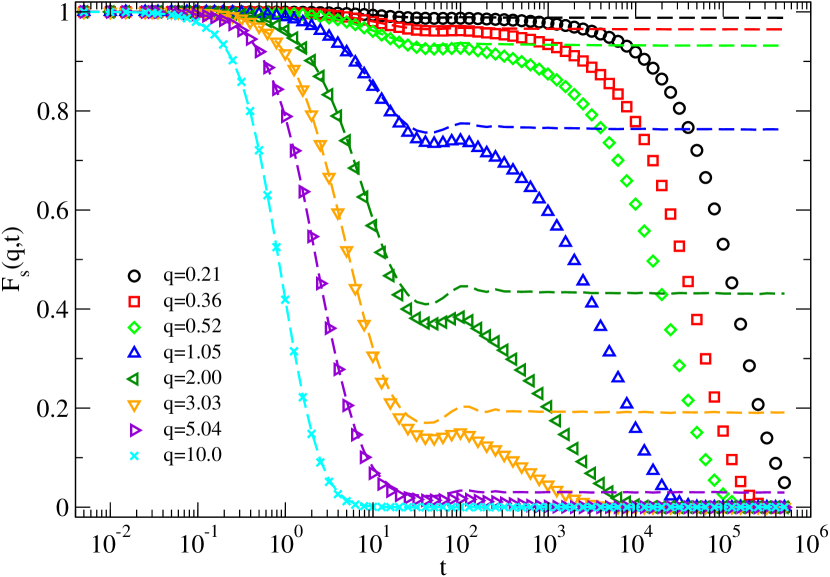
This function quantifies the time correlation in single-particle displacements over a length scale and a time lag . In Fig. 10 we plot for a set of wave vectors at volume fraction and temperature in a restructuring network (symbols) and in a nonrestructuring network (dashed lines) with the same topology. In the restructuring network, for the two-step decay of time correlations indicates a separation of time scales (i.e. between a fast process and a slow process) with a plateau corresponding to a localization regime around a time . This is again strongly reminiscent of the caging phenomenon in the dynamics of dense glasses Götze (2009), consistent with the time dependence of the MSD (Fig. 8). Here we can see that the height of the plateau decreases with increasing wave vector; at sufficiently high wave vector () the plateau disappears completely, indicating that the fast relaxation process is the only one relevant at small length scales.
The decay of correlations in the restructuring and nonrestructuring networks coincide up to : therefore, the fast relaxation process is due to particle motion—network “vibrations”—that does not entail breaking of bonds; this is somewhat similar to cage rattling in glasses. The decay of correlations after the plateau is instead due to network restructuring, since it takes place only if bonds are allowed to break. This decay can be fitted by a stretched exponential function
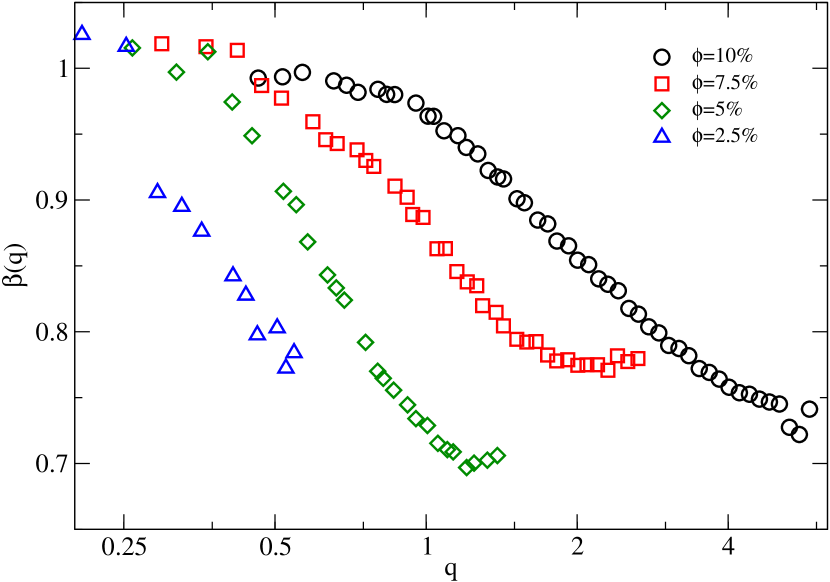
| (12) |
where is the structural relaxation time and a -dependent stretching exponent. Our data indicate a strong dependence of the relaxation dynamics on the length scale set by . In Fig. 11 we plot the stretching exponent as a function of the wave vector in four networks with different volume fraction. At very large length scales (i.e. low wave vector) the incoherent scattering function decays exponentially () as one would expect for simple particle diffusion. However, with increasing within the range where the plateau is observed the decay of correlations becomes more and more stretched (): in all cases decreases from unity down to . These results indicate that the decay of time correlations changes qualitatively with the size of the region under analysis: in particular, there is an intermediate range of wave vectors where relaxation dynamics become complex and slow. The range of wave vectors where the stretched exponential decay is observed increases with increasing volume fraction, suggesting that in networks obtained at higher the correlations in the dynamics may be more extended. Following the model developed in Ref. Krall and Weitz, 1998, we have used these data to extract the dependence of the localization length on the volume fraction: within the relatively limited range of volume fractions investigated here, the results are consistent with the prediction of Krall and Weitz. Our findings are also reminiscent of the results of dynamic light scattering experiments conducted on colloidal gels and other jammed soft materials, in which they report a two-step decay of dynamical correlators, a length scale dependence of the slow relaxation dynamics, and a exponent decreasing with increasing wave vector Cipelletti et al. (2000); Duri and Cipelletti (2006); Cipelletti et al. (2003). However, while we find that the decay of time correlations is exponential at low wave vector and becomes progressively stretched with increasing , in the experiments a compressed decay () is consistently reported. This behavior has been connected to microcollapses of the gel structure under the action of internal stresses driving the aging of the material Cipelletti et al. (2003); Bouchaud and Pitard (2001). The absence of aging in our model (at least on the time scale accessible in the simulations) might explain why we do not observe any compressed exponential behavior.
We have also computed the coherent scattering function
| (13) |
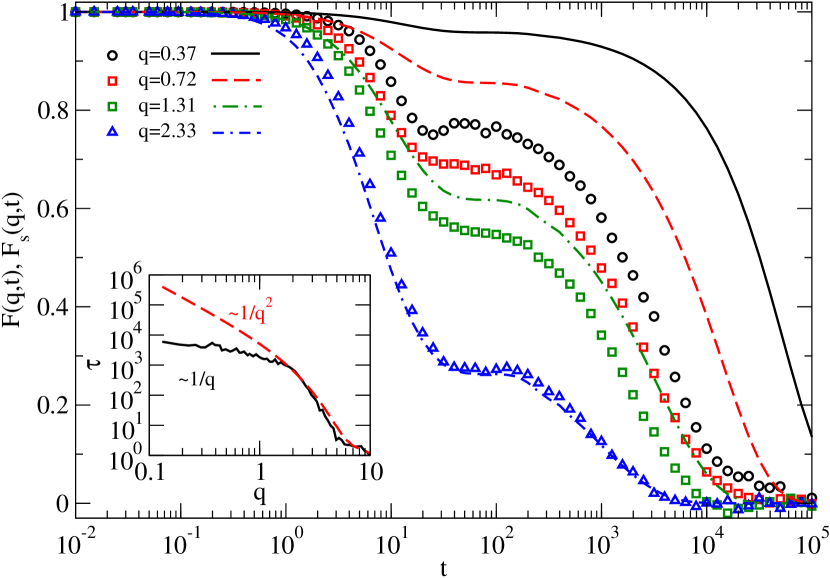
which provides information on the collective dynamics of the system and is akin to the intensity autocorrelation function accessible in light scattering experiments. Figure 12 shows a comparison between (symbols) and (lines) for selected wave vectors in a gel network with volume fraction and temperature . The coherent scattering function follows the same two-step decay pattern shown by the incoherent part and already discussed. At high wave vector the two curves are on top of each other, whereas at low wave vector decays faster than . We have evaluated the -dependent structural relaxation time of the network by computing the area under the relaxation function: , where stands either for or . The results are shown in the inset of Fig. 12. At low wave vector the relaxation time deduced from the incoherent scattering function scales as , suggesting that the large-scale single-particle dynamics are diffusive. On the contrary, the relaxation time extracted from the coherent scattering function has a ballistic scaling (), in accordance with experimental results on gels and other soft materials Duri and Cipelletti (2006); Cipelletti et al. (2003).
Overall our study of the average single-particle dynamics hints in several places to the fact that such dynamics are strongly affected by the mesoscale organization of the network, and therefore characterized by long-range correlations and presumably strong cooperativity. In the following we quantify these correlations and analyze their origin.
V Cooperative dynamics
We analyze the degree of cooperativity in the dynamics of the gel network by computing the variance
| (14) |
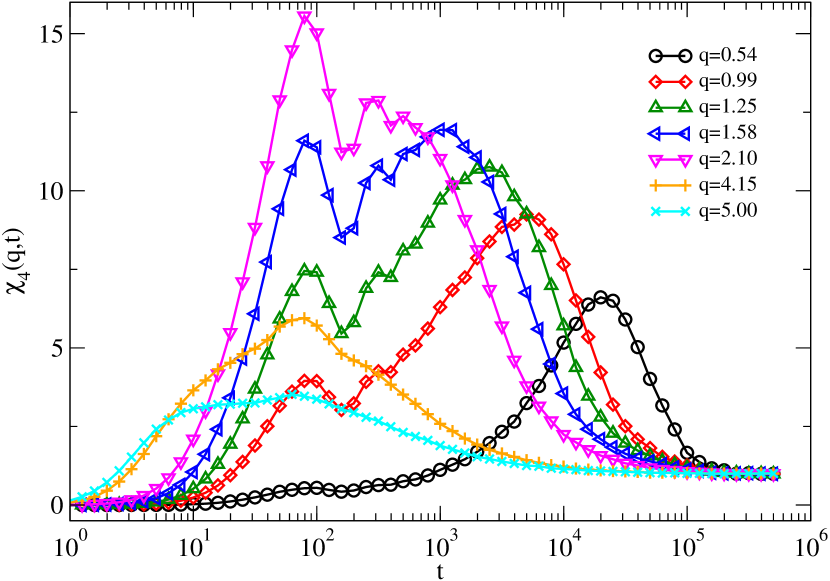
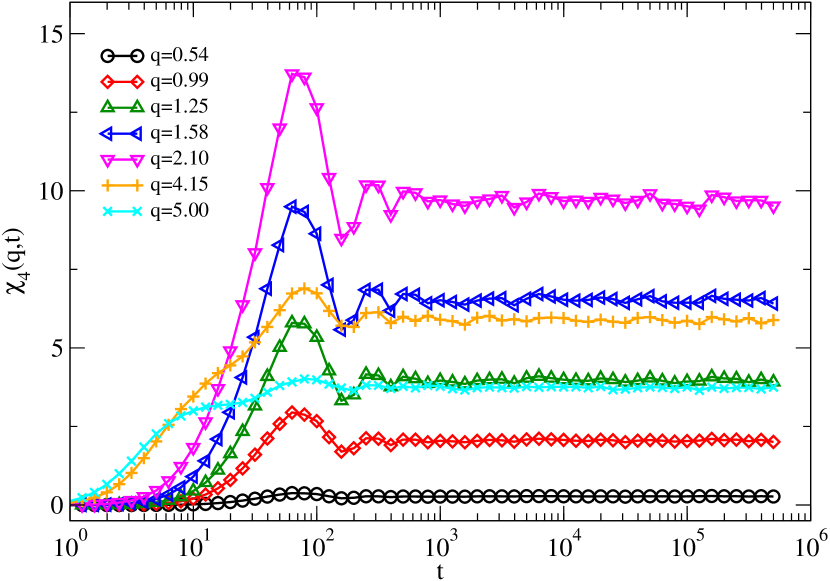
This dynamical susceptibility detects fluctuations from the mean degree of correlation in single particle displacements due to spatial correlations of the dynamics, i.e. to particles undergoing cooperative motion over a distance and a time Berthier et al. (2011); Donati et al. (2002); Lacevic et al. (2003). In Fig. 13 we plot as a function of time for a set of wave vectors in a restructuring network with volume fraction and temperature . At large wave vectors the curves start from zero, have a peak corresponding to the localization time , then decay to the asymptotic value . The shape of the curves changes qualitatively for , being the peak in the structure factor corresponding to the mesh size of the network (see Section III). In this regime the curves display a second peak in correspondence of the structural relaxation time . Accordingly, the peak shifts at larger times with decreasing ; at the same time, the amplitude of the peak diminishes. This is again very similar to what is found in dense glassy suspensions Berthier et al. (2011). Figure 14 shows the dynamical susceptibility for the same network as in Fig. 13, but in which the bonds have been constrained so that no restructuring happens. Since the dynamics of the two systems coincide until the localization time is reached, displays the same features up to the first peak. Beyond , however, the curves are markedly different: the second peak is totally lacking in the constrained network; reaches instead a plateau value close to the amplitude of the first peak and therefore different from the asymptotic value attained in the restructuring case (unity), as it is expected for chemical gels Abete et al. (2007, 2008); Goldbart et al. (1996). The comparison between the two networks indicates that whereas the first peak has to be ascribed to vibrational motion present in both systems, the second peak is associated solely to the restructuring process.
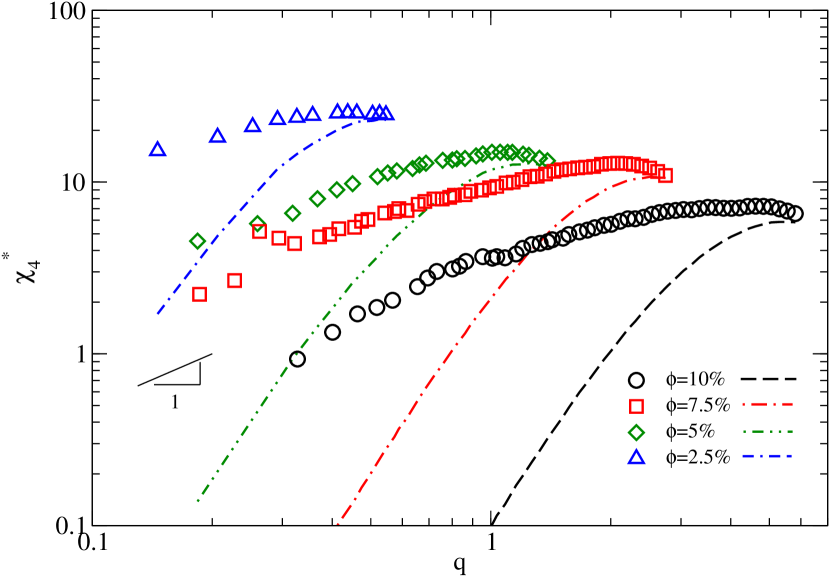
We concentrate now on the peak in the dynamical susceptibility associated to network restructuring, and whose -dependent amplitude is . In Fig. 15 we plot as a function of the wave vector in networks assembled at different volume fractions (symbols). The set of wave vectors shown for each density corresponds to the -range where in the restructuring case we are able to identify the second peak in , which also coincides with the range where displays a stretched exponential decay (see Fig. 11). In the same plot the plateau value reached by for the same but nonrestructuring networks is also shown (lines). It is apparent that the peak value in the restructuring networks is constantly larger than the plateau value in the corresponding nonrestructuring networks, therefore confirming that the restructuring of the network happens via cooperative processes that are not present in the nonrestructuring case.
Overall, we find that the dynamics of our model gel are characterized by restructuring-induced heterogeneities whose magnitude depends on the length scale probed by the wave vector . A -dependent dynamical heterogeneity in colloidal gels has indeed been reported in recent light scattering experiments Duri and Cipelletti (2006); Trappe et al. (2007). It is worth mentioning that the experiments do not show a peak in associated to thermally induced fluctuations of the gel branches (i.e. the analogous of our first peak), due to damping of the particle motion through the solvent. As we will see in the next section, the use of dissipative microscopic dynamics—which are more appropriate to model a real colloidal suspension—suppresses the first peak in our model as well, leaving only the peak due to restructuring. The amplitude of the restructuring peak increases roughly linearly with (see Fig. 15), in accordance with the scaling observed for the dynamical susceptibility in the experiments reported in Ref. Duri and Cipelletti, 2006.
VI Comparison of different microscopic particle dynamics
The overall picture we have obtained so far is that the restructuring of the gel networks, although due to individual bond-breaking events, takes place in a cooperative fashion. We would like at this point to investigate whether the picture obtained depends on the microscopic dynamics used in the simulations. In particular we have so far discussed molecular dynamics simulations performed integrating Newton’s equation of motion, whereas the real systems are characterized by damped microscopic dynamics due to the solvent. Newtonian dynamics allow for a clearer distinction between the different relaxation regimes (respectively due to the vibrational motion and the overall relaxation of the network) and has therefore simplified our analysis. In dense glassy systems, it has been shown that the qualitative behavior of the dynamical susceptibility does not change, but there are a few features that depend indeed on the microscopic particle dynamics chosen for the numerical simulation Berthier et al. (2007).
We have therefore considered the same gel network and compared three different microscopic particle dynamics: , , Langevin. These simulations have been performed for particles at volume fraction and temperature . The smaller system size is due to the higher computational cost required by Langevin dynamics; in order to exclude size effects we consider the same number of particles for all three cases. In the case of dynamics we used the same thermostat (Nosé-Hoover) and equilibration protocol employed for the bigger systems, as detailed in Section II. The simulations were started from a well equilibrated configuration obtained with dynamics; we checked that the temperature variation was negligible during the runs at constant energy. In the case of Langevin dynamics we solved for each particle the equation of motion
| (15) |
where is the conservative force derived from the potential (1), is a frictional force, and is a random force due to solvent atoms at a temperature T bumping into the particle Gleim et al. (1998); Allen and Tildesley (1989). We chose in reduced units, which we found high enough to make a substantial difference with respect to Newtonian dynamics, yet small enough to enable the system to reach full relaxation on a time scale accessible to simulations.
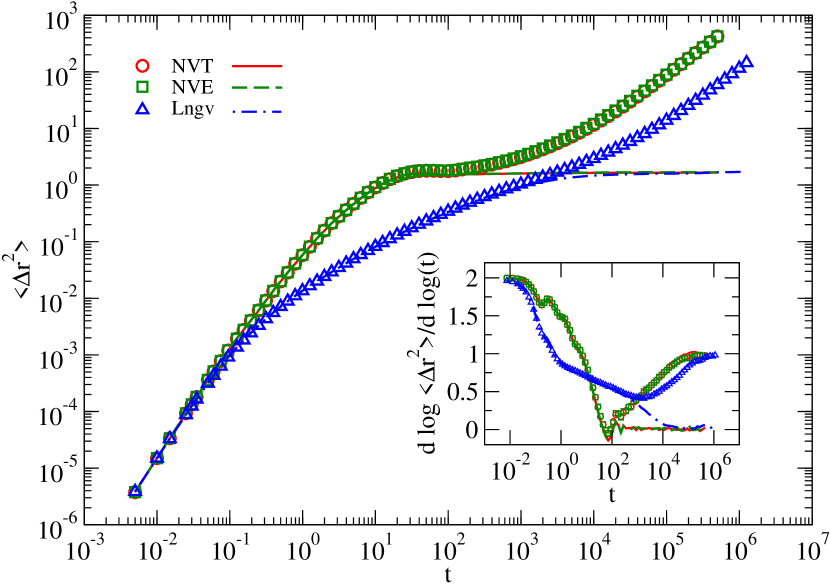
In Fig. 16 we compare the mean square displacement (7) for the three microscopic dynamics in a restructuring network (symbols) and a nonrestructuring one (lines). The curves for and coincide, showing that the two distinct microscopic dynamics result in virtually identical average particle displacements over time. In the case of Langevin dynamics, owing to the microscopic dumping of particle motion, after an initial segment coinciding with the other two curves the dynamics slow down. In the restructuring network the plateau is significantly smoothened, resulting in a more gradual transition from the ballistic to the diffusive regime (see also the inset of Fig. 16, reporting the logarithmic derivative ). In the nonrestructuring network the three curves reach at long times the same asymptotic value, showing that the extent of particle localization, being determined only by the network topology, is independent of the microscopic dynamics (the temperature being equal).
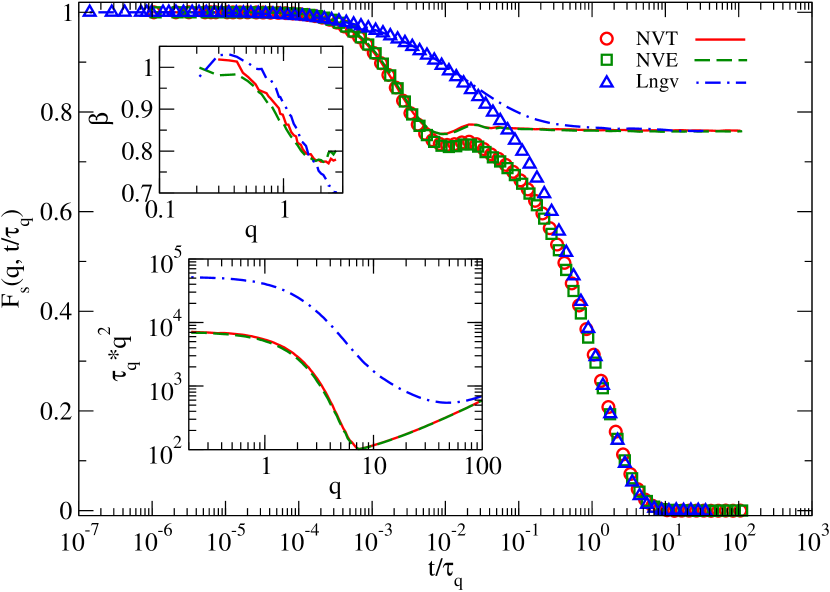
The incoherent scattering function (10) is shown in Fig. 17 for . Time is rescaled by the structural relaxation time to account for the trivial slowing down of the relaxation in the case of Langevin dynamics. We see again that and dynamics result in equivalent relaxation patterns. In the restructuring network (symbols) the use of Langevin dynamics causes the damping of the short-time vibrational motion of the network, leading to the disappearance of the plateau separating this fast relaxation process from the slower restructuring dynamics. The pattern of long-time relaxation is instead clearly independent of the microscopic dynamics, since the three curves fall on top of each other. A similar behavior has been observed in simulations of dense glassy systems Gleim et al. (1998). As a further confirmation we plot in the upper inset of Fig. 17 the stretching exponent obtained as a function of from a fit of a stretched exponential function (12) to the long-time decay of . Although the results are not identical, presumably due to the sensitivity of the result on the time range chosen for the fit, there is no qualitative difference between the various microscopic dynamics: the relaxation is exponential at small wave vector, then becomes more and more stretched ( diminishes) by increasing . In the lower inset we plot as a function of : in all cases the dynamics are diffusive () at low and ballistic () at high . In the case of Langevin dynamics the transition is smoother, and the dynamics ballistic only at very high wave vector because of the microscopic damping. In the nonrestructuring network (lines in the main plot of Fig. 17) the three curves attain the same asymptotic value, proving again that the extent of particle caging is not affected by the microscopic dynamics, but instead set by the network topology.
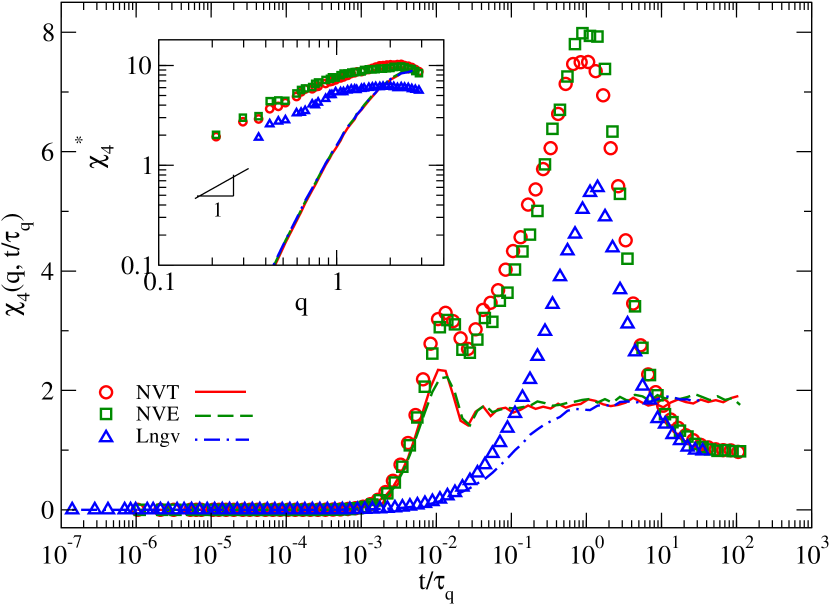
Finally, we report in Fig. 18 the dynamical susceptibility (14) for as a function of the rescaled time . Again, and microscopic dynamics produce similar results. In the restructuring network the curves show two peaks: the first one corresponds to the localization time and is due to network vibrations; the second one corresponds to the relaxation time and arises from network restructuring (see Section V). In the case of Langevin dynamics the first peak disappears completely, presumably due to the damping of the vibrations of the network strands. The restructuring peak is still present, but its amplitude is smaller than the one of the peaks of and dynamics. We therefore conclude that dynamic fluctuations with stochastic microscopic dynamics are quantitatively different from the fluctuations obtained with deterministic microscopic dynamics, a fact that has already been pointed out for dense glassy systems in Ref. Berthier et al., 2007. In the same work the authors additionally found that at low enough temperature the fluctuations for and deterministic dynamics also differ (the latter being roughly equivalent to Langevin dynamics in terms of dynamic fluctuations). In our gel network—at least at the state point that we have analyzed—the two deterministic dynamics produce instead similar results; it might be that lower temperatures and/or higher densities are required to observe a difference as big as the one reported for the dense glass. In the nonrestructuring network all three curves attain the same plateau value at large time, which is consistent with the results in Figs. 16 and 17.
In the inset of Fig. 18 we plot the amplitude of the restructuring peak of the dynamical susceptibility, , as a function of the wave vector (symbols), compared to the plateau value of in the nonrestructuring network (lines). Irrespective of the microscopic particle dynamics, at low wave vector the restructuring process is characterized by a degree of cooperativity larger than the one that might be explained by simple network vibrations. We also note that in all three cases the amplitude of the restructuring peak scales roughly linearly with the wave vector at low , again in accordance with the experimental findings in Ref. Duri and Cipelletti, 2006.
VII Summary and conclusions
In this work we have analyzed via numerical simulations the self-assembly, the structure, and the cooperative dynamics of model colloidal gels. In the spirit of other recent works, our model uses anisotropic effective interaction to stabilize thin stress-bearing networks at low particle volume fractions. Starting from a colloidal gas at high temperature, upon lowering the temperature the particles first aggregate into chains, a process that is well described by a Flory-Huggins type of mean field theory. At low enough temperature the chains cross-link and percolate, leading to dynamically arrested networks, i.e. gels. Although in reality there is a variety of pathways to gelation (involving, for instance, arrested spinodal decomposition Lu et al. (2008)), our assembled networks capture a few distinctive traits of real colloidal gels. In addition to analyzing the structure factor, we also observed that the spatial distribution of crosslinks is not homogeneous, but shows spatial correlations ascribable to the interactions stabilizing the network. This is probably a distinctive feature of physical gels, in which crosslinking is driven by the same interparticle interactions that lead to the aggregation, whereas in chemical gels irreversible crosslinking is usually initiated at random locations throughout the sample. In the range of temperatures that we have simulated the interparticle bonds are not permanent: thermal fluctuations favor the breaking of existing bonds and the formation of new bonds. Thus the networks restructure over time, an inherent feature of colloidal gels. Since the persistence length of the chains in our model is of the order of, or greater than, the average chain length, our networks have interesting similarities with fiber gels such as semiflexible biopolymer networks Das et al. (2007); Broedersz et al. (2012).
The structural relaxation of the networks as measured by the average particle dynamics follows a two-step decay pattern reminiscent of glassy dynamics: two relaxation processes taking place on different time scales are separated by an intermediate plateau. By comparing the dynamics of gels differing only in the possibility to restructure, we have been able to show that the fast relaxation process corresponds to fluctuations of the network strands that do not entail any breaking of bonds; on the contrary, the final decay of correlations is caused by the restructuring of the network. The plateau separating the two regimes is again reminiscent of the caging effect in dense glasses: whereas in the glass the caging arises because of the crowding of the particles, in the gel it is a consequence of the particles being embedded in the network structure through relatively long-lived bonds. However, escaping from the cage is not to be merely identified with the breaking of the local bonds connecting a particle with its neighbors; instead, it is a process that involves a much larger environment, i.e. the restructuring of the whole network. As we have shown in Ref. Colombo et al., 2013 this happens in a cooperative fashion because breaking of interparticle bonds has nonlocal consequences, in the sense that it affects the displacements of particles located in regions of the gel different from the one where the breaking event originated.
The cooperative nature of the network restructuring translates into a length-scale dependent relaxation behavior. The final decay of correlations measured by the incoherent scattering function is exponential at low wave vector, but becomes more and more stretched by increasing in the range of wave vectors that is able to capture the glassy dynamics. In the same range of wave vectors the dynamical susceptibility displays in the restructuring gels a pronounced peak corresponding to the structural relaxation time , whereas it saturates to a much lower plateau in the nonrestructuring case. The amplitude of the restructuring peak scales as at low wave vector.
We have performed simulations with different choices of the statistical ensemble and of the microscopic particle dynamics: Newtonian dynamics at constant energy () and temperature (), and stochastic dynamics at fixed temperature (Langevin). We observed that the absolute value of the restructuring peak of when using stochastic dynamics is different from the ones obtained with Newtonian dynamics, in accordance with earlier observations made in a dense glass Berthier et al. (2007). Nevertheless, the pattern of the long-time relaxation of the gel is robust with respect to the choice of microscopic dynamics and statistical ensemble: the stretching exponents, the scaling of the relaxation time with the wave vector, and the -dependence of the peak amplitude of are very similar in the three cases. In this respect, although the choice of a damped microscopic dynamics such as Langevin might appear more relevant for modeling the real system (in which the particles are embedded in a solvent) Newtonian dynamics has the advantage of being less demanding in terms of computational resources, and enables as well a sharper separation of the short-time vibrational dynamics from the long-time restructuring process. Therefore, whenever the interest lies in the long-time properties of the gel the choice of Newtonian microscopic dynamics is legitimate.
There is one aspect of the real system that we have completely ignored: hydrodynamics. It has been shown that many-body hydrodynamic interactions can promote gelation, or lower the colloid volume fraction threshold for percolation, as compared to their absence; they also appear to influence the morphology of the particle clusters forming during the aggregation Furukawa and Tanaka (2010). Although the results discussed here support the idea that the long-time glassy and cooperative dynamics should not be quantitatively changed by hydrodynamics, these recent works suggest that hydrodynamics may significantly affect the kinetic path to gelation, leading to possibly strong differences in the structure of the gel network, and these changes may in turn eventually affect the microscopic cooperative processes. This point requires further investigations.
The dynamics of our model system encompass many of the distinctive traits that have been measured in real colloidal gels with the use of advanced light scattering techniques Duri et al. (2005); Duri and Cipelletti (2006): the structural relaxation time extracted by the coherent scattering function shows a ballistic scaling with the wave vector at low (); in the same range of wave vectors the peak value of the dynamical susceptibility has a linear -dependence (); the final decay of correlations after the plateau is nonexponential, with a exponent decreasing with increasing wave vector. However, while in our model the decay is stretched (), in the experiments a compressed relaxation () is observed, a behavior that should be ascribed to the aging of the material under the effect of internal stresses quenched in the gel structure during solidification Bouchaud and Pitard (2001); Cipelletti et al. (2003). Hence to investigate this part of the relaxation dynamics, deeply quenched gel configurations should be analyzed. The authors of Ref. Duri and Cipelletti, 2006 propose that the slow relaxation dynamics of a colloidal gel and the associated dynamical fluctuations result from a series of discrete, instantaneous rearrangement events taking place inside the gel volume as a consequence of the progressive relaxation of internal stresses. The average degree of correlation and the related dynamical susceptibility can therefore be quantitatively connected with the number of such events taking place in a time interval . If in our model gel we identify the elementary rearrangement event with the breaking of a single bond, then an elementary event can have quite different effects depending on the local environment of the broken bond Colombo et al. (2013). Hence the structural relaxation of our gel, although clearly correlated to bond breaking, is not simply determined by the total number of breaking events taking place in a specified time interval. This suggests that the elementary rearrangements events to be considered might correspond to processes that are more complex than the breaking of individual bonds.
References
- Trappe et al. (2001) V. Trappe, V. Prasad, L. Cipelletti, P. Segre, and D. Weitz, Nature 411, 772 (2001).
- Lu et al. (2008) P. J. Lu, E. Zaccarelli, F. Ciulla, A. B. Schofield, F. Sciortino, and D. A. Weitz, Nature 453, 499 (2008).
- Di Michele et al. (2013) L. Di Michele, F. Varrato, J. Kotar, S. H. Nathan, G. Foffi, and E. Eiser, Nature communications 4 (2013).
- Sacanna et al. (2013) S. Sacanna, M. Korpics, K. Rodriguez, L. Colón-Meléndez, S.-H. Kim, D. J. Pine, and G.-R. Yi, Nature communications 4, 1688 (2013).
- Yan et al. (2010) C. Yan, A. Altunbas, T. Yucel, R. P. Nagarkar, J. P. Schneider, and D. J. Pochan, Soft Matter 6, 5143 (2010).
- Capone et al. (2012) B. Capone, I. Coluzza, F. LoVerso, C. N. Likos, and R. Blaak, Phys. Rev. Lett. 109, 238301 (2012).
- Alexander (1998) S. Alexander, Physics Reports 296, 65 (1998).
- Widmer-Cooper et al. (2008) A. Widmer-Cooper, H. Perry, P. Harrowell, and D. R. Reichman, Nat. Phys. 4, 711 (2008).
- Wyart et al. (2008) M. Wyart, H. Liang, A. Kabla, and L. Mahadevan, Physical review letters 101, 215501 (2008).
- Laurati et al. (2011) M. Laurati, S. Egelhaaf, and G. Petekidis, J. Rheol. 55, 673 (2011).
- Grest et al. (2000) G. S. Grest, M. Pütz, R. Everaers, and K. Kremer, Journal of non-crystalline solids 274, 139 (2000).
- Koumakis and Petekidis (2011) N. Koumakis and G. Petekidis, Soft Matter 7, 2456 (2011).
- Bouchaud and Pitard (2001) J. Bouchaud and E. Pitard, Eur. Phys. J. E 6, 231 (2001).
- Cipelletti et al. (2003) L. Cipelletti, L. Ramos, S. Manley, E. Pitard, D. Weitz, E. E. Pashkovski, and M. Johansson, Faraday Discussions 123, 237 (2003).
- Duri and Cipelletti (2006) A. Duri and L. Cipelletti, EPL (Europhysics Letters) 76, 972 (2006).
- Fierro et al. (2008) A. Fierro, E. D. Gado, A. de Candia, and A. Coniglio, J. Stat. Mech. , L04002 (2008).
- Del Gado and Kob (2007a) E. Del Gado and W. Kob, Phys. Rev. Lett. 98, 028303 (2007a).
- Saw et al. (2009) S. Saw, N. L. Ellegaard, W. Kob, and S. Sastry, Phys. Rev. Lett. 103, 248305 (2009).
- Gado and Kob (2008) E. D. Gado and W. Kob, J. Non-Newtonian Fluid Mech. 149, 28 (2008).
- Del Gado and Kob (2005) E. Del Gado and W. Kob, Europhys. Lett. 72, 1032 (2005).
- Testard et al. (2011) V. Testard, L. Berthier, and W. Kob, Physical Review Letters 106, 125702 (2011).
- Charbonneau and Reichman (2007) P. Charbonneau and D. R. Reichman, Phys. Rev. E 75, 050401 (2007).
- Tanaka and Araki (2007) H. Tanaka and T. Araki, EPL (Europhysics Letters) 79, 58003 (2007).
- Foffi et al. (2005) G. Foffi, C. De Michele, F. Sciortino, and P. Tartaglia, The Journal of chemical physics 122, 224903 (2005).
- Zaccarelli et al. (2006) E. Zaccarelli, I. Saika-Voivod, S. V. Buldyrev, A. J. Moreno, P. Tartaglia, and F. Sciortino, The Journal of chemical physics 124, 124908 (2006).
- Sciortino and Zaccarelli (2011) F. Sciortino and E. Zaccarelli, Current Opinion in Solid State and Materials Science 15, 246 (2011).
- Rovigatti and Sciortino (2011) L. Rovigatti and F. Sciortino, Molecular Physics 109, 2889 (2011).
- Blaak et al. (2007) R. Blaak, M. Miller, and J. Hansen, Europhys. Lett. 78, 26002 (2007).
- Del Gado and Kob (2010) E. Del Gado and W. Kob, Soft Matter 6, 1547 (2010).
- Colombo et al. (2013) J. Colombo, A. Widmer-Cooper, and E. Del Gado, Phys. Rev. Lett. 110, 198301 (2013).
- Berthier et al. (2011) L. Berthier, G. Biroli, J.-P. Bouchaud, L. Cipelletti, and W. van Saarloos, Dynamical heterogeneities in glasses, colloids, and granular media (Oxford University Press, 2011).
- Duri et al. (2005) A. Duri, H. Bissig, V. Trappe, and L. Cipelletti, Phys. Rev. E 72, 051401 (2005).
- Abete et al. (2007) T. Abete, A. de Candia, E. Del Gado, A. Fierro, and A. Coniglio, Phys. Rev. Lett. 98, 088301 (2007).
- Coniglio et al. (2008) A. Coniglio, T. Abete, A. de Candia, E. Del Gado, and A. Fierro, Journal of Physics: Condensed Matter 20, 494239 (2008).
- Abete et al. (2008) T. Abete, A. de Candia, E. Del Gado, A. Fierro, and A. Coniglio, Phys. Rev. E 78, 041404 (2008).
- Berthier et al. (2007) L. Berthier, G. Biroli, J.-P. Bouchaud, W. Kob, K. Miyazaki, and D. Reichmann, Journal of Chemical Physics 126, 184503 (2007).
- Dibble et al. (2008) C. J. Dibble, M. Kogan, and M. J. Solomon, Phys. Rev. E 77, 050401 (2008).
- Ohtsuka et al. (2008) T. Ohtsuka, C. P. Royall, and H. Tanaka, Europhys. Lett. 84, 46002 (2008).
- Pantina and Furst (2005) J. Pantina and E. Furst, Phys. Rev. Lett. 94, 138301 (2005).
- Del Gado and Kob (2007b) E. Del Gado and W. Kob, Phys. Rev. Lett. 98, 28303 (2007b).
- Saw et al. (2011) S. Saw, N. Ellegaard, W. Kob, and S. Sastry, J. Chem. Phys. 134, 164506 (2011).
- Prasad et al. (2003) V. Prasad, V. Trappe, A. D. Dinsmore, P. N. Segre, L. Cipelletti, and D. A. Weitz, Faraday Discuss. 123, 1 (2003).
- Plimpton (1995) S. Plimpton, J. Comp. Phys. 117, 1 (1995).
- Saika-Voivod et al. (2004) I. Saika-Voivod, E. Zaccarelli, F. Sciortino, S. V. Buldyrev, and P. Tartaglia, Phys. Rev. E 70, 041401 (2004).
- Note (2) Since we will be interested in detecting the breaking and the formation of bonds over the course of time, we find it convenient to adopt a bond criterion with hysteresis, which helps in reducing false positives due to vibrations of the bonds: two particles are considered bonded as soon as their distance becomes smaller than a first threshold , but an existing bond is considered broken only when their distance becomes larger than a second threshold . We stress that this is just a criterion used for the purpose of data analysis: there is no such distinction between bonded and nonbonded particles in the potential (1\@@italiccorr). All results discussed here are not sensitive to the specific choice of and , as long as they bracket .
- De Gennes (1979) P. G. De Gennes, Scaling concepts in polymer physics (Cornell university press, 1979).
- Cates and Candau (1990) M. Cates and S. Candau, Journal of Physics: Condensed Matter 2, 6869 (1990).
- Stauffer and Aharony (1994) D. Stauffer and A. Aharony, Introduction to percolation theory (CRC press, 1994).
- Das et al. (2007) M. Das, F. C. MacKintosh, and A. J. Levine, Phys. Rev. Lett. 99, 038101 (2007).
- Broedersz et al. (2012) C. P. Broedersz, M. Sheinman, and F. C. MacKintosh, Phys. Rev. Lett. 108, 078102 (2012).
- Cyron et al. (2013) C. Cyron, K. Müller, K. Schmoller, A. Bausch, W. Wall, and R. Bruinsma, EPL (Europhysics Letters) 102, 38003 (2013).
- Götze (2009) W. Götze, Complex Dynamics of Glass-Forming Liquids, International Series of Monographs on Physics, Vol. 143 (Oxford University Press, 2009).
- Zaccarelli et al. (2005) E. Zaccarelli, S. Buldyrev, E. La Nave, A. Moreno, I. Saika-Voivod, F. Sciortino, and P. Tartaglia, Phys. Rev. Lett. 94, 218301 (2005).
- De Michele et al. (2011) C. De Michele, E. Del Gado, and D. Leporini, Soft Matter 7, 4025 (2011).
- Krall and Weitz (1998) A. H. Krall and D. A. Weitz, Phys. Rev. Lett. 80, 778 (1998).
- Cipelletti et al. (2000) L. Cipelletti, S. Manley, R. Ball, and D. Weitz, Physical review letters 84, 2275 (2000).
- Donati et al. (2002) C. Donati, S. Franz, S. Glotzer, and G. Parisi, Journal of Non-Crystalline Solids 307, 215 (2002).
- Lacevic et al. (2003) N. Lacevic, F. Starr, T. Schroeder, and S. Glotzer, Journal of Chemical Physics 119, 7372 (2003).
- Goldbart et al. (1996) P. M. Goldbart, H. E. Castillo, and A. Zippelius, Advances in Physics 45, 393 (1996).
- Trappe et al. (2007) V. Trappe, E. Pitard, L. Ramos, A. Robert, H. Bissig, and L. Cipelletti, Phys. Rev. E 76, 051404 (2007).
- Gleim et al. (1998) T. Gleim, W. Kob, and K. Binder, Phys. Rev. Lett. 81, 4404 (1998).
- Allen and Tildesley (1989) M. P. Allen and D. Tildesley, Computer simulation of liquids (Clarendon Press, Oxford, 1989).
- Furukawa and Tanaka (2010) A. Furukawa and H. Tanaka, Phys. Rev. Lett. 104, 245702 (2010).