Raman Images of a Single Molecule in a Highly Confined Plasmonic Field
Abstract
Under the local plasmonic excitation, the Raman images of a single molecule can now reach sub-nanometer resolution. We report here a theoretical description of the interaction between a molecule and a highly confined plasmonic field. It is shown that when the spatial distribution of the plasmonic field is comparable with the size of the molecule, the optical transition matrix of the molecule becomes to be dependent on the position and the spatial distribution of the plasmonic field, resulting in spatially resolved Raman image of a molecule. It is found that the resonant Raman image reflects the electronic transition density of the molecule. In combination with the first principles calculations, the simulated Raman image of a porphyrin derivative adsorbed on the silver surface nicely reproduces its experimental counterpart. The present theory provides the basic framework for describing linear and nonlinear responses of molecules under the highly confined plasmonic field.
The development of tip enhanced Raman scattering (TERS) technique has significantly increased the spatial resolution of Raman images for moleculesStöckle et al. (2000); Pettinger et al. (2004); Zhang et al. (2013). Under the low temperature and ultrahigh vacuum conditions, the resolution has amazingly reached a sub-nanometer level for a porphyrin derivative adsorbed on the silver surfaceZhang et al. (2013). It is anticipated that the spatial confinement of the tip-induced plasmon has played a decisive role in achieving such a high resolution. In this case, the spatial distribution of the plasmonic field has to be comparable with the size of the molecule, even with the inclusion of possible nonlinear processesZhang et al. (2013). This situation presents a great challenge to the conventional theory, which always assumes that the electromagnetic (EM) field uniformly interacts with the moleculeLong (2002). A new theory that takes into account the locality of the EM thus needs to be developed. Moreover, what a Raman image really tells about the molecular structure is another important issue that has not yet been discussed in the literature.
In this work, we have derived a theoretical framework to describe Raman images of a molecule as observed in the TERS experiments. In combination with the first principles calculations, we have successfully reproduced experimental Raman image of the porphyrin derivative adsorbed on the silver surface. It is found that within the Born-Oppenheimer approximation, the resonant Raman image reflects the density of the electronic transition between the ground and the excited states. The role of linear and nonlinear processes on the resolution of the Raman images has been identified.
In the TERS experiments, a nano-cavity formed in-between the tip and the substrate is the host of the spatially confined plasmon (SCP). For the metals used in the experiments, the plasmonic frequency often falls into the visible or ultraviolet-visible region, hence the electric dipole approximationScully and Zubairy (1997) can still hold. The interaction Hamiltonian between SCP and adsorbates could be described byScully and Zubairy (1997)
| (1) |
where is the elementary charge, is the electron position operator and is the operator for electric field of SCP which is obviously related to the tip position . In this case, cannot be treated uniformly in space due to its specific spatial distribution. Consequently, the optical transition matrix element between two states is determined by rather than as in the conventional response theoryAlbrecht (1961); Lee et al. (2004). This modification implies that the optical processes would be dependent on the position of the tip that hosts the SCP. This can naturally explain why it is possible to obtain super-high spatial resolution of the Raman images.
By taking into account the position dependent electric field, we can re-derive the expression for the spontaneous resonant linear Raman processes following the Albrecht’s theoryAlbrecht (1961); Long (2002). The amplitude of induced linear polarization could be calculated as the summation of Franck-Condon (FC, ) and Herzberg-Teller (HT, ) terms,
| (2) |
where
| (3) |
| (4) |
Here is the Purcell factorPurcell (1946) which accounts for the enhancement of spontaneous emission in nano-cavity and is independent on the position of the TERS tip in the plane, is the electric field amplitude of incident laser, is the enhancement factor of the SCP with respect to the incident laser, is the reduced Planck constant, and are the electronic ground and resonant excited states, is the corresponding distribution function of the electric field amplitude of the SCP with proper normalization, is the corresponding normal mode, and are the initial and final vibrational states in , is the vibrational state in , is the frequency difference between and , is the frequency of the plasmon generated by the incident light, is the damping factor, and NRT is the non-resonant term. From the polarization, the Raman intensity can be calculated directly asLong (2002); Albrecht (1961); Neugebauer et al. (2002)
| (5) |
where is the speed of light, is the wave number of scattering, is the permittivity of free space, and is the directional radiation pattern factorLe Ru and Etchegoin (2009). Here the total polarization was treated as a classical oscillating dipoleNeugebauer et al. (2002). We have noted that the present consideration of SCP is equivalent to the quantization scheme proposed by Archambault et al.Archambault et al. (2010) for the propagation of the surface plasmonic waves as well as the classical treatment proposed by Xu and co-workersXu et al. (2004); Johansson et al. (2005). The key difference here is to consider the effects of the distribution function to the optical transition matrix. It should also be mentioned that the first order Taylor expansion for would naturally account for the electric field gradient effects in Raman spectroscopy as discussed in the literatureSass et al. (1981); Ayars et al. (2000); Iwasa and Nobusada (2009).
For the sake of computations, we have chosen to expand the function in terms of the Gaussian basis sets
| (6) |
where is a Gaussian function localized at the center with exponent , which can be written as
| (7) |
and is the corresponding coefficient. Here may represent the position of the SCP, which could be obtained by fitting the realistic electric field distribution and in principle it is not necessarily equal to . As the first demonstration, only the -type Gaussian functions are considered for . It is noted that for absolute Raman intensities should satisfy some proper normalization conditions. However, for the Raman images, the relative values are adequate. For the practical calculations, we chose and in Eq. 6. Moreover, for a molecule under the TERS tip, only the component needs to be evaluatedZhang et al. (2013).
We put the new theory to the test by directly simulating the system that was measured in a recent studyZhang et al. (2013), i.e. a single meso-tetrakis-(3,5-di-tertiarybutylphenyl)-porphyrin (H2TBPP) molecule adsorbed on the silver (Ag) surface. The high resolution scanning tunneling microscope (STM) and Raman imagesZhang et al. (2013) provide good references for theoretical modeling. The details of the density functional theory calculations are given in the Supplemental Materialms .
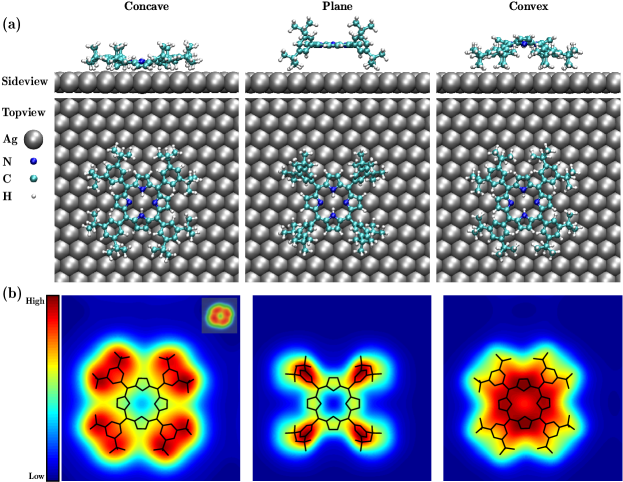
Here we considered two degenerate tautomers of H2TBPP moleculeFu et al. (2009). The optimized structures of one H2TBPP tautomer adsorbed on the Ag(111) surface are depicted in Fig. 1(a)ms . The optimized structures of the other tautomers are similar except the central hydrogens bonded to different nitrogen atoms. We have considered three configurations: concave, plane, and convex, respectively. The first and last configurations were identified when H2TBPP adsorbed on the Cu(111) surface by STMDitze et al. (2014) and the second configuration is the minimum of the isolated molecule. Our calculations have shown that the concave is the most stable adsorption configuration, owing to the long range dispersion included in current calculationsGrimme (2006). Meanwhile, the second stable configuration is the plane and the convex is the least stable one. The calculated STM imagesms of all configurations, together with the experimental resultZhang et al. (2013) are given in Fig. 1(b). One can immediately see that only the calculated STM image of the concave resembles well the experimental image. It can thus be concluded that H2TBPP adsorbed on the Ag(111) surface has the concave configuration under the experimental conditions.
To simulate the Raman image, H2TBPP was extracted from the optimized adsorption structures and its excited states were calculated by the time dependent density functional theory at the hybrid B3LYP level with 6-31G(d) basis setsms . It should be mentioned that it is the compromise that we have to make for such large systems from computational point of view. It is also a reasonable approximation since the molecule is only physisorbed on the Ag(111) surface. The strong absorption states for three configurations are found to be 2.47, 2.36, and 2.25 eV, respectively, in the region of the excitation energy of the experiment (532 nm,2.33 eV)Zhang et al. (2013). We have thus chosen these three excited states to simulate the resonant Raman images. Consistent with the experimental setupZhang et al. (2013); Qiu et al. (2003), the center of SCP, i.e. , is in the plane which is about 2 Å above the highest position of the adsorbates. Meanwhile, along the and directions, the full width at half maximum (FWHM) of the plasmonic field, , was set to be 5, 10, 20, and 30 Å, respectively, while the component was fixed at 5 Å. We should emphasize that the calculated Raman images are not sensitive to small changes of and the in the component of .
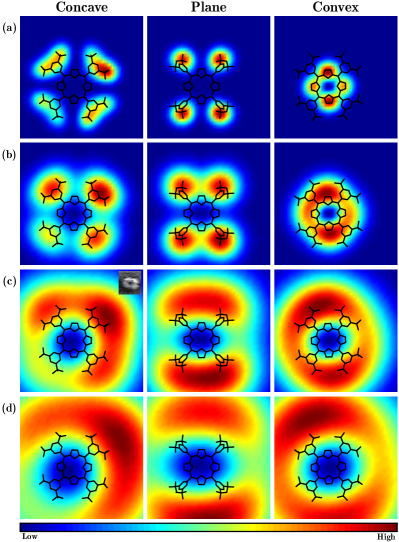
Under the resonant condition, for allowed transitions, the FC term is known to be the dominant oneMyers Kelley (2008). All simulated linear Raman images from the FC term are presented in Fig. 2. It can be seen that the size of the Raman image is dependent on the size of the SCP. This implies that the precondition for the high resolution Raman image is to generate a highly focused plasmonic field. It is nice to observe that different configuration of the molecule gives very different Raman image, indicating that TERS technique is a powerful tool to study the structure of adsorbates. One can notice that the Raman image of the concave with FWHM of 20 Å is in very good agreement with the experimental image, which is consistent with the energy and STM calculations. Here the symmetry breaking of the calculated Raman images should be attributed to the interaction between adsorbates and the Ag(111) substrate. By definition, Raman images reflect the density change involved in the electronic transition, rather than the local density of state of the adsorbate. This is naturally reflected by the obvious difference between the Raman and STM images.
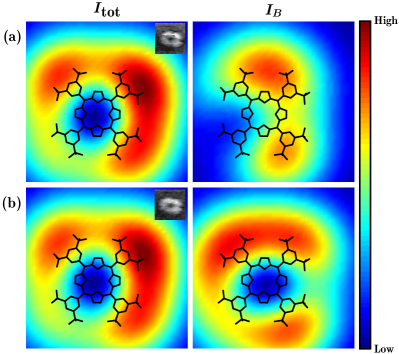
The HT term is dependent on the vibrational modes and its contribution can thus be used to identify the vibrations of the molecule. We have evaluated numerically the effect of the term for two vibrational bands, around 820 and 1200 cm-1, by using the linear coupling modelMacak et al. (2000). The calculated Raman images from the total polarization as well as the HT term alone for these two bands are shown in Fig. 3. One can immediately notice that the HT term is very sensitive to the vibrational modes. Its contribution to the total intensity holds the key to distinguish Raman images of different vibrations. For the H2TBPP molecule, the contribution of the HT term is very small. Hence, the Raman images from total intensity calculations appear to be identical for the two vibrational bands. It should be mentioned that the Raman calculations are performed for the single molecule. The inclusion of the substrate could increase the contribution of the HT term. This could be a reason behind the small variation observed in the experimental Raman imagesZhang et al. (2013). We should emphasize that the calculated Raman images given in Ref. 3 were obtained by assuming that the confined plasmonic field does not alter the transition matrix itself, which is a simplified approximation to the basic theory presented in this work.
It was found experimentally that the observed Raman intensity was nonlinearly dependent on the power of the incident lightZhang et al. (2013). The contributions of the linear and nonlinear processes to the total intensity were found to be 40% and 60%, respectively, at the saturation conditionZhang et al. (2013). It is thus necessary to examine how the nonlinear process affects the Raman images of the molecule. Three processes, namely stimulated Raman as well as two hot luminescence processes (I and II), could contribute to the nonlinear Raman signal, when both pump and broadband SCPs are involved. In analogy to the theory proposed by Lee et al.Lee et al. (2004), the amplitude of induced nonlinear polarization also consists two terms
| (8) |
where
| (9) |
Here is the enhancement factor of the broadband SCP that has the duration of . The expression of and the definition of could be found in Supplemental Materialms . We would emphasize that is independent on the position of the TERS tip.
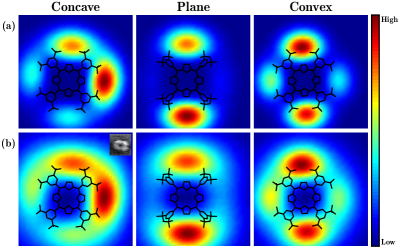
Similar to the linear process, the FC term is also completely dominant in the nonlinear process. Once the is obtained, in Eq. 5 could be replaced by or their summation for nonlinear or total Raman intensities, respectively, because the phases of them are unrelatedChemla (1980). Admittedly, obtaining the absolute value of linear and nonlinear polarizations requires the solution of the classical Maxwell’s equations for realistic nanostructures. Instead, we use the experimentally determined contributions of the linear and nonlinear terms in the saturation conditionZhang et al. (2013) to define the pre-factors. The calculated nonlinear Raman images with FWHM of 20 Å are depicted in Fig. 4(a). In general, the nonlinear images do have higher spatial resolution than their linear counterparts. However, for this particular system, the improvement is not as much as one anticipatedZhang et al. (2013). The calculated total Raman image (including both linear and nonlinear effects) from the concave configuration with the field distribution size of 20 Å, gives the best agreement with the experimental image as shown in Fig. 4(b). This result reveals that the actual size of the experimentally confined plasmonic field could be close to 20 Å, which is consistent with our numerical EM simulationsms and may be the decisive factor for the sub-nanometer Raman images. However, the increase of the nonlinear contribution to the total intensity will on the other hand be an effective way to further improve the resolution of the Raman image.
In summary, we have proposed a quantum mechanical description for the interaction between a molecule and a highly confined plasmonic field. It shows that the SCP could modify the transition matrix and result in the Raman images with high resolution. The usefulness of the description is highlighted by reproducing successfully the experimental Raman images of a H2TBPP molecule adsorbed on the Ag(111) surface. The theoretical framework established in this work lays the foundation for the future development of linear and nonlinear plasmonic spectroscopy.
This work was supported by the Ministry of Science and Technology of China (2010CB923300), Natural Science Foundation of China (21121003), Strategic Priority Research Program of Chinese Academy of Sciences (XDB01020200), Göran Gustafsson Foundation for Research in Natural Sciences and Medicine, and the Swedish Research Council (VR). The Swedish National Infrastructure for Computing (SNIC) was acknowledged for computer time.
References
- Stöckle et al. (2000) R. M. Stöckle, Y. D. Suh, V. Deckert, and R. Zenobi, Chem. Phys. Lett. 318, 131 (2000).
- Pettinger et al. (2004) B. Pettinger, B. Ren, G. Picardi, R. Schuster, and G. Ertl, Phys. Rev. Lett. 92, 096101 (2004).
- Zhang et al. (2013) R. Zhang, Y. Zhang, Z. C. Dong, S. Jiang, C. Zhang, L. G. Chen, L. Zhang, Y. Liao, J. Aizpurua, Y. Luo, J. L. Yang, and J. G. Hou, Nature 498, 82 (2013).
- Long (2002) D. A. Long, The Raman Effect: A Unified Treatment of the Theory of Raman Scattering by Molecules (Wiley, Chichester New York, 2002).
- Scully and Zubairy (1997) M. O. Scully and M. S. Zubairy, Quantum Optics, 1st ed. (Cambridge University Press, Cambridge New York, 1997).
- Albrecht (1961) A. C. Albrecht, J. Chem. Phys. 34, 1476 (1961).
- Lee et al. (2004) S.-Y. Lee, D. Zhang, D. W. McCamant, P. Kukura, and R. A. Mathies, J. Chem. Phys. 121, 3632 (2004).
- Purcell (1946) E. M. Purcell, Phys. Rev. 69, 681 (1946).
- Neugebauer et al. (2002) J. Neugebauer, M. Reiher, C. Kind, and B. A. Hess, J. Comput. Chem. 23, 895 (2002).
- Le Ru and Etchegoin (2009) E. Le Ru and P. Etchegoin, Principles of Surface-Enhanced Raman Spectroscopy: and Related Plasmonic Effects, 1st ed. (Elsevier, Amsterdam Boston, 2009).
- Archambault et al. (2010) A. Archambault, F. Marquier, J.-J. Greffet, and C. Arnold, Phys. Rev. B 82, 035411 (2010).
- Xu et al. (2004) H. Xu, X.-H. Wang, M. P. Persson, H. Q. Xu, M. Käll, and P. Johansson, Phys. Rev. Lett. 93, 243002 (2004).
- Johansson et al. (2005) P. Johansson, H. Xu, and M. Käll, Phys. Rev. B 72, 035427 (2005).
- Sass et al. (1981) J. K. Sass, H. Neff, M. Moskovits, and S. Holloway, J. Phys. Chem. 85, 621 (1981).
- Ayars et al. (2000) E. J. Ayars, H. D. Hallen, and C. L. Jahncke, Phys. Rev. Lett. 85, 4180 (2000).
- Iwasa and Nobusada (2009) T. Iwasa and K. Nobusada, Phys. Rev. A 80, 043409 (2009).
- (17) See Supplemental Material for theoretical background, computational details, and EM field simulations.
- Fu et al. (2009) Q. Fu, J. Yang, and Y. Luo, App. Phys. Lett. 95, 182103 (2009).
- Ditze et al. (2014) S. Ditze, M. Stark, F. Buchner, A. Aichert, N. Jux, N. Luckas, A. Görling, W. Hieringer, J. Hornegger, H.-P. Steinrück, and H. Marbach, J. Am. Chem. Soc. 136, 1609 (2014).
- Grimme (2006) S. Grimme, J. Comput. Chem. 27, 1787 (2006).
- Qiu et al. (2003) X. H. Qiu, G. V. Nazin, and W. Ho, Science 299, 542 (2003).
- Myers Kelley (2008) A. Myers Kelley, J. Phys. Chem. A 112, 11975 (2008).
- Macak et al. (2000) P. Macak, Y. Luo, and H. Ågren, Chem. Phys. Lett. 330, 447 (2000).
- Chemla (1980) D. S. Chemla, Rep. Prog. Phys. 43, 1191 (1980).