From pairwise to group interactions in games of cyclic dominance
Abstract
We study the rock-paper-scissors game in structured populations, where the invasion rates determine individual payoffs that govern the process of strategy change. The traditional version of the game is recovered if the payoffs for each potential invasion stem from a single pairwise interaction. However, the transformation of invasion rates to payoffs also allows the usage of larger interaction ranges. In addition to the traditional pairwise interaction, we therefore consider simultaneous interactions with all nearest neighbors, as well as with all nearest and next-nearest neighbors, thus effectively going from single pair to group interactions in games of cyclic dominance. We show that differences in the interaction range affect not only the stationary fractions of strategies, but also their relations of dominance. The transition from pairwise to group interactions can thus decelerate and even revert the direction of the invasion between the competing strategies. Like in evolutionary social dilemmas, in games of cyclic dominance too the indirect multipoint interactions that are due to group interactions hence play a pivotal role. Our results indicate that, in addition to the invasion rates, the interaction range is at least as important for the maintenance of biodiversity among cyclically competing strategies.
pacs:
02.50.+Le, 07.05.Tp, 89.75.FbI Introduction
Rock is wrapped by paper, paper is cut by scissors, and scissors are broken by a rock. This is the simple blueprint of the rock-paper-scissors game, where the three competing strategies form a closed loop of dominance. The game is popular among children and adults to decide on trivial disputes that have no obvious winner, but it is also the basis for the explanation of fascinating evolutionary processes that describe the essence of predator-prey interactions and evolutionary games Maynard Smith (1982); Hofbauer and Sigmund (1998); Mesterton-Gibbons (2001); Nowak (2006). Foremost, games of cyclic dominance play a prominent role in explaining the intriguing diversity in nature Frachebourg et al. (1996); Mobilia et al. (2006); Reichenbach et al. (2007a); Kerr et al. (2002); Reichenbach et al. (2007b); Mobilia (2010); Reichenbach and Frey (2008), but they are also able to provide insights into Darwinian selection Maynard Smith and Price (1973) as well as structural complexity Watt (1947) and pre-biotic evolution Rasmussen et al. (2004).
Cyclic interactions may also arise spontaneously in evolutionary games where the number of competing strategies is three or more. For example, cyclic dominance has been observed in public goods games with volunteering Hauert et al. (2002); Semmann et al. (2003), peer punishment Hauert et al. (2002); Helbing et al. (2010); Amor and Fort (2011), pool punishment Szolnoki et al. (2011); Sigmund et al. (2010) and reward Szolnoki and Perc (2010); Sigmund et al. (2001), but also in pairwise social dilemmas with coevolution Szolnoki and Perc (2009); Szolnoki et al. (2010) or with jokers Requejo et al. (2012). The ample attention to the theoretical aspects of cyclical interactions is fueled by actual observations of such interactions in nature. Prominent examples include the mating strategy of side-blotched lizards Sinervo and Lively (1996), overgrowth of marine sessile organisms Burrows and Hawkins (1998), genetic regulation in the repressilator Elowitz and Leibler (2000), and competition in microbial populations Durrett and Levin (1997); Kirkup and Riley (2004); Neumann and Jetschke (2010); Nahum et al. (2011).
The key to the sustenance of biodiversity, in addition to the inherent closed loop of dominance that governs the evolution of such systems, is often spatial structure Szabó and Fáth (2007); Perc et al. (2013); Jiang et al. (2011). In experiments with Escherichia coli, for example, it has been shown that arranging the bacteria on a Petri dish is crucial for keeping all three competing strains alive Kerr et al. (2002, 2006). Accordingly, simulations of spatial rock-paper-scissors and related games of cyclic dominance have a long and fruitful history Szabó et al. (1999); Frean and Abraham (2001); Reichenbach et al. (2006); Szabó et al. (2007); Peltomäki and Alava (2008); Peltomäki et al. (2008); Berr et al. (2009); He et al. (2010); Wang et al. (2010); Ni et al. (2010); Wang et al. (2011); Mathiesen et al. (2011); Avelino et al. (2012a); Jiang et al. (2012); Roman et al. (2012); Avelino et al. (2012b); Juul et al. (2012); Roman et al. (2013); Vukov et al. (2013); Laird (2014), which is firmly rooted in methods of statistical physics. In general, if the mobility in the population is sufficiently small Reichenbach et al. (2007a), the spatial rock-paper-scissors game leads to the stable coexistence of all three competing strategies, whereby the coexistence is maintained by the spontaneous formation of complex spatial patterns. Most intriguing recent examples of this phenomenon include the observation of labyrinthine clustering Juul et al. (2013) and interfaces with internal structure Avelino et al. (2014).
Here we wish to extend the scope of the spatial rock-paper-scissors game by abandoning the common assumption of single pairwise interactions. Traditionally, when two players are randomly selected from the population, one is able to invade the other based on the governing food web and the invasion rates Perc et al. (2007); Szabó and Szolnoki (2008). In reality, however, the fitness of each individual player depends not only on one nearest neighbor, but may be influenced by all nearest neighbors and beyond. Going from pairwise to simultaneous interactions in a group is known to vitally affect the outcome of evolutionary games Perc et al. (2013), but this transition has been neglected in games of cyclic dominance. To overcome this, we consider that the invasion rates determine individual payoffs, which in turn govern the process of strategy change. The traditional version of the game is recovered if the payoffs for each potential invasion stem from a single pairwise interaction, but the game differs if we consider interactions with nearest and next-nearest neighbors for the accumulation of payoffs. As we will show, the differences in the interaction range can decelerate as well as revert the invasion between the competing strategies, thus qualitatively changing the evolutionary outcome that would be expected based on the pairwise consideration of the governing food web. Indirect multipoint interactions that are due to simultaneous interactions within a group thus play a pivotal role in games of cyclic dominance, similarly as reported before for evolutionary social dilemmas Szolnoki et al. (2009).
The organization of this paper is as follows. We present the definition of the model and the elementary results that hold under well-mixed conditions in Section II. Main results are presented in Section III. We conclude with the summary of the results and a discussion of their implications in Section IV.
II Model definition
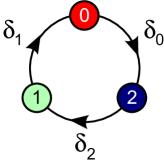
We consider the classic rock-paper-scissors game, where the three strategies cyclically dominate each other, as depicted schematically in Fig. 1. For convenience, we refer to the strategies as , and , where strategy invades strategy with probability , strategy invades strategy with probability , and strategy invades strategy with probability .
The stationary state can be described by the fractions of strategies where denotes the fraction of strategy in the population. In a well-mixed system, the time dependence of is described by the following system of differential equations
| (1) |
where runs from to in a cyclic manner. Due to the defined dynamics, the sum of all is conserved and is always equal to . The stationary values of are easily obtained according to
| (2) |
where again runs from to cyclically. This result indicates that the fractions of strategies are determined unambiguously by the three invasion rates. As reviewed in the Introduction, however, it is frequently assumed that the interactions among the competing strategies, which are summarized by the corresponding invasion rates, are more complex and in fact are described by a structured population. It is known that the transition from a well-mixed to a structured population affects the evolutionary outcome of the rock-paper-scissors game in both qualitative and quantitative ways. The question we seek to answer is whether the same holds on structured populations if we go from individual pairwise interactions to simultaneous group interactions.
For the spatial version of the game, we consider that each player is located on the site of a square lattice with periodic boundary conditions, where the grid contains sites. The three strategies are initially distributed uniformly at random with no sites left empty. We adopt the strategy notation of three-dimensional unit vectors
Accordingly, the payoff of player against the neighbor at site can be expressed by the following matrix product
| (3) |
where denotes the transpose of the state vector . In the present case, the payoff matrix is given by
| (4) |
The evolution of strategies proceeds in agreement with a random sequential update, where during a full Monte Carlo step every player receives a chance once on average to invade one randomly selected neighbor. In particular, a randomly selected player will invade the neighbor with the rate proportional to , where the acquisition of the payoffs and depends on the type of interaction that governs the evolutionary process. We will refer to an interaction as a “pair” interaction when the two competing players interact only with each other. As already noted, this returns the traditional version of the spatial rock-paper-scissors game, where the payoffs correspond directly to the invasion rates defined in Fig. 1. Moreover we will consider two additional cases, where the interaction range is gradually extended from the mentioned two-player interaction via the von Neumann neighborhood, entailing four pair interactions with the nearest neighbors, to the Moore neighborhood, entailing eight pair interactions. In the latter case, a player interacts with its four nearest as well as with four next-nearest neighbors simultaneously. This transition from individual pairwise to group interactions for the determination of payoffs is the key aspect of the current work.
In the following Section, for the sake of simplicity, we fix the invasion rate , thus and remain as the two free parameters. For technical reasons, we also always keep both parameters within the interval in order to avoid heavy finite size effects reported in Juul et al. (2013). By doing so, we achieve that during the Monte Carlo simulations the system size is always sufficiently large to get reliable results that are valid also in the large size limit. Our main conclusions, however, are robust and remain valid in the whole interval as well.
III Results
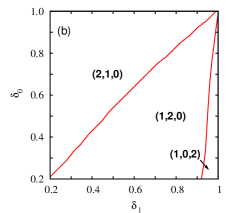
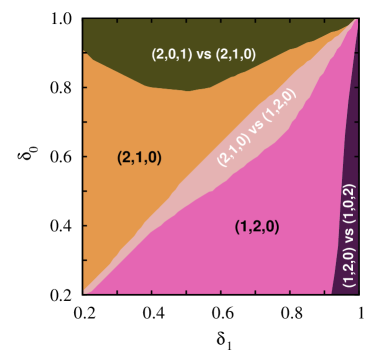
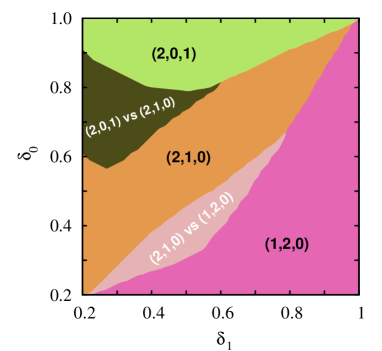
We begin by showing phase diagrams for different interaction ranges in Fig. 2, where the phases are defined according to the rank of strategy fractions in the population. The phase thus corresponds to a stationary state where . The phase, on the other hand, corresponds to . In panel (a) of Fig. 2, we show the phase diagram obtained in the well-mixed model. Since the invasion rate determines the invasion and the invasion rate determines the invasion, according to Eq. 2 the expected result is a right diagonal across the plane that delineates the phase transition. Replacing well-mixed interactions with “pair” interactions on the square lattice leads to expected quantitative and qualitative changes. As depicted in panel (b) of Fig. 2, the diagonal becomes slightly upward bent, but more importantly, a new phase emerges for large values that is missing under well-mixed conditions.
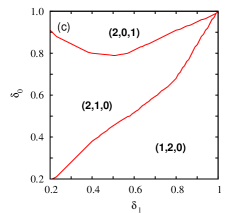
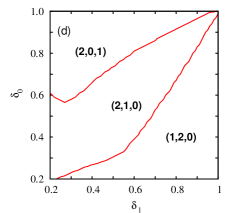
Significantly more unexpected is the observation that replacing “pair” interactions with von Neumann interactions and further with Moore interactions introduces further quantitative as well as qualitative changes. These changes are no longer due to the transition from well-mixed to structured populations, but are the sole consequence of different interaction ranges. As depicted in panels (c) and (d), a new phase emerges for large values that is absent under well-mixed conditions and “pair” interactions, moreover, the phase that we have observed for “pair” interactions vanishes. In addition to these qualitative changes that are due to the transition from pairwise to group interactions, quantitative changes responsible for the shifts in the position of the phase transitions on the plane are also clearly inferable.

The quantitative and qualitative differences that are due to different interaction ranges are displayed visually in Fig. 3. Domains that are labeled white indicate parameter regions where different interaction ranges result in different strategy rankings (qualitatively different phases), while domains that are labeled black indicate regions with solely quantitative differences between the otherwise identical phases. To explain these surprising differences, it is instructive to start with the well-mixed interactions. In this case, the invasions between the players depend only on their strategies. If we introduce spatial structure with “pair” interactions, then the qualitative differences are expected because each player has a limited range, and thus the invasions depends not only on the strategies, but also on the spatial configuration of players. These differences are thoroughly documented and expected, and they also exist in other evolutionary games, like for example in social dilemmas, where spatial reciprocity may help cooperators survive where under well-mixed conditions they would perish Nowak and May (1992). All the differences depicted in Fig. 3, however, do not have the same origin, and the arguments that apply when going from well-mixed to structured populations no longer apply when going from pairwise to group interactions on structured populations. Results presented in Fig. 3 evidence clearly that both quantitative and qualitatively differences are common when going from “pair” to von Neumann interactions (top), as well as when going from von Neumann to Moore interactions (bottom).
Instead of the known “well-mixed versus spatial” arguments, it is important to acknowledge the fact that increasing the interaction range leads to indirect multi-point interactions between players that may not be directly connected via the interaction network, and which in the absence of group interactions would not be involved in the same elementary invasion processes. The most important consequence of this fact is that the relation between two neighboring competing strategies will depend not only on the invasion rate between them as defined with the basic food web, but also on the presence (or absence) of third parties. Other direct neighbors, as well as next-nearest neighbors (depending on the interaction range), may critically affect and indeed modify the relations defined by the basic food web depicted in Fig. 1. To demonstrate the validity of this argument, we study the movement of invasion fronts between homogeneous domains of strategies, which are the main driving force behind spatial pattern formation.
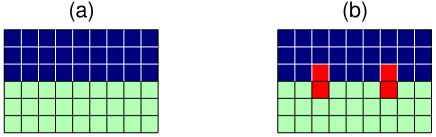
More precisely, we consider two different prepared initial states, as illustrated in Fig. 4. Firstly, shown in panel (a), only two competing strategies are present. Here we monitor the evolution of the frequency change of the dominant strategy – the so-called excess frequency – when starting from a symmetric initial state. In terms of the interaction range, we distinguish three different cases. In the first case, which we denote by , only the two individuals involved in the invasion process interact with each other. In the second case players collect their payoff from the interactions with their four nearest neighbors (von Neumann neighborhood, hence denoted by ). In the third case, we also consider the accumulation of payoff via the Moore neighborhood, which we denote by . Secondly, shown in panel (b), we insert blocks of third-strategy players (red) along the interface. Importantly, the third party is not involved directly in the movement of the interface. The red players are fixed and cannot change their strategy, nor can they invade other players. Their only role is to influence the payoffs of the competing green and blue players if the conditions for this are given, i.e., in case of von Neumann or Moore interactions. Similarly to the previously described initial state, here too we distinguish the same three interactions ranges, which we denoted by , and , respectively. Our goal is to determine how the presence of third-party players influences the invasion between the two competing predator-prey strategies.


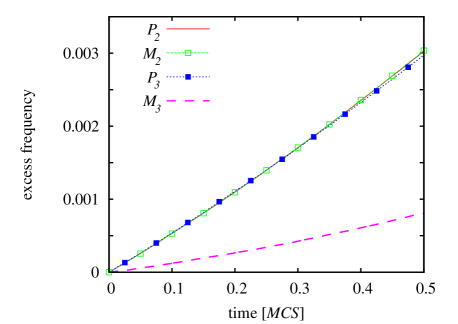
In Fig. 5, we first compare the invasions between two predator-prey strategies when pair and von Neumann interaction ranges are considered. As expected, if pair interactions govern the evolutionary process, there are no consequences stemming from the presence of the third strategy. Accordingly, the and curves are identical in both panels. The early evolution in case of von Neumann interactions without third-party players (the curve) is also almost the same as the and case, because sideward and backward neighbors give zero contribution to the payoffs of the players who are at the front of the invasion. The critical impact of the third-party players’ presence becomes obvious, however, when von Neumann interaction range is applied. Here the multi-point interactions that are due to the extended interaction range take full effect. In the upper panel, the third strategy lowers significantly the effective invasion velocity, thus leading to a slower rise of the excess frequency of the predating strategy. It is important to note that this effect alone is capable to shuffle the rank of strategies, and thus qualitatively affect the phases, because changing a single interaction rate could influence the whole system due to cyclic dominance. But even more strikingly, as depicted in the lower panel, multi-point interactions alone are able to reverse the direction of invasion. Predators thus become prey solely because of the nearby presence of a third strategy. We note that group interactions do not always have such a dramatic effect on the outcome of an evolutionary process, and for some pairs the effective invasion velocity between strategy domains remains practically unchanged, and the rank between species is preserved. The most striking effects can be observed in the regions labeled white in Fig. 3.
The same effects can also be observed if we compare the outcome of pair and Moore interactions, as depicted in Fig. 6. Results presented in the upper panel illustrate that the deceleration of the invasion front of predators can be even more spectacular. In the lower panel, the reversal of the direction of invasion is also clearly inferable. Furthermore, the even larger interaction range that is defined by the Moore neighborhood reveals another effect of group interactions. Namely, in the lower panel, there is obvious difference between the and (and ) curve. The early difference is due to the fact that players at the front of the invasion are, unlike in case of the von Neumann interaction, now able to pick up extra payoff from more players of the front line due to the extended interaction range. This in turn accelerates the invasion of the predators and thus shifts the curve above the and the reference case.

Importantly, strategy configurations (not shown here) demonstrate that the same invasion rates between individual strategies can manifest in significantly different effective invasion rates between competing domains, which ultimately results in easily observable differences between the emerging spatial patterns. Finally, we note that we have also tested the robustness of our observations by using different host lattices. For example, we have used the hexagonal lattice, where every player has six direct neighbors and which is frequently used in biologically motivated settings Hwang et al. (2011), and we have found that this lattice yields phase diagrams that are very similar to those that we have obtained for the square lattice in Fig. 2.
IV Discussion
We have studied the rock-paper-scissors game on a square lattice, thereby focusing on the transition from pairwise to group interactions governing the evolution of strategies. In addition to the expected effects of spatiality, which may introduce quantitative and qualitative changes in the evolutionary outcomes if compared to the well-mixed case, we have shown that the extent of the interaction range can have likewise profound consequences. We have demonstrated that increasing the interaction range from individual pairwise interactions to von Neumann interactions and further to Moore interactions can both decelerate the propagation of predator strategy as well as revert the direction of invasion contrary to its definition by the governing food web. These results cannot be attributed to the traditional arguments that describe the transition from well-mixed to structured populations. Instead, we have shown that the key to understanding the emergent phenomena when going from pairwise to group interactions lies in the indirect multi-point interactions between players that are due to the extended interaction range. These effective multi-point interactions link together players that do not meet directly, and which in the absence of group interactions would not be involved in the same elementary invasion processes. We have validated these arguments by studying the movements of invasion fronts between homogeneous domains of strategies, which are arguably the main driving force behind spatial pattern formation. Based on the monitoring of the excess frequency of predators, we have confirmed both the deceleration of invasion fronts as well as the reversal of the direction of invasion. In conclusion, we have shown that group interactions can have a profound impact on the outcome of cyclic dominance games, even exceeding the impact reported before for evolutionary social dilemmas, where in the absence of strategic complexity solely the impact of noise becomes independent of the topology of the interaction network Szolnoki et al. (2009).
Patterns resulting from cyclic dominance are common in nature, ranging from bacteria Durrett and Levin (1997); Kirkup and Riley (2004); Nahum et al. (2011) to plants Taylor and Aarssen (1990); Silvertown et al. (1992) to the scale of ecological systems Sinervo and Lively (1996); Burrows and Hawkins (1998). Several previous works have illustrated that invasion rates between competing species can influence the resulting morphology Law et al. (1997). Conversely, studying the morphology can be useful to deduce the microscopic invasion rates between species if they are not known, for example when bacteria or plants struggle for space. Our model illustrates, however, that conclusions stemming from such a procedure can be misleading, since the invasion rates alone do not determine the final fate of the competing species and their morphology. Moreover, in biological systems, it is widely accepted to measure the invasion rates or competition coefficients directly between species Thórhallsdóttir (1990); Law et al. (1997). The presence of a third party, however, can result not only in a quantitative change of the invasion velocity, but may also altogether change the direction of invasion. Naturally, the weight of these arguments increases further if the number of competing species increases, like for example in bacterial warfare where more than one toxin is present Szabó et al. (2007). Based on the presented results, we emphasize that it is important not to overlook the interaction range, which could also be a key parameter that renders reverse engineering cyclical interactions a very difficult undertaking.
Acknowledgements.
This research was supported by the Hungarian National Research Fund (Grant K-101490), TAMOP-4.2.2.A-11/1/KONV-2012-0051, John Templeton Foundation (FQEB Grant #RFP-12-22), and the Slovenian Research Agency (Grant J1-4055).References
- Maynard Smith (1982) J. Maynard Smith, Evolution and the Theory of Games (Cambridge University Press, Cambridge, U.K., 1982).
- Hofbauer and Sigmund (1998) J. Hofbauer and K. Sigmund, Evolutionary Games and Population Dynamics (Cambridge University Press, Cambridge, U.K., 1998).
- Mesterton-Gibbons (2001) M. Mesterton-Gibbons, An Introduction to Game-Theoretic Modelling, 2nd Edition (American Mathematical Society, Providence, RI, 2001).
- Nowak (2006) M. A. Nowak, Evolutionary Dynamics (Harvard University Press, Cambridge, MA, 2006).
- Frachebourg et al. (1996) L. Frachebourg, P. L. Krapivsky, and E. Ben-Naim, Phys. Rev. Lett. 77, 2125 (1996).
- Mobilia et al. (2006) M. Mobilia, I. T. Georgiev, and U. C. Täuber, Phys. Rev. E 73, 040903(R) (2006).
- Reichenbach et al. (2007a) T. Reichenbach, M. Mobilia, and E. Frey, Nature 448, 1046 (2007a).
- Kerr et al. (2002) B. Kerr, M. A. Riley, M. W. Feldman, and B. J. M. Bohannan, Nature 418, 171 (2002).
- Reichenbach et al. (2007b) T. Reichenbach, M. Mobilia, and E. Frey, Phys. Rev. Lett. 99, 238105 (2007b).
- Mobilia (2010) M. Mobilia, J. Theor. Biol. 264, 1 (2010).
- Reichenbach and Frey (2008) T. Reichenbach and E. Frey, Phys. Rev. Lett. 101, 058102 (2008).
- Maynard Smith and Price (1973) J. Maynard Smith and G. R. Price, Nature 246, 15 (1973).
- Watt (1947) A. S. Watt, J. Ecol. 35, 1 (1947).
- Rasmussen et al. (2004) S. Rasmussen, L. Chen, D. Deamer, D. C. Krakauer, N. H. Packard, P. F. Stadler, and M. A. Bedau, Science 303, 963 (2004).
- Hauert et al. (2002) C. Hauert, S. De Monte, J. Hofbauer, and K. Sigmund, Science 296, 1129 (2002).
- Semmann et al. (2003) D. Semmann, H.-J. Krambeck, and M. Milinski, Nature 425, 390 (2003).
- Helbing et al. (2010) D. Helbing, A. Szolnoki, M. Perc, and G. Szabó, PLoS Comput. Biol. 6, e1000758 (2010).
- Amor and Fort (2011) D. R. Amor and J. Fort, Phys. Rev. E 84, 066115 (2011).
- Szolnoki et al. (2011) A. Szolnoki, G. Szabó, and M. Perc, Phys. Rev. E 83, 036101 (2011).
- Sigmund et al. (2010) K. Sigmund, H. De Silva, A. Traulsen, and C. Hauert, Nature 466, 861 (2010).
- Szolnoki and Perc (2010) A. Szolnoki and M. Perc, EPL 92, 38003 (2010).
- Sigmund et al. (2001) K. Sigmund, C. Hauert, and M. A. Nowak, Proc. Natl. Acad. Sci. USA 98, 10757 (2001).
- Szolnoki and Perc (2009) A. Szolnoki and M. Perc, EPL 86, 30007 (2009).
- Szolnoki et al. (2010) A. Szolnoki, Z. Wang, J. Wang, and X. Zhu, Phys. Rev. E 82, 036110 (2010).
- Requejo et al. (2012) R. J. Requejo, J. Camacho, J. A. Cuesta, and A. Arenas, Phys. Rev. E 86, 026105 (2012).
- Sinervo and Lively (1996) B. Sinervo and C. M. Lively, Nature 380, 240 (1996).
- Burrows and Hawkins (1998) M. T. Burrows and S. J. Hawkins, Mar. Ecol. Prog. Ser. 167, 1 (1998).
- Elowitz and Leibler (2000) M. B. Elowitz and S. Leibler, Nature 403, 335 (2000).
- Durrett and Levin (1997) R. Durrett and S. Levin, J. Theor. Biol. 185, 165 (1997).
- Kirkup and Riley (2004) B. C. Kirkup and M. A. Riley, Nature 428, 412 (2004).
- Neumann and Jetschke (2010) G. F. Neumann and G. Jetschke, BioSystems 99, 155 (2010).
- Nahum et al. (2011) J. R. Nahum, B. N. Harding, and B. Kerr, Proc. Natl. Acad. Sci. USA 108, 10831 (2011).
- Szabó and Fáth (2007) G. Szabó and G. Fáth, Phys. Rep. 446, 97 (2007).
- Perc et al. (2013) M. Perc, J. Gómez-Gardeñes, A. Szolnoki, and L. M. Floría and Y. Moreno, J. R. Soc. Interface 10, 20120997 (2013).
- Jiang et al. (2011) L. L. Jiang, T. Zhou, M. Perc, and B. H. Wang, Phys. Rev. E 84, 021912 (2011).
- Kerr et al. (2006) B. Kerr, C. Neuhauser, B. J. M. Bohannan, and A. M. Dean, Nature 442, 75 (2006).
- Szabó et al. (1999) G. Szabó, M. A. Santos, and J. F. F. Mendes, Phys. Rev. E 60, 3776 (1999).
- Frean and Abraham (2001) M. Frean and E. D. Abraham, Proc. R. Soc. Lond. B 268, 1323 (2001).
- Reichenbach et al. (2006) T. Reichenbach, M. Mobilia, and E. Frey, Phys. Rev. E 74, 051907 (2006).
- Szabó et al. (2007) P. Szabó, T. Czárán, and G. Szabó, J. Theor. Biol. 248, 736 (2007).
- Peltomäki and Alava (2008) M. Peltomäki and M. Alava, Phys. Rev. E 78, 031906 (2008).
- Peltomäki et al. (2008) M. Peltomäki, M. Rost, and M. Alava, Phys. Rev. E 78, 050903(R) (2008).
- Berr et al. (2009) M. Berr, T. Reichenbach, M. Schottenloher, and E. Frey, Phys. Rev. Lett. 102, 048102 (2009).
- He et al. (2010) Q. He, M. Mobilia, and U. C. Täuber, Phys. Rev. E 82, 051909 (2010).
- Wang et al. (2010) W.-X. Wang, Y.-C. Lai, and C. Grebogi, Phys. Rev. E 81, 046113 (2010).
- Ni et al. (2010) X. Ni, R. Yang, W.-X. Wang, Y.-C. Lai, and C. Grebogi, Chaos 20, 045116 (2010).
- Wang et al. (2011) W.-X. Wang, X. Ni, Y.-C. Lai, and C. Grebogi, Phys. Rev. E 83, 011917 (2011).
- Mathiesen et al. (2011) J. Mathiesen, N. Mitarai, K. Sneppen, and A. Trusina, Phys. Rev. Lett. 107, 188101 (2011).
- Avelino et al. (2012a) P. P. Avelino, D. Bazeia, L. Losano, and J. Menezes, Phys. Rev. E 86, 031119 (2012a).
- Jiang et al. (2012) L.-L. Jiang, W.-X. Wang, Y.-C. Lai, and X. Ni, Phys. Lett. A 376, 2292 (2012).
- Roman et al. (2012) A. Roman, D. Konrad, and M. Pleimling, J. Stat. Mech. p. P07014 (2012).
- Avelino et al. (2012b) P. P. Avelino, D. Bazeia, L. Losano, J. Menezes, and B. F. Oliveira, Phys. Rev. E 86, 036112 (2012b).
- Juul et al. (2012) J. Juul, K. Sneppen, and J. Mathiesen, Phys. Rev. E 85, 061924 (2012).
- Roman et al. (2013) A. Roman, D. Dasgupta, and M. Pleimling, Phys. Rev. E 87, 032148 (2013).
- Vukov et al. (2013) J. Vukov, A. Szolnoki, and G. Szabó, Phys. Rev. E 88, 022123 (2013).
- Laird (2014) R. A. Laird, Oikos 123, 472 (2014).
- Juul et al. (2013) J. Juul, K. Sneppen, and J. Mathiesen, Phys. Rev. E 87, 042702 (2013).
- Avelino et al. (2014) P. P. Avelino, D. Bazeia, L. Losano, J. Menezes, and B. F. de Oliveira, Phys. Rev. E 89, 042710 (2014).
- Perc et al. (2007) M. Perc, A. Szolnoki, and G. Szabó, Phys. Rev. E 75, 052102 (2007).
- Szabó and Szolnoki (2008) G. Szabó and A. Szolnoki, Phys. Rev. E 77, 011906 (2008).
- Szolnoki et al. (2009) A. Szolnoki, M. Perc, and G. Szabó, Phys. Rev. E 80, 056109 (2009).
- Nowak and May (1992) M. A. Nowak and R. M. May, Nature 359, 826 (1992).
- Hwang et al. (2011) M. Hwang, M. Garbey, S. A. Berceli, and R. Tran-Son-Tay, Cell Mol. Bioeng. 2, 285 (2011).
- Taylor and Aarssen (1990) D. R. Taylor and L. W. Aarssen, Am. Nat. 136, 305 (1990).
- Silvertown et al. (1992) J. Silvertown, S. Holtier, J. Johnson, and P. Dale, J. Ecol. 80, 527 (1992).
- Law et al. (1997) R. Law, T. Herben, and U. Dieckmann, J. Ecol. 85, 505 (1997).
- Thórhallsdóttir (1990) T. E. Thórhallsdóttir, J. Ecol. 78, 909 (1990).