COLD WATER VAPOR IN THE BARNARD 5 MOLECULAR CLOUD
Abstract
After more than 30 years of investigations, the nature of gas-grain interactions at low temperatures remains an unresolved issue in astrochemistry. Water ice is the dominant ice found in cold molecular clouds, however, there is only one region where cold (10 K) water vapor has been detected – L1544. This study aims to shed light on ice desorption mechanisms under cold cloud conditions by expanding the sample. The clumpy distribution of methanol in dark clouds testifies to transient desorption processes at work – likely to also disrupt water ice mantles. Therefore, the Herschel HIFI instrument was used to search for cold water in a small sample of prominent methanol emission peaks. We report detections of the ground-state transition of -H2O () at 556.9360 GHz toward two positions in the cold molecular cloud Barnard 5. The relative abundances of methanol and water gas support a desorption mechanism which disrupts the outer ice mantle layers, rather than causing complete mantle removal.
1 INTRODUCTION
Recent observations of interstellar H2O by Herschel111Herschel is an ESA space observatory with science instruments provided by the European-led Principal Investigator consortia and with important participation from NASA. have revolutionized our understanding of the physics and chemistry of water at the elevated temperatures (100–3000 K) encountered in star-forming gas (e.g. Kristensen & van Dishoeck, 2011; van Dishoeck et al., 2011). In these energetic environments the observed H2O molecules could be formed in endoergic reactions involving H2 or readily evaporated and/or sputtered from dust mantles.
As water is the dominant ice component in dark molecular clouds (e.g., Öberg et al., 2011), measuring its gas-phase abundance can shed light on the nature of the gas-grain interaction at low temperatures (10 K) – an issue that remains unresolved after more than 30 years of investigation (e.g., Leger et al., 1985). Water vapor has only been detected in one dark cloud core, – L1544 (Caselli et al., 2012), and its low measured abundance supports the low upper limits previously obtained by SWAS (Snell et al., 2000) and ODIN (Klotz et al., 2008). This region is ostensibly the least viable target in which to search for water as many gas-phase molecules are frozen out onto the dust. Caselli et al. (2012) attribute the presence of H2O to the photodesorption of ice molecules by a weak, ambient ultraviolet (UV) radiation field (e.g., Prasad & Tarafdar, 1983).
However, this UV photodesorption mechanism cannot explain the fact that emission from putative photodesorbed molecules in dark clouds is known to be clumpy and not correlated to density structures as one would expect. Methanol in particular is a molecule that can only form by grain-surface reactions, and molecular maps show that CH3OH is enriched in some clumps but not in others (e.g., Buckle et al., 2006), suggesting that ice mantles must have been removed by a transient process. Because water and methanol have similar physisorption binding energies (Sandford & Allamandola, 1993), any such process should therefore also release water molecules. The gas phase dissociative recombination of protonated water re-forms water and OH molecules (which can go on to form water again), while dissociative recombination predominantly breaks the C–O bond of protonated methanol, and so the post-desorption lifetime of H2O molecules is much longer than that of CH3OH ( years longer at densities of 5104 cm-3).
In this Letter, we report on the detection of water at two positions in the cold dark cloud Barnard 5 with Herschel and discuss the implications for the gas-grain chemistry of molecular clouds.
2 OBSERVATIONS AND DATA REDUCTION
2.1 Barnard 5
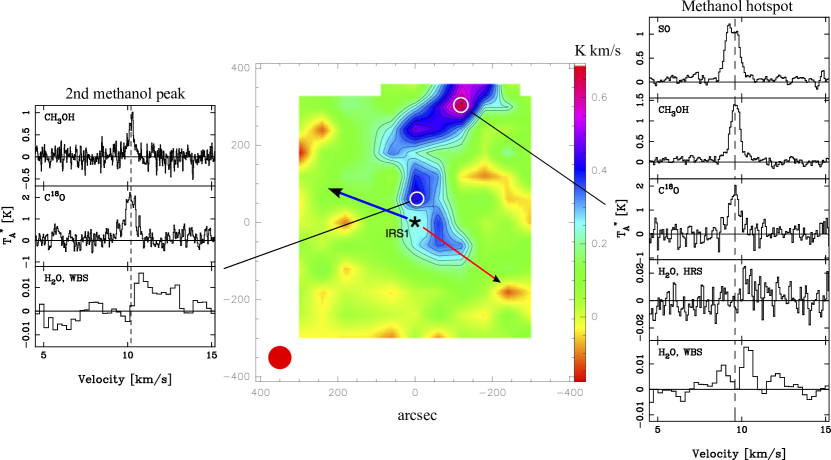
The Barnard 5 cloud in Perseus (B5) has four known protostars, of which the most prominent Class I protostar IRS1 drives an energetic outflow into the surrounding cloud material (Langer et al., 1996). CO and NH3 maps indicate that B5 has a very clumpy morphology (Goldsmith et al., 1986; Pineda et al., 2011) and molecular maps in several other species (e.g., N2H+, CH3OH, HC3N, SO, CCS, c-C3H2) show that these clumps are chemically differentiated (S. B. Charnley et al. 2014, in preparation) in a manner similar to that found in the sample of Buckle et al. (2006). We selected two positions for the -H2O search: a main methanol peak - hereafter the ”methanol hotspot” – that is offset from IRS1 by (′,′) and not associated with a core or column density peak as traced by C18O or 850 m continuum (Hatchell et al., 2005); and a weaker secondary peak closer to IRS1, see Figure 1.
The HIFI instrument (de Graauw et al., 2010) on-board the Herschel Space Observatory (Pilbratt et al., 2010) was used to observe the ground-state transition of -H2O () at 556.9360 GHz toward two positions in B5 – the methanol hotspot at R.A.=3h47m3210, decl.=+32°56′430 and the second methanol peak at 3h47m404, +32°52′280 (J2000.0) – on August 11, 2012 (OT2). Position switching mode was used with OFF positions at (′,0′), chosen for lack of CO emission (Goldsmith et al., 1986). The LO frequency in HIFI band 1b was set to 564.56 GHz in both L and R polarization, placing the line in the lower side band, and the total integration time (ON+OFF) was about 40 minutes for each source. Both the Wide Band Spectrometer (WBS) and the High Resolution Spectrometer (HRS) were used, and because emission lines from the region are known to be narrow (0.5–0.8 km s-1) the HRS was configured to high resolution mode with a band width of 230 MHz, corresponding to a spectral resolution of 125 kHz, or 0.07 km s-1 at this frequency. The methanol hotspot was also observed for a total of 60 minutes integration time on March 7, 2013 (DDT) using the same instrument setup. Observations were performed under observing programs OT2_ewirst01_2 and DDT_ewirst01_3, and the data presented here is available from the Herschel Science Archive222http://archives.esac.esa.int/hda/ui/ under observing IDs 1342249424, 1342249425, and 1342266407.
The beam FWHM is 38 at this frequency, the forward and main-beam efficiencies = 96% and = 75%, respectively. Detailed information about the HIFI calibration including beam efficiency, mixer sideband ratio, pointing, etc., can be found on the Herschel internet site333http://herschel.esac.esa.int/. The in-flight performance is described by Roelfsema et al. (2012).
Spectra of both polarizations were reduced separately using the Herschel Interactive Processing Environment (Ott, 2010), version 10.0.0. Subsequently, data FITS files were exported to the spectral analysis software XS444Developed by Per Bergman, Onsala Space Observatory, Sweden; http://www.chalmers.se/rss/oso-en/observations/data-reduction-software for further reduction and analysis. After linear baseline subtraction and frequency alignment, the two polarizations for each observing ID and spectrometer were averaged together, weighted by system temperature and integration time. Pointing offsets between polarizations were within 7, i.e., less than 20% of the beam size.
2.2 Other Sources
During the original OT2 program and the subsequent DDT_ewirst01_4, we also observed methanol peak positions in L1512, TMC-1 and TMC-1C, all offset from known protostellar activity. Table 1 summarizes these observations, with WBS rms noise temperatures on the scale. Only upper limits on the abundance/emission from -H2O () were obtained. These limits and associated implications are discussed respectively in Sections 3.2 and 4.
3 RESULTS AND ANALYSIS
Two emission peaks, offset from the systemic velocity (=9.6 km s-1) at 8.9 km s-1 and 10.3 km s-1, are detected toward the methanol hotspot in the combined WBS spectrum from both observing runs. The rms noise at this resolution is 2.9 mK and the confidence level of the detection across a 3 km s-1 range around the is 6. Comparing the water spectra to those of other molecules toward the methanol hotspot in Figure 1, the water line profile can be interpreted as a self-absorbed emission line around the systemic velocity. The asymmetry in peak intensities, with a suppressed blue component, is then indicative of low velocity expansion or outflow in the methanol clump. This is commonly observed for water in massive star-forming regions (e.g. Ashby et al., 2000), but has never before been observed toward cold, non-star forming gas.
Toward the second methanol peak, the WBS spectrum noise rms is 5 mK. We find a tentative detection of water emission at velocities higher than the , corresponding to 3 rms when integrated over a 3 km s-1 range around the , see Figure 1. See below for a further discussion on this tentative detection.
Before further analysis water spectra were multiplied by the total efficiency factor of /=1.26 (HIFI Observers’ Manual version 2.4) in order to get them on the scale. Note that the HRS OT2 data show artifacts in the spectrum at the velocity of the emission feature, and is therefore not included in any analysis.
3.1 Analysis
In recent years, submillimeter continuum surveys of the Perseus region have contributed to the understanding of cold dust properties around the B5 methanol hotspot. A dust temperature map based on Spitzer and Two Micron All Sky Survey2 data is available from the COMPLETE database555http://www.cfa.harvard.edu/COMPLETE/ and estimates =13 and 14 K for the methanol hotspot and the second position in B5, respectively (Schnee et al., 2008). In addition, the whole Perseus region has been observed with both PACS and SPIRE (S. Pezzuto et al. in preparation) as part of the Gould Belt Survey Herschel Key program (KPGT_pandre_1, André et al., 2010). Temperature and column density maps show no column density peak coinciding with the methanol hotspot within the Herschel main beam, while the dust temperature agrees with the Schnee et al. (2008) map (S. Pezzuto, private communication). The second methanol peak however coincides to within 20″ with a column density peak and temperature minimum (12 K), indicating the presence of a core.
The emission line becomes optically thick at low column densities, and in cold gas essentially all -water molecules reside in their ground-state. However, water excitation and radiative transfer are significantly complicated by the very large optical depths encountered, subthermal excitation, and possibility of population inversion. In order to interpret the water line profile suggested by our observations we use an accelerated lambda iteration (ALI) scheme (Rybicki & Hummer, 1991), including these non-LTE effects, to solve the radiative transfer in a spherically symmetric model cloud. The ALI code is based on that used and tested by, e.g., Maercker et al. (2008), but modified by P. Bergman to take into account several collision partners.
To estimate the physical properties of the desorbed gas at the B5 methanol hotspot, the observed methanol emission line quartet around 96.7 GHz (S. B. Charnley et al. in preparation) was modeled using ALI. A- and E-type methanol were modeled separately, with molecular data from the Cologne Database for Molecular Spectroscopy666http://www.ph1.uni-koeln.de/vorhersagen/ (Müller et al., 2005) and collision rates adapted from Rabli & Flower (2010). Both line shapes and intensities are well reproduced by a homogeneous, 0.08 pc diameter spherical model clump whose physical properties are given in Table 2, and where the molecular spin ratio A/E1. The size of the methanol emitting region in this model is defined by map data, the total H2 column density is of the same order as that found by the Gould Belt Survey, but the gas kinetic temperature has to be lower than their derived dust temperature, as low as 9 K, to reproduce observed line intensity ratios. The resulting average column density over the 64″ARO 12m beam is (CH3OH)= cm-2, and the total H2 mass of the model clump is 0.64 , which is less than half of its virial mass (3.02 ) indicating that it is gravitationally unbound.
Molecular data for -H2O was taken from the Leiden Atomic and Molecular Database777Available at http://www.strw.leidenuniv.nl/ moldata (LAMDA) (Schöier et al., 2005). Collisional excitation of -H2O by both ortho- and para-H2 is taken into account, state-to-state collisional rates are adapted from Dubernet et al. (2009) and Daniel et al. (2011), respectively. At low temperatures water excitation is very sensitive to the ortho-to-para ratio (OPR) in H2 and the thermal equilibrium OPR at 10 K is . However, due to formation on grains and chemical recycling of H2, such low OPR is not expected to be reached within the lifetime of a dark cloud (e.g., Flower et al., 2006; Pagani et al., 2011), which is also consistent with observations (Troscompt et al., 2009). Here we adopt a constant OPR value of 0.001, close to that predicted for a 10 K cloud of H2 density 104 cm-3 by Flower et al. (2006).
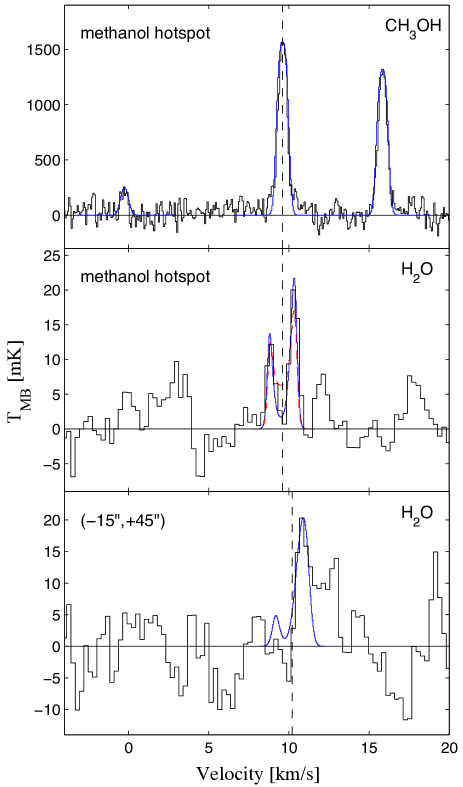
Peak intensities in the water line profile toward the B5 methanol hotspot can be modeled in ALI from the same spherical clump model as used for methanol above by adjusting the turbulent velocity and adding a slow expansion increasing linearly from zero at the cloud center to at the cloud edge. This slow expansion velocity can be included in the methanol model without hampering the fit, see the top panel of Figure 2. However, in order to reproduce the deep central absorption, an outer envelope of lower density has to be included in the water model. The mid panel of Figure 2 compares the best fit model with envelope to the corresponding model without, where the temperature, turbulent velocity, and water abundance are kept constant, and the expansion velocity levels out to a constant value in the envelope (parameters in the left column of Table 2). Note that in the best-fit model the bulk of the water column originates in the methanol clump while the methanol-free envelope, possibly testifying to a longer time since desorption, only contributes by 10%. At a temperature of 9 K we find that the ortho water abundance, , has to be around . At a 10 times higher H2 OPR, this water abundance would only have to be 5% lower for the model to fit the data.
Through only small adjustments to the cloud parameters, the water spectrum toward the second methanol peak may also be reproduced using the ALI model. The lower panel of Figure 2 shows this WBS spectrum together with the model result for a somewhat denser ((H2)= cm-3) cloud at =10.2 km s-1 where the expansion velocity increases to be equal to the turbulent velocity in the outer envelope (see parameters in Table 2). This velocity relation is required to explain the lack of a blue-shifted emission component as seen toward the methanol hotspot. The temperature is kept at 10 K and the ortho water abundance in this model is relative to H2.
3.2 Other Sources
For a first-order estimate of the L1512, TMC-1, and TMC-1C water abundance upper limits we exploit the fact that emission in the -H2O ground-state transition never gets thermalized at typical dark cloud densities; therefore, even if the emission is optically thick the high escape probability for emitted photons ensures that we are in the optically thin limit (e.g., Snell et al., 2000). Then the -H2O abundance can be expressed as
| (1) |
where the integrated intensity is given in K km s-1, the column density in cm-2, and the density in cm-3. Table 1 lists the resulting water abundance upper limits, assuming a kinetic temperature of =10 K, a molecular hydrogen density of 5 cm-3, and H2 column density of cm-2.
4 DISCUSSION
We have detected cold gas-phase water at two positions in the B5 molecular cloud. The fact that these positions correspond to peaks in the CH3OH distribution supports the view that the water has recently been desorbed from dust grain mantles. The derived H2O/H2 abundance of at the methanol ”hotspot” is more than an order of magnitude greater than that found by Caselli et al. (2012) in L1544, whereas that derived closer to IRS1 of is comparable. The large amount of water and methanol observed at a position uncorrelated to any core-like density structure suggests that UV photodesorption is not the mechanism for removing molecules from the surfaces of dust grains, but supports the scenario modeled by Charnley & Rodgers (2009), where spatial inhomogeneity is a consequence of the ice formation process.
The solid CH3OH fraction toward B5 IRS1 has been estimated to be 6% relative to water ice and so, if evaporated, the water in B5 would have H2O/H2 10-4 (Boogert et al., 2004). Even considering a several orders of magnitude lower water ice abundance further away from the cloud density peak, the low observed abundance of gas-phase water at the methanol hotspot implies that the operating desorption mechanism cannot cause complete disruption of ice mantles. For a derived CH3OH/H2 abundance of at the methanol hotspot, the gas-phase CH3OH/H2O ratio in the clump is 1.5. This demonstrates that only partial removal of ice material rich in methanol has occurred. This is consistent with recent theoretical models of grain mantle formation which follow the chemical composition of each ice monolayer as it is formed (Charnley & Rodgers, 2009; Garrod & Pauly, 2011; Vasyunin & Herbst, 2013). In these calculations CH3OH-rich monolayers form late in the evolution, as the atomic O/H ratio in the gas falls and water formation becomes concomitantly less efficient, and resides nearest to the mantle surface. Desorption of these monolayers can account for the CH3OH/H2O ratios measured in B5 and therefore places constraints on the efficiency of the actual mantle desorption process.
Ice mantle desorption at the methanol hotspot is not likely related to the protostellar activity of IRS 1: the large-scale outflow extends in the NE-SW directions rather than to the NW (Yu et al., 1999), and the projected distance from IRS 1 of 0.55 pc (see Figure 1) is too far for magnetohydrodynamic (MHD) waves to propagate and cause mantle disruption (e.g., Markwick et al., 2000). If cosmic-ray-induced photoevaporation or exoergic surface reactions were dominating the desorption, the methanol distribution would be less clumpy and rather follow the H2 column density distribution. Thus such continuous processes cannot explain the elevated levels of desorbed ices at the hotspot.
One possibility is that desorption is caused by collisions between small gas clumps that are interacting and merging (Takakuwa et al., 2003; Buckle et al., 2006). In this scenario, collisions between individual grains cause a transient heating which can result in runaway recombination of free radicals in the ice and subsequent sublimation of ice mantle molecules (Schutte & Greenberg, 1991). For collision velocities of the same order as the methanol line width of 0.7 km s-1, colliding grain temperatures would rise to 90 K (following Draine, 1985), warm enough to even desorb water and methanol thermally. Evaporation of a small fraction of the outer ice layers in the form of H2O or CH3OH would rapidly cool these grains down to 25 K and thus be consistent with the observed low dust temperatures and gas-phase abundances of water and methanol as compared to the ice toward IRS 1.
As mentioned, the second methanol peak nearly coincides with a column density peak and temperature minimum (12 K) in continuum, indicating the presence of a core, and it is only about 0.07 pc away from IRS 1. It also exhibits a lower methanol and water abundance than the methanol hotspot – water abundance is close to that observed toward L1544 (Caselli et al., 2012). Therefore UV photodesorption of water in a layer around the core; similar to the L1544 model; cannot be excluded, but the position is also close enough to IRS 1 for propagating MHD waves to cause mantle disruption.
Can the fact that water is not detected in the other three sample sources be accounted for in this scenario? In the two TMC 1 sources the estimated gas-phase CH3OH/H2O ratios, based on methanol data from Takakuwa et al. (2000, 2003), are at least five times higher than in B5. Thus, the desorbed outer monolayers would have to reflect that ratio. However, if water line self-absorption is as severe as in B5, the upper limits given in Table 1 could be adjusted upward by as much as a factor of five, accounting for that difference. The upper limit in L1512 is not significant assuming that similar mantle removal processes are at work.
The discovery of gas-phase water in B5 brings new insight to the enigma of interstellar water chemistry. In B5, future observations of other complex mantle molecules believed to form along with methanol, as well as various deuterated isotopologues, will shed further light on the nature of the surface desorption process.
References
- André et al. (2010) André, P., Men’shchikov, A., Bontemps, S., et al. 2010, A&A, 518, L102
- Ashby et al. (2000) Ashby, M. L. N., Bergin, E. A., Plume, R., et al. 2000, ApJ, 539, L115
- Boogert et al. (2004) Boogert, A. C. A., Pontoppidan, K. M., Lahuis, F., et al. 2004, ApJS, 154, 359
- Buckle et al. (2006) Buckle, J. V., Rodgers, S. D., Wirstrom, E. S., et al. 2006, Faraday Discussions, 133, 63
- Caselli et al. (2012) Caselli, P., Keto, E., Bergin, E. A., et al. 2012, ApJ, 759, L37
- Charnley & Rodgers (2009) Charnley, S. B., & Rodgers, S. B. 2009, in Astronomical Society of the Pacific Conference Series, Vol. 420, Bioastronomy 2007: Molecules, Microbes and Extraterrestrial Life, ed. K. J. Meech, J. V. Keane, M. J. Mumma, J. L. Siefert, & D. J. Werthimer , 29–+
- Daniel et al. (2011) Daniel, F., Dubernet, M.-L., & Grosjean, A. 2011, A&A, 536, A76
- de Graauw et al. (2010) de Graauw, T., Helmich, F. P., Phillips, T. G., et al. 2010, A&A, 518, L6
- Draine (1985) Draine, B. T. 1985, in Protostars and Planets II, ed. D. C. Black & M. S. Matthews, 621–640
- Dubernet et al. (2009) Dubernet, M.-L., Daniel, F., Grosjean, A., & Lin, C. Y. 2009, A&A, 497, 911
- Flower et al. (2006) Flower, D. R., Pineau Des Forets, G., & Walmsley, C. M. 2006, A&A, 449, 621
- Garrod & Pauly (2011) Garrod, R. T., & Pauly, T. 2011, ApJ, 735, 15
- Goldsmith et al. (1986) Goldsmith, P. F., Langer, W. D., & Wilson, R. W. 1986, ApJ, 303, L11
- Hatchell et al. (2005) Hatchell, J., Richer, J. S., Fuller, G. A., et al. 2005, A&A, 440, 151
- Klotz et al. (2008) Klotz, A., Harju, J., Ristorcelli, I., et al. 2008, A&A, 488, 559
- Kristensen & van Dishoeck (2011) Kristensen, L. E., & van Dishoeck, E. F. 2011, Astronomische Nachrichten, 332, 475
- Langer et al. (1996) Langer, W. D., Velusamy, T., & Xie, T. 1996, ApJ, 468, L41
- Leger et al. (1985) Leger, A., Jura, M., & Omont, A. 1985, A&A, 144, 147
- Maercker et al. (2008) Maercker, M., Schöier, F. L., Olofsson, H., Bergman, P., & Ramstedt, S. 2008, A&A, 479, 779
- Markwick et al. (2000) Markwick, A. J., Millar, T. J., & Charnley, S. B. 2000, ApJ, 535, 256
- Müller et al. (2005) Müller, H. S. P., Schlöder, F., Stutzki, J., & Winnewisser, G. 2005, Journal of Molecular Structure, 742, 215
- Öberg et al. (2011) Öberg, K. I., Boogert, A. C. A., Pontoppidan, K. M., et al. 2011, ApJ, 740, 109
- Ott (2010) Ott, S. 2010, in Astronomical Society of the Pacific Conference Series, Vol. 434, Astronomical Data Analysis Software and Systems XIX, ed. Y. Mizumoto, K.-I. Morita, & M. Ohishi, 139
- Pagani et al. (2011) Pagani, L., Roueff, E., & Lesaffre, P. 2011, ApJ, 739, L35
- Pilbratt et al. (2010) Pilbratt, G. L., Riedinger, J. R., Passvogel, T., et al. 2010, A&A, 518, L1
- Pineda et al. (2011) Pineda, J. E., Goodman, A. A., Arce, H. G., et al. 2011, ApJ, 739, L2
- Prasad & Tarafdar (1983) Prasad, S. S., & Tarafdar, S. P. 1983, ApJ, 267, 603
- Rabli & Flower (2010) Rabli, D., & Flower, D. R. 2010, MNRAS, 406, 95
- Roelfsema et al. (2012) Roelfsema, P. R., Helmich, F. P., Teyssier, D., et al. 2012, A&A, 537, A17
- Rybicki & Hummer (1991) Rybicki, G. B., & Hummer, D. G. 1991, A&A, 245, 171
- Sandford & Allamandola (1993) Sandford, S. A., & Allamandola, L. J. 1993, ApJ, 417, 815
- Schnee et al. (2008) Schnee, S., Li, J., Goodman, A. A., & Sargent, A. I. 2008, ApJ, 684, 1228
- Schöier et al. (2005) Schöier, F. L., van der Tak, F. F. S., van Dishoeck, E. F., & Black, J. H. 2005, A&A, 432, 369
- Schutte & Greenberg (1991) Schutte, W. A., & Greenberg, J. M. 1991, A&A, 244, 190
- Snell et al. (2000) Snell, R. L., Howe, J. E., Ashby, M. L. N., et al. 2000, ApJ, 539, L93
- Takakuwa et al. (2003) Takakuwa, S., Kamazaki, T., Saito, M., & Hirano, N. 2003, ApJ, 584, 818
- Takakuwa et al. (2000) Takakuwa, S., Mikami, H., Saito, M., & Hirano, N. 2000, ApJ, 542, 367
- Troscompt et al. (2009) Troscompt, N., Faure, A., Maret, S., et al. 2009, A&A, 506, 1243
- van Dishoeck et al. (2011) van Dishoeck, E. F., Kristensen, L. E., Benz, A. O., et al. 2011, PASP, 123, 138
- Vasyunin & Herbst (2013) Vasyunin, A. I., & Herbst, E. 2013, ApJ, 762, 86
- Yu et al. (1999) Yu, K. C., Billawala, Y., & Bally, J. 1999, AJ, 118, 2940
| Source | ObsId | aaAt 0.3 km s-1 resolution. | (-H2O) |
|---|---|---|---|
| L1512_meth | 1342250434 | 37 mK | 1.5e-8 |
| TMC-1C, clump6-1 | 1342266589 | 9 mK | 4e-9 |
| TMC-1, ch3oh-1 | 1342266590 | 8 mK | 4e-9 |
| CH3OH | H2O | H2O | |
| ”” | ”” | ||
| [pc] | 0.04 | 0.04 | 0.04 |
| (H2) [cm-3] | 5.0(4) | 5.0(4) | 9.0(4) |
| [] | 0.64 | 0.64 | 1.35 |
| [K] | 9 | 9 | 10 |
| [K] | 13 | 13 | 14 |
| [km s-1] | 0.3 | 0.42 | 0.5 |
| [km s-1] | - | 0.12 | 0.5 |
| 3.9() | 1.9() | 5.5() | |
| [pc] | - | 0.08 | 0.08 |
| (H2) [cm-3] | - | 5.0(3) | 9.0(3) |
| [] | - | 0.55 | 0.79 |
| [km s-1] | - | 0.12 | 0.5 |