Debris disc formation induced by planetary growth
Abstract
Several hundred stars older than 10 million years have been observed to have infrared excesses. These observations are explained by dust grains formed by the collisional fragmentation of hidden planetesimals. Such dusty planetesimal discs are known as debris discs. In a dynamically cold planetesimal disc, collisional coagulation of planetesimals produces planetary embryos which then stir the surrounding leftover planetesimals. Thus, the collisional fragmentation of planetesimals that results from planet formation forms a debris disc. We aim to determine the properties of the underlying planetesimals in debris discs by numerically modelling the coagulation and fragmentation of planetesimal populations. The brightness and temporal evolution of debris discs depend on the radial distribution of planetesimal discs, the location of their inner and outer edges, their total mass, and the size of planetesimals in the disc. We find that a radially narrow planetesimal disc is most likely to result in a debris disc that can explain the trend of observed infrared excesses of debris discs around G-type stars, for which planet formation occurs only before 100 million years. Early debris disc formation is induced by planet formation, while the later evolution is explained by the collisional decay of leftover planetesimals around planets that have already formed. Planetesimal discs with underlying planetesimals of radii km at AU most readily explain the Spitzer Space Telescope 24 and 70 fluxes from debris discs around G-type stars.
keywords:
Planet formation – Debris discs.1 Introduction
The circumstellar discs observed around several hundred main sequence stars are mainly gas poor, faint discs, and are mostly revealed by excess infrared emission around the stars. Dust grains to which the observed emission is attributed have lifetimes much shorter than the ages of the central stars; dust grains are continuously replenished by collisional cascades from hidden planetesimals, approximately kilometer-sized or larger bodies. However, since gravity plays a dominant role in determining the outcome of planetesimal collisions, collisional fragmentation of planetesimals to start collisional cascades needs collisional velocities between planetesimals exceeding their surface escape velocities. Therefore, significant perturbations to increase the collisional velocities between planetesimals for collisional fragmentation are required for the formation of debris discs. Plausible candidates for the perturbations of planetesimals in debris discs are (i) an early stellar encounter (Kobayashi & Ida, 2001), (ii) the existence of massive gaseous planets (e.g., Mustill & Wyatt, 2009), and (iii) the formation of planetary embryos in a planetesimal disc (e.g., Kenyon & Bromley, 2004). In this paper, we focus on debris discs induced by planetary formation.
Planetesimals formed in a protoplanetary disc are expected to have low random motions. Collisions between planetesimals result in coagulation. Gravitational focusing and dynamical friction lead to runaway growth of planetesimals and the formation of a single planetary embryo in each annulus of the disc. Embryos continue growing by collisional accretion of leftover planetesimals, which themselves do not grow significantly. Once embryos become sufficiently massive, planetesimals start effective collisional fragmentation. Small bodies resulting from collisional fragmentation of planetesimals collide with each other and become smaller still. The collisional cascade grinds bodies down until radiation pressure from the host star blows them away.
The collisional cascade and the subsequent blow-out reduce the surface density of planetesimals in the disc. Along with this reduction, embryo growth stalls (e.g., Kobayashi et al., 2010) and the dust mass supplied by the collisional cascade decreases. On the other hand, the formation timescale of planetary embryos is longer in the outer disc; planetary growth propagates from the inner to outer disc. When the dust mass produced by planet formation decreases in the inner disc, subsequent planet formation increases the dust production rate in the outer disc. Therefore, inside-out planet formation can maintain a detectable amount of debris in broad planetesimal discs (e.g., Kenyon & Bromley, 2004, 2008). Note that the brightness evolution of debris discs depends on the broadness of initial planetesimal discs, as shown below.
Planetesimal formation is still a critical issue in the theory of planet formation. Recently, it has been shown that planetesimals may be formed from pebbles accumulated in vortices in a turbulent disc (e.g., Cuzzi, Hogan, & Shariff, 2008) or by direct collisional coagulation of fluffy dust aggregates (Okuzumi et al., 2012). Planetesimal size depends on the formation process. In addition, planetesimal formation might occur in limited locations. The initial planetesimal size and spatial distribution influence the planetary embryo formation timescale and therefore the temporal evolution of a debris disc.
Infrared surveys by IRAS, ISO, the Spitzer Space Telescope and others have shown that infrared excesses from debris discs around main-sequence stars are common. In particular, various photometric surveys of hundreds of nearby stars have been conducted by the Spitzer Space Telescope. Although observations have been done for many types of stars, in this paper we are interested in planet formation around solar type stars, and thus we focus on debris discs around G-type stars. The observed infrared excesses mainly decay with stellar age (see Fig. 1). The time evolution of debris discs induced by planet formation depends on the radial profiles of the initial planetesimal discs, the initial sizes of planetesimals, and their total masses. Therefore, the temporal evolution of infrared excesses gives constraints on the conditions of planetesimal discs that produce planets and debris discs.

In this paper, we investigate the temporal evolution of debris discs induced by planet formation. In § 2, we estimate the radii and masses of debris discs from observational Spitzer MIPS data. In § 3, we describe our collision model and the mass evolution of bodies through collisions. In § 4, we carry out simulations for debris disc formation induced by planetary embryo formation, and give constraints on initial conditions; the radii of the inner and outer edges of initial planetesimal disc, initial disc mass, and the initial radius of planetesimals. In § 5, we discuss the origin of the inner and outer edges of discs, such as gas depletion, early stellar encounters, and planetesimal formation, and their relation with the solar system.
2 Disc Radii and Masses
We consider an optically thin debris disc radially distributed from to . The received flux at frequency , , from thermal emission of the disc around a central star at a distance from the observer is given by
| (1) |
where is the geometrical cross section of a spherical grain with radius , is the absorption efficiency at frequency , is the surface number density of dust grains with sizes ranging from to at a distance from the central star, is the dust temperature dependent on and , is the Planck function, is the speed of light, is the Planck constant, and is the Boltzmann constant. The flux is sensitive to the smallest grain radius , compared to the largest one . In debris discs, dust grains are supplied from collisional fragmentation. Small grains with radius are blown out by radiation pressure around the solar type star (e.g., Burns, Lamy, & Soter, 1979; Kobayashi et al., 2008, 2009).
The temperature of dust particles is determined by the energy equilibrium between stellar radiation and thermal emission, given by
| (2) |
where the stellar radiation is assumed to be blackbody with effective temperature and is the radius of the central star. If the dust radius is much larger than the incident radiation wavelength , . For , , where is the imaginary part of the complex refractive index (e.g., Bohren & Huffman, 1983). For blackbody grain (), the temperature is independent of grain size and is given by , where is the solar radius.
The fluxes of debris discs around G-type stars, , divided by host star fluxes were obtained from published observations at 24 and with the MIPS photometer of the Spitzer Space Telescope (see Fig. 1). The debris discs revealed by high-resolution imaging are narrow rather than broad and their dust size distributions are approximately given by a single power law due to collisional cascades. If we assume that , , , , and where is a constant, we obtain and from flux ratios at 24 and 70µm. Fig. 2 shows the radii (r) and masses of observed disks. The disc masses correspond to the total masses of grains smaller than 1 mm. Although for blackbody grains, for realistic grains, we apply calculated from Mie theory using the complex refractive index of dirty ice111 The composition of dirty ice is ice, organics, and silicates, whose volume ratio is set to be 2:1:1 according to the local interstellar cloud (Kimura, Mann, & Jessberger, 2003). The complex refractive index of dirty ice is calculated using those of ice (Warren, 1984), organic refractory material (Li & Greenberg, 1997), and astronomical silicate (Draine & Lee, 1984) through the Maxwell-Garnett mixing rule. (Bohren & Huffman, 1983). For bodies smaller than the peak wavelength of the thermal emission spectrum, grain temperatures calculated for dirty-ice grains are higher than those for blackbody grains. The disc radii obtained for dirty-ice grains are thus 2–5 times larger than those for blackbody grains. Disc masses estimated using dirty-ice grains are larger by an order of magnitude.
The dependence on stellar ages may indicate the evolution of discs. Disc radii decrease after several billion years and disc masses peak around 100 million years. However, it should be noted that we obtain disc radii and masses by excluding data with flux ratios smaller than 0.06 (0.15) for () due to observational uncertainty (Bryden et al., 2006). Discs around older stars mainly have flux ratios lower than the limit for because of large disc radii. Therefore, we cannot obtain radii and masses of most old discs through this analysis.


3 Model
In debris discs, small grains are removed within a short timescale mainly by collisional fragmentation and radiation pressure. Kilometer-sized or larger parent bodies are required to maintain debris discs in timescales comparable to the ages of their host stars. Parent bodies with low random motions initially undergo collisional growth, rather than fragmentation, and then planets are formed via runaway/oligarchic growth. Once planets are substantially massive, leftover planetesimals start collisional fragmentation, resulting in debris disc formation. In this section, we describe our model of the outcomes of single collisions and the mass evolution of bodies through collisions to investigate thermal flux evolution caused by planet formation in planetesimal discs.
3.1 Mass Evolution of Bodies and Collisional Outcomes
The formation and growth of planetary embryos that induce dust production in a planetesimal disc are investigated via statistical simulation developed in Kobayashi et al. (2010). The mass evolution of bodies is caused by mutual collisions dependent on the random velocities of bodies, which are affected by the mass distribution of bodies. The mass and velocity evolution is therefore coupled. Although we do not follow the orbits of bodies, our simulation that calculates the mass and velocity evolution can reproduce the embryo formation results of -body simulation (Kobayashi et al., 2010).
The random velocities of planetesimals, determined by orbital eccentricities and inclinations, increase due to stirring by planetary embryos, which induce collisional fragmentation. Collisions between already fragmented bodies made them even smaller. Once fragments are smaller than in radius, they are no longer bound to the host star due to the contribution of radiation pressure and are mainly blown out before being destroyed in mutual collisions (e.g., Burns, Lamy, & Soter, 1979). Therefore, such a collisional cascade reduces the total mass of planetesimals. Although the mass reduction in some previous studies had been investigated under the assumption that catastrophic collisions are dominant, Kobayashi & Tanaka (2010) found that weak erosive collisions are more important for the mass reduction of planetesimals by collisional cascades. They obtained an analytical solution for the mass reduction including erosive collisions, and this is reproduced by our simulations. Therefore, we can accurately follow both planet formation and debris production.
Dust production is mainly determined by the total ejecta mass, , from a single collision between bodies with masses and , given by
| (3) |
Here is the scaled impact energy, where is the specific impact energy required for the ejection of half of the mass of the colliders and is the impact velocity. Collisional simulations of dust aggregates (very small particles) suggest that is independent of aggregate size and of order (Wada et al., 2013). For large bodies, is purely determined by gravity and is thus proportional to the square of the surface escape velocity. For intermediate-sized bodies (1 cm–100 km in radius), hydrodynamic simulations show that increases with radius, , for –1 km, while decreases with for km. Therefore, we model
| (4) | |||||
where is material density and , , , , and are constants. We apply , , , and based on Benz & Asphaug (1999), and based on Stewart & Leinhardt (2009).
We investigate the collisional evolution of bodies in a disc after gas depletion. Since the eccentricities of planetesimals increase to as much as unity, we take into account the reduction of the surface density of planetesimals due to scattering from planetary systems. According to the results of -body simulations by Ida & Makino (1992), the eccentricities of bodies in each mass bin have a Rayleigh distribution. The fraction of bodies with eccentricities larger than unity is negligible for a small mean value of the distribution, while the fraction is significant for a mean value close to unity. If the mean eccentricity becomes larger than 0.25, we remove the fraction of bodies with eccentricities larger than unity and set a new mean eccentricity determined by the leftover bodies.
3.2 Optical Depth and Thermal Emission
In our simulations, we follow the evolution of the optical depth , where
| (5) |
Substituting into Eq. (1), the disc flux is re-written as
| (6) |
where
| (7) | |||||
For blackbody dust, for corresponding to the temperature at . Even for realistic dust, if the size distribution of is known, can be obtained. We use obtained from the temperature of dirty ice dust and the assumption that . Although our simulations yield size distributions, we use the simple to save computational cost in fitting over a wide parameter range in §4.2. Since there is no significant difference between the simple and realistic , our treatment does not affect the results. Note that we directly obtain from simulations because the error of estimated from large bodies under the power-law assumption is much greater than that of the simple .
Active radial transport of bodies occurs via interaction with gas in protoplanetary discs or by the Poynting-Robertson effect in gas-free discs. Hence, simulations with multiple annuli are required. However, the radial drift of bodies is negligible in most observed discs because the collisional timescale is shorter than the radial drift timescale due to the Poynting-Robertson effect for (Wyatt, 2005). We thus ignore radial transport in our simulations.
4 Result
4.1 Evolution of Optical Depth
We simulate the formation of planets and a debris disc at in a disc with , equivalent to the solid surface density in the minimum-mass solar nebula model (Hayashi, 1981). Since the size distribution of bodies is narrow prior to runaway growth of planetesimals, we set a single size population of planetesimals with radius km at the beginning of the simulation. In the simulation, the radius of the smallest bodies is set to be 1 , below which dust grains are blown out on a Keplerian timescale.
The cumulative surface density and optical depth of bodies larger than a given radius with eccentricities and inclinations are shown in Fig. 3. Planetary embryos of radii km form in years but then the surface density is mainly determined by bodies of km: Runaway growth produces massive embryos but most remaining bodies retain the initial size almost without growth. The stirring of massive embryos increases and of leftover planetesimals and induces their collisional fragmentation. The collisional cascade of bodies smaller than 10 km reduces the surface density and optical depth of the disc within a timescale of several years.
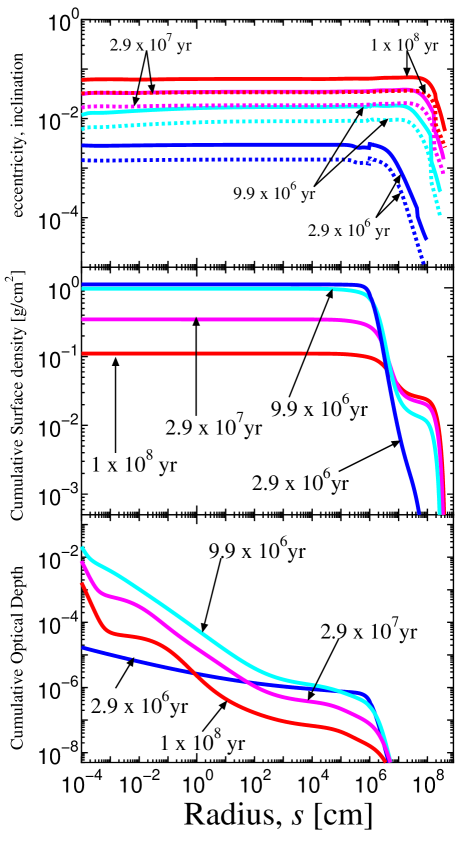
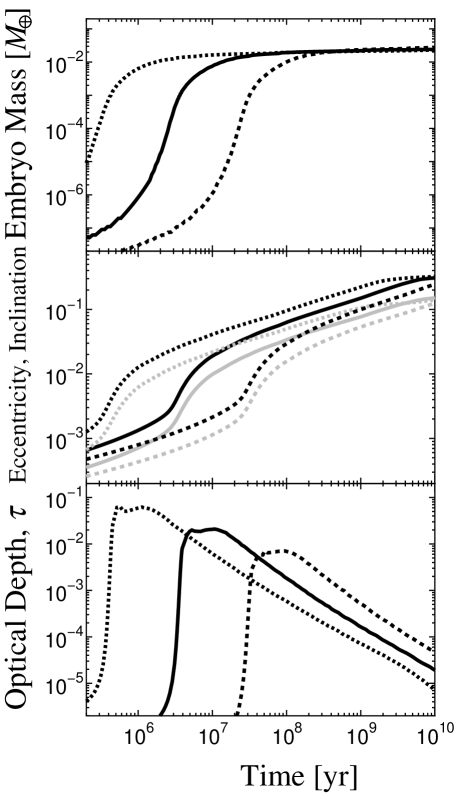
Figure 4 shows the evolution of planetary embryo mass222We define planetary embryo mass as the average mass of “runaway bodies” that can have orbital separations of 10 Hill radii (see Kobayashi et al., 2010). and optical depth at 5, 10, and 20 AU. Planetary embryos initially grow exponentially (runaway growth) but subsequently they grow slowly due to the high and of stirred planetesimals (oligarchic growth). Once embryo masses reach , the optical depth rapidly increases due to collisional fragmentation of planetesimals induced by embryo formation. Finally, their growth is stalled due to the reduction of the surface density of planetesimals caused by collisional cascade, which gradually reduces the optical depth.
Debris disc formation induced by planet formation was also investigated in previous studies (Kenyon & Bromley, 2004, 2008; Weidenschilling, 2010). Due to high computational costs, the radii of the smallest bodies in their simulations were set to be much larger than the blow-out size. The authors mainly determined the evolution of the resultant smaller bodies based on the theory of collisional cascades (power law distribution). However, the distribution does not follow the power law distribution before the onset of active collisional fragmentation due to planet formation and even for collisional equilibrium the distribution has wavy structures around the blow-out size (Löhne, Krivov, & Rodmann, 2008). To calculate optical depth accurately, bodies larger than the blow-out size should be followed in a simulation. Therefore, we treat all bodies larger than the blow-out size (1 in radius).
The rapid increase in is caused by embryo formation via runaway growth. We empirically know that the growth timescale is inversely proportional to in runaway growth (e.g., Ormel, Dullemond, & Spaans, 2010), where is the Keplerian frequency. On the other hand, gradually decreases on a collisional timescale, that is inversely proportional to (Kobayashi & Tanaka, 2010). The optical depth is expected to be proportional to . Therefore, we scale the temporal evolution of . As shown in Fig. 5, the scaled temporal evolution is in good agreement with the actual simulation. Owing to this scaling, numerous simulations with different annular radii and surface densities are not necessary to treat a broad disc: We can calculate evolutionary fluxes for each choice of disc parameter based on the time evolution of given by a single simulation.

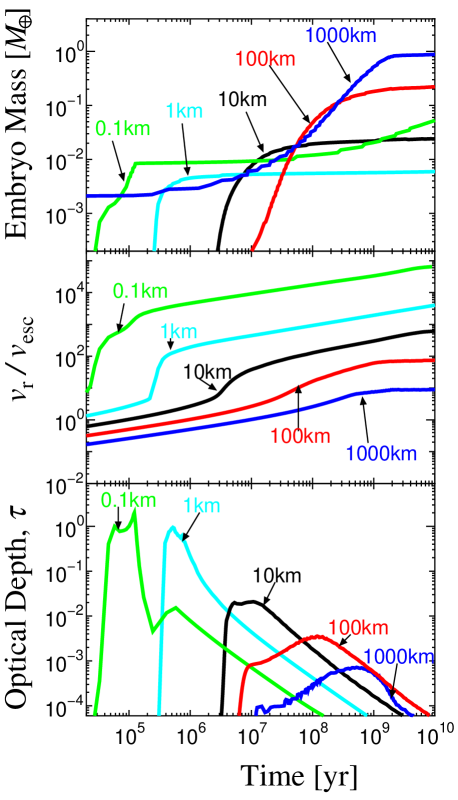
It should be noted that the temporal evolution of depends on the initial planetesimal radius , as shown in Fig. 6. For smaller , runaway growth occurs earlier and thus increases earlier. Once active dust production occurs, more frequent collisions of more fragile planetesimals (lower ) for smaller lead to higher dust production: Smaller results in higher , whereas decays earlier for smaller . For km, increases along with runaway growth of planetesimals, while increases prior to runaway growth for larger planetesimals. When the runaway growth starts, planetesimals have random velocities as large as the surface escape velocity, , of the planetesimals, where is the Keplerian velocity. Since their specific impact energies at the beginning of runaway growth are much smaller than of planetesimals with km, is very low before runaway growth and suddenly increases at the onset of runaway growth. For km, the specific impact energy is slightly smaller than or comparable to of initial planetesimals at the beginning of runaway growth. Due to collisional erosion of planetesimals, collisional cascades increase prior to runaway growth, resulting in the small peak value of . Therefore, the dependence of evolution on is complicated, because fragmentation efficiency of planetesimals determined by depends on . Although we cannot derive a formula for dependence, the scaling for and is valid for each value of .
4.2 Evolution of Disc Flux
We obtain the disc flux by the integration of over using Eq. (6). For the integral, we introduce a power-law surface density model of
| (8) |
where is the reference surface density at 10 AU, corresponding to that at 10 AU in the minimum mass solar nebula model (Hayashi, 1981), and is a scaling parameter.
Figure 7 shows the temporal evolution of flux from a wide disc from 5 to 100 AU and from a narrow disc from 10 to 50 AU with and , initially composed of 10 km-radius planetesimals ( km). The fluxes increase at around years for the wide disc, but 10 times later for the narrow disc. This is caused by planet formation around the inner edges of the discs. The vertical optical depth around the inner edges gradually decreases after planet formation occurs (see Fig. 4), while planet formation propagates to the outer disc. This growth propagation maintains high fluxes until the growth front reaches the outer, cold disc or the outer edge of the disc. For the flux, thermal emission from the disc beyond several 10 AU has a smaller contribution. Since the growth front reaches the cold region, the flux decreases after 100 million years. On the other hand, thermal emission from cold disc has a larger contribution. The flux decreases when planetary formation has finished at the outer edge of disc.

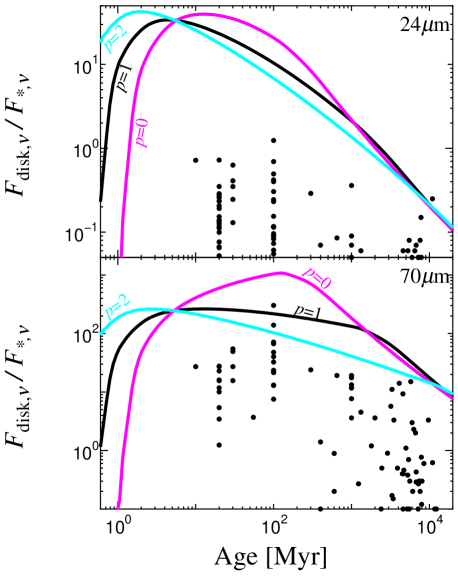
Fig. 8 shows the flux ratio evolution for different radial distributions of surface density. Since the surface densities at the inner edge are different, the flux ratios rise later for large . After the rapid rise of flux ratios, growth propagation in the disc determines the flux ratio evolution. For , the flux ratios decrease for , while the ratio increases for .
Since the flux ratios from discs with are much larger than those obtained from observations, we further investigate the temporal evolution of flux ratios for less massive discs (Fig. 9). The maximum flux ratios decrease with decreasing , while flux ratios rise later for smaller because of a longer planet growth timescale. In order to explain lower observational flux ratios at 10–100 million years, small and are necessary: The flux evolution for and AU seems more reasonable. However, the model fluxes are relatively high at and too low at , compared to observational data: The model disc radius is smaller than those estimated from the observational data. Indeed, while the disc radii estimated from observational data are much larger than 5 AU at 10–100 million years (see Fig. 2), the model flux with comes from the disc inside 5 AU before 1 billion years.

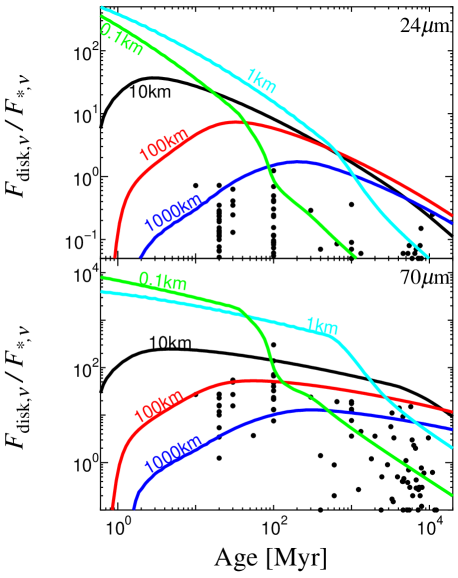
The temporal flux evolution depends on the initial size of planetesimals (Fig. 10). For small planetesimals, planetary formation starts at the inner edge early and, of course, the growth front reaches the outer edge early. For and km, the fluxes are very high before 10 million years and then start decreasing at – years: These model fluxes are much larger than observational ones before years. On the other hand, the fluxes increase later for larger planetesimals and the fluxes remain high even after years: The model fluxes significantly exceeds observational ones after years. Therefore, the smooth discs seem unlikely to explain the observational data even for a wide range of initial planetesimal sizes (0.1–1000 km).
4.3 A Typical Disc
For each initial planetesimal radius, the most likely parameters to explain the observational data are found using a Monte-Carlo method for –100, disc edge radii and ranging from 5 AU to 400 AU, and –2. From tests, we obtain the best-fit parameters for the averaged data of the flux ratios at 24 and 70 and their ratios in age bins333The mean values are , , and , which are obtained from the average of logarithmic values for age bins, –7.5, 7.5–8.5, 8.5–9.5, and 9.5–10.5. For averaging, we use all data if the flux ratios exceed 0.15 at , and we adopt 0.03 for the flux ratios at if they are smaller than 0.06.. Note that our best fit disc is no attempt to cover the observed variety of disc radii and masses with a single set of disc parameters. Instead it is meant to represent a typical or average disc.
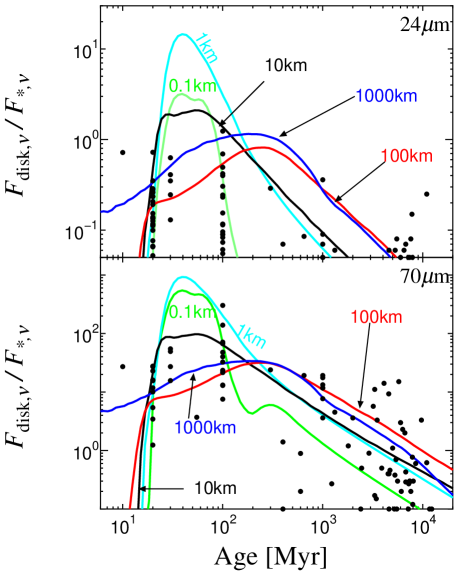
The likely parameter sets for several values of the initial planetesimal radius are listed in Table 1. Fig. 11 shows the flux-ratio evolution for these likely parameters. Narrow discs are most likely to reproduce the observed fluxes. Due to the narrowness, the values are similar for broad ranges of and as long as the total planetesimal mass is the same: The best fits are achieved for the relation . The errors for and are not described in Table 1 because of correlation. They can be evaluated using the above relation. The smallest values are obtained for , which is achieved in a very narrow parameter space. This is caused by the absence of fitted data at around 30–90 million years. If we exclude this parameter space, cases with best represent observations. For km the values near minimum are achieved for the wide range of (see Table 1). Therefore, the most likely initial planetesimal size seems to be of order 100 km.
| [km] | [AU] | [AU] | [] | ||
|---|---|---|---|---|---|
| 0.1 | 0.23 | 1.1 | |||
| 1 | 0.40 | 0.56 | |||
| 10 | 1.34 | 0.04 | |||
| 100 | 2.6 | 0.0 | |||
| 1000 |
5 Discussion
Planetary embryos formed via runaway growth in a planetesimal disc induce collisional fragmentation of planetesimals that can supply dust grains to a debris disc. Planet formation propagates from the inner to outer disc, and the dust supply region moves in turn with planet formation. Since collisional fragmentation reduces the surface density of planetesimals, the dust production rate gradually decreases after planet formation occurs. As a result, planet formation forms narrow debris discs from inside out if initial planetesimal discs have a smooth radial distribution or have no radial cutoff. However, we find that planetesimal discs are likely narrow to account for most observational fluxes of debris discs around G-type stars. Planet formation in narrow planetesimal belts can also better explain debris discs around A-type stars (Kennedy & Wyatt, 2010). For G stars, the plausible disc radii are estimated in this paper to be 25–35 AU for an initial planetesimal radius of km, whereas they are 40–80 AU for smaller initial planetesimals. Their radii are comparable to those obtained from the simple estimate shown in § 2, whereas the total mass of bodies is not well determined from the simple estimate because of the uncertainty of the size distribution of large bodies (see Fig. 2 and Table 1). In addition, from more detailed analyses we find that 100 km sized planetesimals are most likely to explain the observational fluxes.
The fluxes of debris discs are mainly determined by thermal emission of dust grains of size 1–100 µm. However, in previous studies, the debris disc fluxes caused by planet formation are calculated by extrapolation from the results of simulations that only treat bodies larger than m (Kenyon & Bromley, 2004, 2008). Therefore, their model fluxes are underestimated by a factor 3–10, compared to simulations handling down to -sized dust grains. On the other hand, previous simulations included a gaseous component with a lifetime of years, while we ignore the effects of gas even in early times. Even starting with similar initial planetesimals, the time when disc fluxes increase is earlier for our simulation. This means that gas drag plays an important role in flux evolution before 100 million years. Indeed, since collisional cascades cannot effectively produce -sized bodies in a gaseous disc (Kobayashi et al., 2010), disc fluxes may not rise before gas depletion occurs.
If gas depletion is taken into account, the inner edge of a disc may also be naturally explained. If discs still have as much gas as the minimum-mass solar nebula, collisional fragmentation between bodies smaller than about 10 m does not occur because of damping due to gas drag. Hence, collisional cascade induced by planet formation do not significantly produce bodies smaller than 10 m and the bodies at the low-mass end of the collisional cascade are depleted by radial drift due to gas drag (Kobayashi et al., 2010; Kobayashi, Tanaka, & Krivov, 2011; Kobayashi, Ormel, & Ida, 2012). After gas depletion, collisional cascades can produce smaller bodies and then debris disc fluxes increase. If planet formation occurs inside a radius prior to gas depletion, planets are subsequently formed beyond in a gas-free disc. If corresponds to the inner edge radius of a planetesimal disc that we assume in this paper, the flux evolution is expected to be similar: The inner edges of planetesimal discs may be related to the gas depletion of protoplanetary discs. On the other hand, gas giant planets formed inside dynamically clean up around their orbits, which may also contribute to the formation of the inner edges of planetesimal discs.
Planetesimal formation beyond several 10 AU is difficult because radial drift is more rapid than the collisional growth of dust in protoplanetary discs; possible formation region of planetesimals via collisional growth is inside several 10 AU (Okuzumi et al., 2012). On the other hand, if stars are born in a cluster, stars experience close stellar encounters during their escape from the cluster. Such an early stellar encounter truncates the disc; a stellar passage at AU as expected in the relatively dense clusters produces an outer edge of planet forming region at 30 AU (Kobayashi & Ida, 2001) and explains some dynamical properties of Kuiper belt objects (Kobayashi, Ida, & Tanaka, 2005). Therefore, planetesimal formation and/or an early stellar encounter may explain the outer edges of planetesimal discs.
In the solar system, Jupiter and Saturn were formed before the gas lifetime of the solar nebula, while Uranus and Neptune were formed after significant gas depletion. Planet formation in gas-free discs might have occurred beyond 10–20 AU. An early stellar encounter as an explanation of the orbital distribution of Kuiper belt objects may yield the outer edge of the planetesimal disc at around 50 AU (Kobayashi, Ida, & Tanaka, 2005). Therefore, narrow planetesimal discs composed of large planetesimals ( km) that are very likely to form debris discs might be similar to that of the solar system. Taking into account gas depletion, the similarity to the solar system should be address in future studies.
We thank A. Mustill for helpful comments that helped to improve our manuscript. HK gratefully acknowledges support from Grants-in-Aid from MEXT (23103005). TL acknowledges support from the Deutsche Forschungsgemeinschaft, grant Lo 1715/1-1.
References
- Beichman et al. (2005) Beichman C. A., et al., 2005, ApJ, 622, 1160
- Beichman et al. (2006) Beichman C. A., et al., 2006, ApJ, 652, 1674
- Benz & Asphaug (1999) Benz W., Asphaug E., 1999, Icar, 142, 5
- Bohren & Huffman (1983) Bohren C. F., Huffman D. R., 1983, Absorption and Scattering of Light by Small Particles, Wiley, New York
- Bryden et al. (2006) Bryden G., et al., 2006, ApJ, 636, 1098
- Burns, Lamy, & Soter (1979) Burns J. A., Lamy P. L., Soter S., 1979, Icar, 40, 1
- Chen et al. (2005a) Chen C. H., et al., 2005, ApJ, 634, 1372
- Chen et al. (2005b) Chen C. H., Jura M., Gordon K. D., Blaylock M., 2005, ApJ, 623, 493
- Cuzzi, Hogan, & Shariff (2008) Cuzzi J. N., Hogan R. C., Shariff K., 2008, ApJ, 687, 1432
- Draine & Lee (1984) Draine B. T., Lee H. M., 1984, ApJ, 285, 89
- Hayashi (1981) Hayashi C., 1981, PThPS, 70, 35
- Hillenbrand et al. (2008) Hillenbrand L. A., et al., 2008, ApJ, 677, 630
- Ida & Makino (1992) Ida S., Makino J., 1992, Icar, 96, 107
- Hines et al. (2006) Hines D. C., et al., 2006, ApJ, 638, 1070
- Kennedy & Wyatt (2010) Kennedy G. M., Wyatt M. C., 2010, MNRAS, 405, 1253
- Kenyon & Bromley (2004) Kenyon S. J., Bromley B. C., 2004, AJ, 127, 513
- Kenyon & Bromley (2008) Kenyon S. J., Bromley B. C., 2008, ApJS, 179, 451
- Kim et al. (2005) Kim J. S., et al., 2005, ApJ, 632, 659
- Kimura, Mann, & Jessberger (2003) Kimura H., Mann I., Jessberger E. K., 2003, ApJ, 583, 314
- Kobayashi & Ida (2001) Kobayashi H., Ida S., 2001, Icar, 153, 416
- Kobayashi, Ida, & Tanaka (2005) Kobayashi H., Ida S., Tanaka H., 2005, Icar, 177, 246
- Kobayashi, Ormel, & Ida (2012) Kobayashi H., Ormel C. W., Ida S., 2012, ApJ, 756, 70
- Kobayashi & Tanaka (2010) Kobayashi H., Tanaka H., 2010, Icar, 206, 735
- Kobayashi, Tanaka, & Krivov (2011) Kobayashi H., Tanaka H., Krivov A. V., 2011, ApJ, 738, 35
- Kobayashi et al. (2010) Kobayashi H., Tanaka H., Krivov A. V., Inaba S., 2010, Icar, 209, 836
- Kobayashi et al. (2008) Kobayashi H., Watanabe S.-I., Kimura H., Yamamoto T., 2008, Icar, 195, 871
- Kobayashi et al. (2009) Kobayashi H., Watanabe S.-I., Kimura H., Yamamoto T., 2009, Icar, 201, 395
- Li & Greenberg (1997) Li A., Greenberg J. M., 1997, A&A, 323, 566
- Löhne, Krivov, & Rodmann (2008) Löhne T., Krivov A. V., Rodmann J., 2008, ApJ, 673, 1123
- Meyer et al. (2004) Meyer M. R., et al., 2004, ApJS, 154, 422
- Moro-Martín et al. (2007) Moro-Martín A., et al., 2007, ApJ, 658, 1312
- Mustill & Wyatt (2009) Mustill A. J., Wyatt M. C., 2009, MNRAS, 399, 1403
- Okuzumi et al. (2012) Okuzumi S., Tanaka H., Kobayashi H., Wada K., 2012, ApJ, 752, 106
- Ormel, Dullemond, & Spaans (2010) Ormel C. W., Dullemond C. P., Spaans M., 2010, Icar, 210, 507
- Stewart & Leinhardt (2009) Stewart S. T., Leinhardt Z. M., 2009, ApJ, 691, L133
- Wada et al. (2013) Wada K., Tanaka H., Okuzumi S., Kobayashi H., Suyama T., Kimura H., Yamamoto T., 2013, A&A, 559, A62
- Warren (1984) Warren S. G., 1984, ApOpt, 23, 1206
- Weidenschilling (2010) Weidenschilling S. J., 2010, ApJ, 722, 1716
- Wyatt (2005) Wyatt M. C., 2005, A&A, 433, 1007