Sejong Open Cluster Survey (SOS).
III. The Young Open Cluster NGC 1893 in the H II Region W8
Abstract
We present a and H photometric study of the young open cluster NGC 1893 in the H II region W8 (IC 410 or Sh 2-236). A total of 65 early-type members are selected from photometric diagrams. A mean reddening of the stars is mag. The published photometric data in the near- and mid-infrared passbands are used to test the reddening law toward the cluster, and we confirm that the reddening law is normal (). Zero-age main sequence fitting gives a distance modulus of mag, equivalent to kpc. From H photometry 125 H emission stars and candidates are identified as pre-main sequence (PMS). The lists of young stellar objects and X-ray sources published by previous studies allow us to select a large number of PMS members down to . Isochrone fitting in the Hertzsprung-Russell diagram gives a turn-off age of 1.5 Myr and the median age of 1.9 Myr from the PMS members with a spread of 5 Myr. We derive the initial mass function (IMF) for stars with mass larger than . The slope of the IMF () is well consistent with the Salpeter/Kroupa IMF. A total mass of the cluster appears to be in excess of 1,300 . Finally, we estimate the mass accretion rate of 82 PMS members in the mass range of to .
keywords:
accretion, accretion discs – circumstellar matter – stars: luminosity function, mass function – open clusters and associations: individual (NGC 1893)1 Introduction
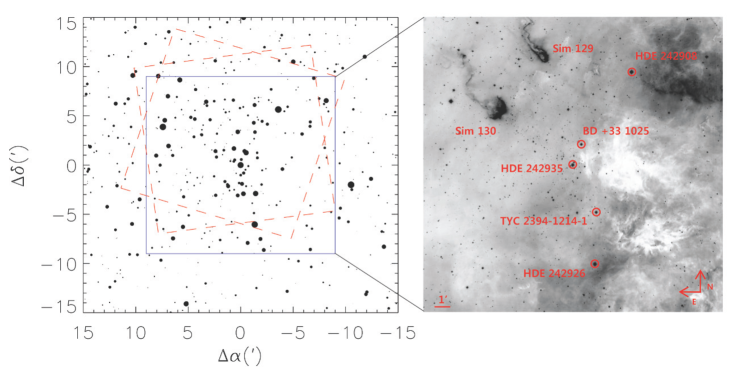
NGC 1893 is the young open cluster in the H II region W8 (IC 410 or Sh 2-236) which is a part of the Auriga OB2 association. The cluster incubates 5 O-type stars, HDE 242935 [O6.5V((f))z], BD +33 1025 [O7V(n)z], HDE 242908 [O4.5V(n)((fc))], HDE 242926 [O7Vz], and TYC 2394-1214-1 (Hoag & Applequist, 1965; Sota et al., 2011), as well as two prominent emission nebulae, Sim 129 and 130. These O-type stars are thought to be the main ionizing sources within the region. The morphology of the emission nebulae indicates that star formation is currently taking place. From an analysis of two stars in the cluster, Daflon & Cunha (2004) found dex lower abundance of light elements than that found in solar neighbourhood clusters. If this is correct, it implies that the stars in NGC 1893 are forming in a low-metallicity environment. It is considered that star-forming activities in the outer Galaxy may be less vigorous as a result of several contributing factors - a low-metallicity environment, weak interactions with spiral arms, and a lack of supernova explosions. Thus, NGC 1893 could be a very interesting laboratory for studying star formation processes and the initial mass function (IMF) in a different environment from the solar neighbourhood (Caramazza et al. 2008 and references therein).
Many photometric survey studies (Johnson et al., 1961; Becker, 1963; Hoag & Applequist, 1965; Moffat, 1972; Massey et al., 1995; Loktin et al., 2001) involving NGC 1893 have been conducted in the optical passbands. These studies presented useful photometric data and fundamental parameters, such as reddening, distance, and age of the cluster. However, the photometric data are not deep enough to study more details for pre-main sequence stars (PMS). Since Vallenari et al. (1999) and Marco et al. (2001) predicted the presence of a large number of PMS stars in the cluster, many researchers became interested in the PMS population. Several spectroscopic observations have confirmed that the majority of PMS stars with emission lines are found in the cluster core as well as in the vicinity of Sim 129 and 130 (Marco & Negueruela, 2002; Maheswar et al., 2007; Sharma et al., 2007; Negueruela et al., 2007). In addition, many PMS stars, which exhibit near-infrared (NIR) excess from their circumstellar discs, were identified using the Two Micron All Sky Survey (2MASS; Skrutskie et al. 2006) data. From the age distribution of the PMS stars inferred from the () colour-magnitude diagram (CMD) Maheswar et al. (2007) and Sharma et al. (2007) argued that star formation has progressively taken place from the cluster centre toward the two emission nebulae. Negueruela et al. (2007) also described how the observed properties, such as the morphology of the nebulae and presence of young emission-line PMS stars away from the cluster, are very similar to the typical characteristics of triggered star formation delineated by Walborn (2002). However, the membership seemed to be limited to a small number of PMS stars with either H emission or NIR excess emission.
More detailed studies of the PMS population were made possible by several extensive observational programs. Caramazza et al. (2008) presented a study of a large PMS population based on Spitzer mid-infrared (MIR) and Chandra X-ray data. They identified a number of PMS stars (7 Class 0/I, 242 Class II, and 110 Class III candidates) and estimated the fraction of PMS stars with a circumstellar disc (67 per cent). Later, Prisinzano et al. (2011) made deep optical and NIR observations for NGC 1893. By defining a Q index from various colours, a total of 1034 Class II objects were newly identified. The authors found 442 PMS stars without a circumstellar disc from their X-ray catalogue, thereby estimating a disc fraction of 71 per cent, which is higher than that obtained by Caramazza et al. (2008). Caramazza et al. (2012) investigated the coronal properties of the PMS stars based on their X-ray luminosities derived from spectral fitting and quantile analysis. They found that the X-ray luminosity of Class III objects appears to be higher than that of Class II objects at the same bolometric luminosity, and suggest it may reflect the disc locking in Class II objects. On the other hand, Class II objects exhibit higher variability and more frequent flares than those of Class III objects. Comparing the X-ray properties of stars in NGC 1893 with those of stars in Orion nebula cluster (ONC) the authors concluded that the coronal properties of stars formed in the outer Galaxy may be the same as those of stars in nearby star-forming regions.
Lata et al. (2012) identified 53 variable PMS stars through time series observations in the and bands. They found that the rotational period of PMS stars decreases with stellar age and mass, and that the amplitude in the light curves also declines with the same physical quantities. The former is compatible with the disc locking models. Pandey et al. (2013) compared the age of classical T-Tauri stars (CTTSs) with that of weak-line T-Tauri stars (WTTSs) based on a cumulative age distribution. Their result indicates that CTTSs and WTTSs are coeval and have similar properties.
The previously determined distance to NGC 1893 showed a broad range from 3.2 kpc to 6.0 kpc: 3.2 – 3.3 kpc (Humphreys, 1978; Sharma et al., 2007); 3.6 kpc (Becker, 1963; Cuffey, 1973b; Loktin et al., 2001; Prisinzano et al., 2011); 4.0 kpc (Johnson et al., 1961; Hoag & Applequist, 1965; Walker & Hodge, 1968; Moffat, 1972); 4.4 kpc (Tapia et al., 1991; Massey et al., 1995); 4.8 kpc (Fitzsimmons, 1993); 6.0 kpc (Marco et al., 2001). All the previous studies relied on photometric methods, such as zero-age main sequence (ZAMS) fitting, spectroscopic parallax, isochrone fitting, and an H – relation. Although the normal reddening law ( – 3.1) was adopted in these studies, the discrepancy in distances derived from different authors is not negligible. Since distance is the most important fundamental parameter in converting observational parameters to reliable absolute physical quantities, it is necessary to revisit its determination.
| ID | reference | Spectral type | reference | |||
|---|---|---|---|---|---|---|
| BD +33 1025 | 10.31 | 0.26 | -0.73 | Hoag et al. (1961) | O7V(n)z | Sota et al. (2011) |
| BD +33 1028 | 9.15 | 1.21 | 0.95 | Hoag et al. (1961) | ||
| HDE 242855 | 10.65 | 0.06 | -0.35 | Cuffey (1973a) | ||
| HDE 242908 | 9.05 | 0.27 | -0.72 | Johnson & Morgan (1955) | O4.5V(n)((fc)) | Sota et al. (2011) |
| HDE 242926 | 9.35 | 0.32 | -0.66 | Johnson & Morgan (1955) | O7Vz | Sota et al. (2011) |
| HDE 242935 | 9.43 | 0.20 | -0.73 | Hiltner (1956) | O6.5V((f))z | Sota et al. (2011) |
| HDE 243018 | 10.94 | 0.21 | -0.77 | Hoag et al. (1961) | B0V | Negueruela et al. (2007) |
| TYC 2394-162-1 | 10.79 | 0.25 | 0.14 | Hoag et al. (1961) | ||
| TYC 2394-450-1 | 11.47 | 0.17 | -0.66 | Massey et al. (1995) | B1III | Massey et al. (1995) |
| TYC 2394-503-1 | 11.08 | 0.58 | 0.03 | Cuffey (1973a) | ||
| TYC 2394-539-1 | 11.61 | 0.22 | 0.12 | Hoag et al. (1961) | ||
| TYC 2394-629-1 | 12.00 | 0.16 | -0.62 | Massey et al. (1995) | B1.5V | Massey et al. (1995) |
| TYC 2394-1141-1 | 11.04 | 0.44 | -0.46 | Hoag et al. (1961) | B0.5V | Negueruela et al. (2007) |
| TYC 2394-1214-1 | 10.15 | 0.51 | -0.49 | Hoag et al. (1961) | O8 | Hoag & Applequist (1965) |
| TYC 2394-1469-1 | 11.07 | 1.28 | 1.17 | Cuffey (1973a) | ||
| TYC 2394-1500-1 | 10.70 | 0.30 | -0.62 | Hoag et al. (1961) | B0.2V | Massey et al. (1995) |
| TYC 2394-1502-1 | 11.68 | 0.19 | -0.55 | Massey et al. (1995) | B1.5III | Massey et al. (1995) |
| TYC 2394-1594-1 | 11.86 | 0.37 | 0.22 | Cuffey (1973a) | ||
| TYC 2394-1623-1 | 10.86 | 0.26 | Hg et al. (2000) | |||
| TYC 2394-1691-1 | 11.34 | 0.26 | -0.64 | Massey et al. (1995) | B0.5V | Massey et al. (1995) |
| TYC 2394-1738-1 | 11.19 | 0.25 | -0.67 | Hoag et al. (1961) | B0.5V | Massey et al. (1995) |
| TYC 2394-1744-1 | 11.78 | 0.23 | -0.45 | Hoag et al. (1961) | ||
| TYC 2394-1912-1 | 11.23 | 0.28 | -0.62 | Hoag et al. (1961) | B0.5V | Massey et al. (1995) |
| TYC 2394-1933-1 | 11.21 | 0.19 | -0.63 | Massey et al. (1995) | B1V | Massey et al. (1995) |
As the evolution of protostars and planet formation are closely related to circumstellar disc evolution, the mass accretion rate provides a useful diagnostic of the evolution of the circumstellar disc. Since the emergence of the magnetospheric accretion model (Uchida & Shibata, 1985; Bertout et al., 1988; Königl, 1991) for PMS stars, several observational characteristics associated with accretion activities, such as blue/ultraviolet (UV) continuum excess emission, H emission line profile, line luminosities of Br, Pa, He I 5876, [O I] 6300, etc., have been investigated (Gullbring et al. 1998; Calvet & Gullbring 1998; Muzerolle et al. 1998; Calvet et al. 2004; Natta et al. 2004; Muzerolle et al. 2005; Fang et al. 2009; Mendigutía et al. 2011, and references therein). A correlation between the mass accretion rate () and stellar mass (), was found. The power law index is in the range of 1 to 3 (Muzerolle et al. 2005; Natta et al. 2006; Fang et al. 2013 and references therein). However, the physical basis of the observed correlation between the mass accretion rate and the mass of the central star is not clearly understood. Furthermore, the mass accretion rate of intermediate-mass stars () seems to be quite uncertain. A few studies that have focused on Herbig Ae/Be stars found that the relation between and does not differ from that of low-mass stars (Calvet et al., 2004; Garcia Lopez et al., 2006; Donehew & Brittain, 2011). On the other hand, some studies found a far steeper relation for Herbig Ae/Be stars with masses larger than (Mendigutía et al., 2011; Lim et al., 2014). The accretion properties of these intermediate-mass PMS stars are one of the interesting issues.
The Sejong Open cluster Survey (SOS) project is dedicated to provide homogeneous photometric data down to mag for many open clusters in the Galaxy. The overview of the project can be found in Sung et al. (2013b, hereafter Paper 0). Young open clusters NGC 2353 and IC 1848 were studied as a part of this project (Lim et al., 2011, 2014). This paper on NGC 1893 is the fourth in the series. The observations and comparisons with previous photometry are described in Section 2. In Section 3, we discuss the reddening law in the direction of NGC 1893 and present fundamental parameters estimated from the photometric diagrams. The IMF of NGC 1893 and the mass accretion rates of PMS stars with UV excesses are presented in Section 4 and 5, respectively. Plausible triggering mechanisms within NGC 1893 are discussed in Section 6. Finally, we summarize the results from this study in Section 7.
2 OBSERVATION
The observation of NGC 1893 was made on 2009 January 19 using the AZT-22 1.5m telescope (f/7.74) at Maidanak Astronomical Observatory in Uzbekistan. All imaging data were acquired using the Fairchild 486 CCD (SNUCam; Im et al. 2010) with the standard Bessell (Bessell, 1990)
| ID1 | 2 | Nobs | 2MASSID | H 3 | Sp4 | |||||||||||||
|---|---|---|---|---|---|---|---|---|---|---|---|---|---|---|---|---|---|---|
| 3421 | 05 22 53.62 | +33 22 52.5 | 21.383 | 18.863 | 2.520 | 1.895 | 0.040 | 0.004 | 0.040 | 0.131 | 1 2 1 1 0 0 | - | - | |||||
| 3422 | 05 22 53.63 | +33 28 40.9 | 20.690 | 18.330 | 2.357 | 1.781 | -0.113 | 0.001 | 0.007 | 0.007 | 0.049 | 0.056 | 2 2 2 1 0 1 | 05225363+3328412 | - | |||
| 3423 | 05 22 53.64 | +33 23 53.3 | 20.279 | 17.551 | 2.728 | 1.902 | 0.045 | 0.001 | 0.017 | 0.017 | 0.038 | 0.064 | 2 2 2 1 0 1 | 05225364+3323532 | - | |||
| 3424 | 05 22 53.64 | +33 24 30.5 | 21.176 | 18.699 | 2.475 | 1.848 | -0.100 | 0.032 | 0.004 | 0.032 | 0.070 | 0.113 | 1 2 1 1 0 1 | - | - | |||
| 3425 | 05 22 53.64 | +33 25 49.2 | 21.557 | 18.901 | 2.654 | 1.645 | -0.035 | 0.043 | 0.041 | 0.060 | 0.104 | 0.122 | 1 2 1 1 0 1 | - | - | |||
| 3426 | 05 22 53.66 | +33 21 32.3 | 20.573 | 19.053 | 1.510 | 1.213 | 0.005 | 0.020 | 0.021 | 0.034 | 2 2 2 1 0 0 | - | - | |||||
| 3427 | 05 22 53.66 | +33 28 16.2 | 20.770 | 19.058 | 1.698 | 1.333 | 0.115 | 0.021 | 0.017 | 0.027 | 0.051 | 0.097 | 1 2 1 1 0 1 | - | - | |||
| 3428 | 05 22 53.67 | +33 33 26.0 | 22.621 | 19.474 | 3.148 | 0.121 | 0.031 | 0.125 | 1 2 1 0 0 0 | - | - | |||||||
| 3429 | 05 22 53.69 | +33 29 08.6 | 16.100 | 15.407 | 0.689 | 0.524 | 0.342 | 0.421 | 0.004 | 0.001 | 0.004 | 0.006 | 0.006 | 0.007 | 2 2 2 2 2 2 | 05225368+3329086 | - | |
| 3430 | 05 22 53.72 | +33 23 31.5 | 12.004 | 11.737 | 0.267 | 0.160 | -0.620 | 0.224 | 0.011 | 0.016 | 0.019 | 0.010 | 0.010 | 0.020 | 1 1 1 1 1 1 | 05225371+3323314 | - | B1.5V |
| 3431 | 05 22 53.73 | +33 28 25.8 | 22.584 | 20.316 | 2.269 | 0.088 | 0.053 | 0.103 | 1 1 1 0 0 0 | - | - | |||||||
| 3432 | 05 22 53.73 | +33 33 54.5 | 21.629 | 19.897 | 1.716 | 1.242 | 0.053 | 0.046 | 0.070 | 0.070 | 1 1 1 1 0 0 | - | - | |||||
| 3433 | 05 22 53.74 | +33 25 09.9 | 22.334 | 20.861 | 1.473 | 0.065 | 0.087 | 0.109 | 1 1 1 0 0 0 | - | - | |||||||
| 3434 | 05 22 53.74 | +33 30 36.0 | 22.062 | 18.827 | 3.234 | 1.599 | 0.079 | 0.030 | 0.085 | 0.184 | 1 2 1 1 0 0 | - | - | |||||
| 3435 | 05 22 53.76 | +33 27 59.3 | 20.430 | 18.977 | 1.442 | 1.162 | 0.043 | 0.026 | 0.003 | 0.026 | 0.040 | 0.131 | 1 2 1 1 0 1 | - | - | |||
| 3436 | 05 22 53.76 | +33 31 50.7 | 14.000 | 12.989 | 1.003 | 0.726 | 0.438 | 0.331 | 0.011 | 0.015 | 0.019 | 0.016 | 0.012 | 0.022 | 1 1 1 1 1 1 | 05225376+3331506 | - | |
| 3437 | 05 22 53.79 | +33 31 27.4 | 22.441 | 20.303 | 2.138 | 0.088 | 0.073 | 0.114 | 1 1 1 0 0 0 | - | - | |||||||
| 3438 | 05 22 53.80 | +33 25 51.5 | 21.361 | 18.762 | 2.592 | 1.611 | -1.451 | 0.043 | 0.021 | 0.048 | 0.093 | 0.059 | 1 2 1 1 0 1 | - | H | |||
| 3439 | 05 22 53.80 | +33 27 56.5 | 22.687 | 20.531 | 2.157 | 0.086 | 0.064 | 0.107 | 1 1 1 0 0 0 | - | - |
| 1 The negative numbered ID represents the data from Johnson & Morgan (1955); Hiltner (1956); Hoag et al. (1961); Cuffey (1973a); Massey et al. (1995); Hg et al. (2000) |
| 2 represents the H index [ H] |
| 3 H: H emission stars; h: H emission star candidates |
| 4 Spectral type – Hoag & Applequist (1965); Massey et al. (1995); Negueruela et al. (2007); Sota et al. (2011) |
and H filters. Lim et al. (2008) have described the characteristics of the CCD in detail. The mean seeing was better than 1.0 arcsec, and sky conditions were good. The observations comprised a total of 10 frames that were taken in two sets of exposure times for each band – 5s and 120s in , 10s and 300s in , 20s and 600s in , 30s and 600s in , and 60s and 600s in H. We present the finder chart for the stars brighter than mag in Fig. 1 using the Guide Star Catalogue version 2.3 (Lasker et al., 2008). The photometry for 24 stars that were saturated in the images was taken from previous studies. The photometric data and the adopted spectral types of the stars are presented in Table LABEL:tab1.
All pre-processing to remove instrumental artifacts was performed using the IRAF 111Image Reduction and Analysis Facility is developed and distributed by the National Optical Astronomy Observatories, which is operated by the Association of Universities for Research in Astronomy under operative agreement with the National Science Foundation./CCRED packages as described in Lim et al. (2008). In order to transform instrumental magnitudes to the standard magnitude and colours, we observed many equatorial standard stars (Menzies et al., 1991) at different air masses. Since NGC 1893 was observed on the same night as the young open cluster IC 1848 (Lim et al., 2014), the same daily parameters as used in the previous work (see table 2 in the paper), such as atmospheric extinction coefficients, photometric zero points, and time variation of the photometric zero points, were adopted in this work. We carried out the point spread function photometry for the target images using IRAF/DAOPHOT, and then the instrumental magnitudes were transformed to the standard magnitude and colours using the recently modified transformation relations for the SNUCam by Lim et al. (2009) with the coefficients derived from the aperture photometry of standard stars. A detailed procedure of our photometry is delineated in Lim et al. (2014). Assuming that the luminosity function for the observed stars has a linear slope across the entire magnitude range, our photometry is 90 per cent complete down to mag, which corresponds to . It is worth noting that the completeness of our photometric data may be an upper limit because an obscuring cloud covers part of the cluster as seen in the right-hand side image of Fig. 1. The photometric data for 6,503 stars from this work are available in the electronic table (Table 2) or from the authors (BL or HS).
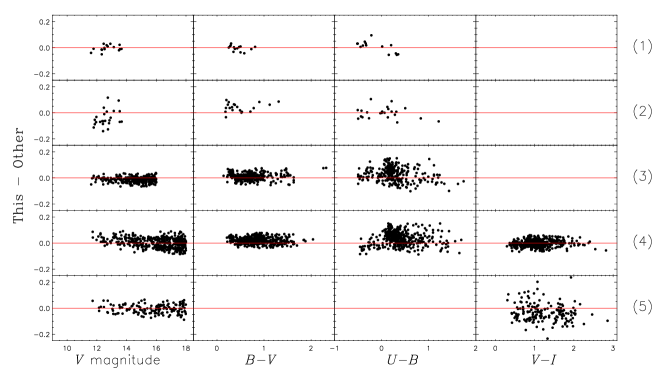
We inspected the consistency of our photometry against previous studies. The photometric data in previous studies for NGC 1893 were obtained from the open cluster data base WEBDA222http://www.univie.ac.at/webda/. The photometric data in this work were compared with those from 5 different studies (see Fig. 2). In order to avoid the large photometric errors of faint stars, bright and isolated stars were used in the comparison ( mag for Hoag et al. 1961; Cuffey 1973a, mag for Massey et al. 1995; mag for Sharma et al. 2007; Prisinzano et al. 2011). We present the mean and standard deviation of the differences between our photometry and that of previous studies in Table LABEL:tab3. Our photometric data are in good agreement with those of Hoag et al. (1961) (see also Lim et al. 2014). The differences between the photometry of Cuffey (1973a) and this work appear to be slightly larger in and , while the zero points are well consistent. Our photometry is in good agreement with that of Massey et al. (1995) and Sharma et al. (2007). The colour of Prisinzano et al. (2011) reveals a large scatter, while a small scatter can be found in the comparison of our with that of Sharma et al. (2007). Consequently, the photometric data in this work are well consistent with those of previous studies and is well tied to the Johnson-Cousins standard system.
3 PHOTOMETRIC DIAGRAMS
Open clusters provide invaluable information on the stars in clusters, such as distance and age, which are difficult to obtain from field stars. These fundamental parameters are often determined in optical photometric diagrams using well-calibrated empirical relations and stellar evolutionary models. Because open clusters are mainly distributed in the Galactic plane, membership selection is essential to study these objects. In this section, we present the membership selection criteria, the reddening law, and fundamental parameters of NGC 1893 from two-colour diagrams (TCDs) in Fig. 3 and CMDs in Fig. 4.
3.1 Membership Selection
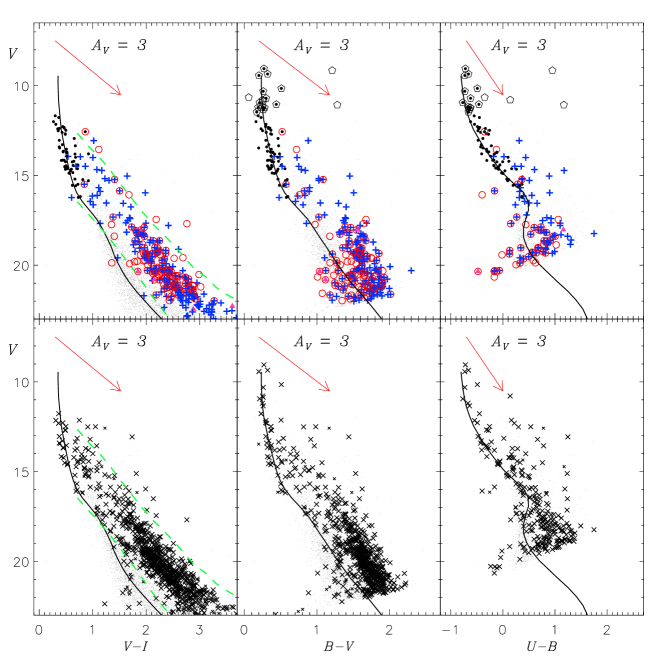
Early-type stars (O – late-B) in either star-forming regions (hereafter SFRs) or young open clusters appear very prominently in photometric diagrams, especially in , due to their high surface temperature. In addition, the individual reddening and distance moduli of the stars can be determined from the () TCD and CMDs, respectively, (see Section 3.2 and 3.3). The criteria for the early-type main sequence (MS) members are (1) mag, mag mag, mag mag (see left-hand side panel of Fig. 3 and Fig. 4), mag, and Johnson’s , (2) an individual distance modulus between and to take into account the effect of binary members (Johnson’s ) and photometric errors (Sung & Bessell, 1999; Kook et al., 2010; Lim et al., 2011, 2014), where and are the mean distance modulus and the width of the Gaussian fit to the distance modulus, respectively. Stars (ID 2576 and 4681) identified as Class II objects by Caramazza et al. (2008) were excluded in this membership selection for early-type MS stars. These stars were assigned as PMS members. A total of 65 early-type MS stars were classified as members of NGC 1893.
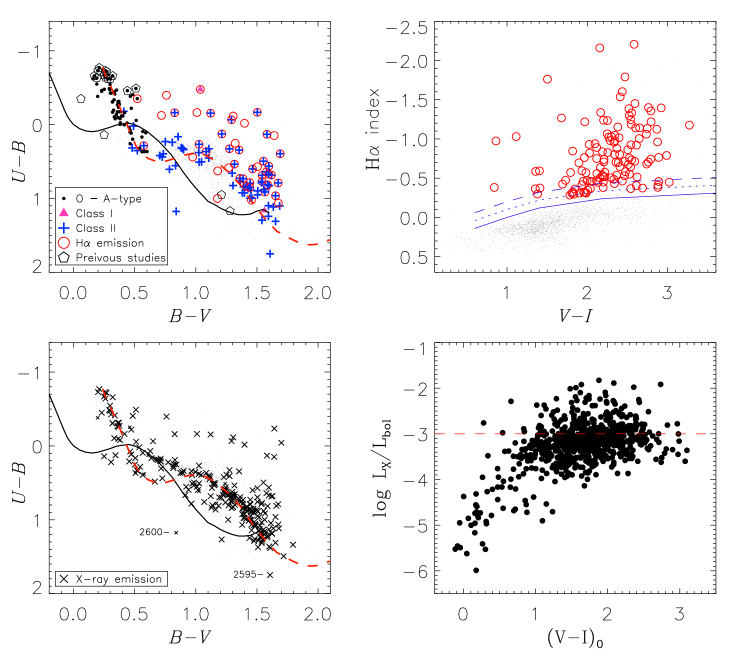
X-ray, UV, H, and infrared (IR) excess emissions are known as good membership criteria for PMS stars. H photometry has proven to be an efficient way to identify the PMS members in young open clusters ( 3 Myr). Since Sung et al. (1997) succeeded in selecting many PMS members of NGC 2264 using H photometry, this technique has been widely used to distinguish PMS members from field interlopers along the line-of-sight to several young open clusters, e. g. NGC 6231 (Sung et al., 1998, 2013a), NGC 6530 (Sung et al., 2000), NGC 2244 (Park & Sung, 2002), NGC 2264 (Park et al., 2000; Sung et al., 2004, 2008), NGC 3603 (Sung & Bessell, 2004), and IC 1848 (Lim et al., 2014). We found 105 H emission stars and 22 candidates from the upper right-hand side panel of Fig. 3. The star ID 826 (, , , and ) with H emission was excluded in the membership selection, because its observed and colours are similar to those of a foreground star. A total of 126 H emission stars and candidates were classified as members of NGC 1893, one of which is an early-type member (ID 4957).
Dust continuum emission from the circumstellar discs of PMS stars can be detected at NIR and MIR wavelengths. Prior to Caramazza et al. (2008) many studies for NGC 1893 attempted to search for PMS members using the NIR TCD (Vallenari et al., 1999; Maheswar et al., 2007; Negueruela et al., 2007; Sharma et al., 2007). However, dust emission is, in general, more prominent in the MIR than in the NIR. Caramazza et al. (2008) carried out extensive observations with the Spitzer space telescope and provided a reliable young stellar object (YSO) catalogue for Class I and Class II objects in NGC 1893. In addition, Prisinzano et al. (2011) found 1061 Class II objects based on their Q index with the photometric data from the optical to the MIR. 792 of these objects were newly identified. However, 170 PMS stars have lower luminosities than the majority of the PMS population in the () CMD (see figure 4 of their paper). They interpreted the lower luminosity stars as PMS stars with edge-on discs and accretion activity. Given their photometric errors (Fig. 2), as well as the considerable overlap between the YSOs and field star population, most of them are more likely to be field stars, because it is difficult to distinguish YSOs from similarly reddened field stars using IR colours. Hence, only YSOs (Class I and Class II in Caramazza et al. 2008) with a significant excess in the MIR are considered to be PMS members and will be used in the further analyses. In order to find the optical counterparts of the YSOs in the catalogue of Caramazza et al. (2008), we searched for stars within a matching radius of 1.0 arcsec. Out of 213 identified optical counterparts, 5 YSOs are Class I, and the others are Class II objects.
Had we only used H photometry and the YSOs from MIR observations, the majority of WTTSs would be missed (e. g. Park et al. 2000; Sung et al. 2000; Park & Sung 2002; Lim et al. 2014). Since the photometric properties of WTTSs are very similar to those of MS stars (Flaccomio et al., 1999), it is difficult to separate the members from field interlopers in TCDs or CMDs. The most efficient way to search for those PMS members without H emission or MIR excess is to find X-ray emission stars, because PMS stars are well-known X-ray emitting objects. By using X-ray source lists from the Chandra or XMM-Newton observations almost complete lists of PMS members in NGC 2264 and NGC 6231 have been made (Sana et al., 2006; Sung et al., 2008, 2013a). For NGC 1893, Caramazza et al. (2008) made very deep X-ray observations ( ks) with the Chandra X-ray Observatory and provided an X-ray source list (see table 4 in the paper). However, the X-ray source list is likely incomplete because they only presented the X-ray sources with counterparts in their MIR data. Their later follow-up study (Prisinzano et al., 2011) independently used a full version of the X-ray source list from the observation (Caramazza et al., 2008) to select PMS members, identifying 415 WTTSs. We also used the published X-ray source list (Caramazza et al., 2012) for our membership selection. The optical counterparts of X-ray emission sources and candidates were searched for with a matching radius of 1.0 arcsec. If a source with a redder colour, putatively a PMS star, was found within 1.5 arcsec, that was assigned as an X-ray emission source candidate. We found optical counterparts for 724 X-ray emission sources and 59 candidates.
CMDs in the lower panels of Fig. 4 [see also the (U-B, B-V) TCD in the lower left-hand side panel of Fig. 3] show a large number of X-ray sources (crosses). In the CMD most of them are concentrated within the PMS locus (dashed lines), which have been modified from that used in a study for the young open cluster NGC 2264 (Sung et al., 2008). The PMS locus is a quite useful boundary with which to isolate PMS members in the CMD (see Sung et al. 2008; Hur et al. 2012; Sung & Bessell 2010; Sung et al. 2013a; Lim et al. 2014) because many X-ray sources with neither H emission nor IR excess emission that lie outside the PMS locus may be non-members or non-stellar objects (see also Sung et al. 2008, 2009). We made a visual inspection of the optical images for both the X-ray sources brighter and fainter than the PMS locus. The majority of the sources brighter than the PMS locus are likely foreground F – M-type stars within 500 pc from the Sun, given the large sample of X-ray emitting objects identified from the ROSAT All-Sky Survey in Agüeros et al. (2009). Such objects, with the exception of H emission stars and/or Class II objects, were excluded from our membership selection.
Most of the X-ray sources fainter than the PMS locus may not be bona-fide PMS stars with an edge-on disc, because dust in the disc would absorb X-ray photons with keV (Draine, 2003). O and early B-type stars are well-known X-ray sources (Long & White, 1980; Lucy & White, 1980). Indeed, 32 out of the 65 early-type cluster members are X-ray emitters (see Fig. 4 and 7). Nevertheless, it is difficult to imagine that a large number of high-mass stars have been formed at high Galactic latitude, and therefore we do not anticipate OB-type background interlopers below the lower boundary of the PMS locus. It is more likely that X-ray emitting objects below the PMS locus are extragalactic sources as suggested by Caramazza et al. (2008, 2012). Extended sources as well as ambiguous objects with a low signal-to-noise ratio were assigned as non-members from visual inspection. A few objects with either H emission or MIR excess emission are included in the member list.

We also checked the position of those X-ray sources in the (, ) TCD. A few outliers with significantly different photometric properties from the cluster sequence in both the CMDs and TCD were discounted as members. There are two Class II objects (ID 2595 and 2600) with an abnormal colour for their colour. These stars fell upon a gap between two amplifiers of the Fairchild 486 CCD chip we used, where the gap is about 2 pixels ( 0.53 arcsec) in width. The stars in the and band images were little affected by the column, while their profile was significantly distorted in the band image. Thus, we replaced the photometric data of the star ID 2600 with the mean values obtained in previous studies (Massey et al., 1995; Sharma et al., 2007). In the case of the relatively faint star ID 2595, the photometric data of Sharma et al. (2007) did not include , and so we only used our magnitude and colour in this work. There is a possibility that other field interlopers, such as FGK-type stars within 2 kpc from the Sun, still overlap with the PMS members within the locus. Using the reddening-corrected X-ray luminosity (Caramazza et al., 2012) and bolometric luminosity of the PMS members obtained from the Hertzsprung-Russell diagram (HRD; see section 3.4), we investigated the of such stars with respect to as displayed in the lower right-hand side panel of Fig. 3. Stars later than mid-K clustered at the saturation level of dynamo action (), while the ratio between the X-ray and bolometric luminosities of stars with earlier spectral type rapidly declined with colour. There were no distinguishable field interloper amongst the stars selected as PMS members. However, we can not exclude the possibility of few foreground contamination with unusually high X-ray activity level which could not be discerned from the and relation. Another possible source of X-ray emission is accreting cataclysmic variables (Hertz & Grindlay, 1983). De Marchi et al. (2013) have discussed the detection chance of such variable stars. According to their simple estimation of the frequency, 0.003 X-ray emitting cataclysmic variables are expected for a total of 6503 stars. Thus, the contribution of these stars to the field contamination is negligible.
In summary, 651 X-ray emission stars and 52 candidates were assigned to PMS membership of NGC 1893. A total of 835 PMS members in NGC 1893 were selected using H photometry, the YSO catalogue (Caramazza et al., 2008), and the X-ray source list (Caramazza et al., 2012). For the PMS members, we compared the detection efficiencies of the individual membership selection criteria within the completeness limit of 1 . A total of 205 PMS members with mass larger than 1 were identified in this work. The PMS detection efficiencies from H photometry, Spitzer MIR data, and Chandra X-ray data are about 10 per cent (21/205), 24 per cent (50/205), and 85 per cent (175/205), respectively. We found that only 9 PMS members exhibit X-ray, H, and MIR excess emissions simultaneously. The X-ray data appears to be the most efficient method of detecting young active stars, while H and the MIR data show rather lower detection efficiency. These observational aspects may be related to the rapid evolution of circumstellar discs around higher mass PMS stars (). The disc fraction of such stars within NGC 1893 is about 29 per cent. Given that 67 per cent of the PMS stars in this cluster have circumstellar discs (Caramazza et al., 2008), H and MIR data may become more efficient techniques for the selection of low-mass PMS stars (Sung et al., 2000, 2009).
In addition, we considered the presence of A-type members which had already arrived at the ZAMS. These A-stars with significant X-ray emission are quite unusual, as apart from the peculiar (magnetic) A-type stars or the normal A-type star with a PMS companion (Panzera et al., 1999) most A-stars are not in X-ray catalogues. After adopting the mean reddening (see next section) for all stars, the criteria for such stars are (1) mag, mag mag, -1.0 mag mag, mag, and Johnson’s , (2) an individual distance modulus between and , (3) mag, where means a difference between distance moduli derived from and , and (4) no excess emission in the MIR and X-ray. The position of a few stars, which are compatible with those criteria, was checked in the (, ) TCD. Only 6 probable A-type candidates were selected from these criteria. A total of 906 cluster members were used in the data analysis.
3.2 Reddening and the Reddening Law
The interstellar reddening toward young open clusters is, in general, determined by comparing the observed colours of early-type stars with the intrinsic ones in the (, ) TCD along the reddening slope. Paper 0 provided reliable intrinsic colour relations (see table 1 in the paper). We used the relations to determine the individual reddening of the early-type members of NGC 1893. Since the dependence of the reddening slope on can be assumed negligible for less reddened stars [ mag], we simply adopted . For 63 isolated early-type members, a mean reddening was estimated to be (s.d.) mag and shown in the left-hand side panels of Fig. 3 as a dashed line. This value is well consistent with that of previous studies, e.g. mag (Johnson et al., 1961), 0.56 mag (Becker, 1963), 0.59 – 0.65 mag (Hoag & Applequist, 1965), 0.55 mag (Moffat, 1972), 0.53 mag (Massey et al., 1995), 0.60 mag (Loktin et al., 2001; Prisinzano et al., 2011), and 0.4 – 0.6 mag (Sharma et al., 2007).
As mentioned in several previous studies (Tapia et al., 1991; Sharma et al., 2007; Prisinzano et al., 2011), a non-negligible amount of differential reddening across the observed field was found in the (, ) TCD. Because this is very crucial for the reddening correction of PMS stars without spectral types, the spatial variation of the reddening was investigated using the position and reddening of early-type members as shown in various studies (Sharma et al., 2007; Hur et al., 2012; Sung et al., 2013a; Lim et al., 2013, 2014). However, the spatial distribution of early-type cluster members does not cover the western part of the observed region. In this paper, we introduce a new way to construct a reddening map. The basic principle is that MIR photons are less affected by the effect of the interstellar reddening than optical photons. The deep MIR photometric data of Caramazza et al. (2008) provide a good reference against our optical data in the surface density of stars. The difference between the surface densities at MIR and optical wavelengths could indicate the amount of interstellar reddening. The larger the difference, the higher the reddening is in the line of sight. Since among the 4 IRAC bands, Caramazza et al. (2008) detected the largest number of sources in the 3.6 m band, we assigned the 3.6 m data as the reference. In order to construct the differential surface density map we counted the number of stars observed in the and 3.6 m bands within a given arcmin2 area. After subtracting the surface density in the band from that in the 3.6 m band, we obtained the differential surface density map as shown in the left-hand side panel of Fig. 5, which shows the same field of view as the observed region (solid box in the left-hand side panel of Fig. 1). The figure shows that the differential surface density appears to be highest in the directions to the south and the south-west of the cluster centre. Indeed, the contour map is almost the same as the spatial distribution of the dark clouds in the right-hand side image of Fig. 1.
The differential surface density map can be converted into a reddening map by using the correlation between the surface density and the mean reddening of the early-type members within the same area, as shown in the middle panel of Fig. 5. The error of the vertical axis represents the standard deviation of the reddening, while that of the horizontal axis was assumed to follow Poisson statistics. The smallest value [ mag] among the reddening values of the isolated early-type members was considered as the intercept of the correlation. The slope was estimated using a fitting method, where the standard deviation of the reddening within a given area was used as the uncertainty of a measurement. Thus, areas containing only one early-type member were excluded in the estimation of the slope. We obtained a correlation of , and that is compatible with the global trend of the data points. In the end, the reddening map of NGC 1893 was constructed from the differential surface density map through that relation. We present the resultant reddening map in the right-hand side panel of Fig. 5. A typical uncertainty in estimated from the reddening map is about 0.1 mag if the error in the differential surface density is about 10. The reddening map was used to correct the individual reddening of the PMS members as well as the A-type MS members.
The reddening law is a useful tool to understand dust evolution in SFRs, because it is closely related to the size distribution of dust grains. For several extremely young SFRs, the ratio of total-to-selective extinction () appears to be larger than that of the normal reddening law () (see table 3 in Greve 2010). Previous photometric survey programs (Johnson et al., 1961; Hoag & Applequist, 1965; Walker & Hodge, 1968; Humphreys, 1978) have assumed the reddening law of most open clusters to follow the normal law. For NGC 1893, Tapia et al. (1991) studied the reddening law toward the cluster and found . This value is rather lower than the normal one. On the other hand, other studies (Negueruela et al., 2007; Sharma et al., 2007), which used colour excess ratios, confirmed that the reddening law of NGC 1893 is normal. A polarimetric study (Eswaraiah et al., 2011) also supported the normal reddening law toward the cluster. To check the previous results we investigated the reddening law toward NGC 1893 using various colour excess ratios as shown in the series of studies (Kook et al., 2010; Lim et al., 2011; Hur et al., 2012; Sung et al., 2013a; Lim et al., 2014).
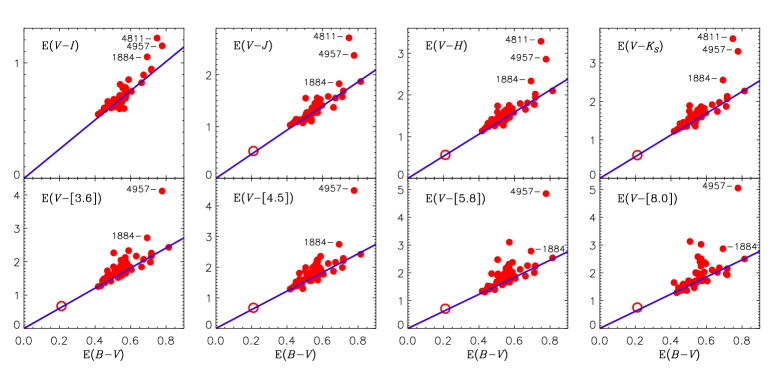
The NIR 2MASS data and MIR Spitzer IRAC data of Caramazza et al. (2008) allow us to test the reddening law toward NGC 1893 in a consistent way from the optical to the MIR. The observed colours of 63 isolated early-type members were compared with the intrinsic colours for from table 1, 2MASS from table 2 in Paper 0, and Spitzer IRAC bands (Sung et al., in preparation) in order to compute the colour excess ratios as shown in Paper 0, Sung et al. (2013a), and Lim et al. (2014). We present the colour excess ratios in Fig. 6. The solid line corresponds to the normal reddening law . Most members (bold dots) as well as a foreground early-type star (open circle) lie on the solid line, except for a few stars (ID 1884, 4811, and 4957). This result also supports the reddening law toward NGC 1893 (foreground as well as the intracluster medium of NGC 1893) being normal. The total extinction can be determined from . From the individual reddening of early-type members obtained above, the mean total extinction of the stars was mag.
Negueruela et al. (2007) found that a few late-B-type members of NGC 1893 deviated from the normal reddening law. We investigated the observed characteristics of the stars with excess emission in Fig. 6. The star ID 1884 was identified as an X-ray emission star. Although the star was not identified as a Class I or a Class II object, the star shows excess emissions in all wavelengths. Another star ID 4811 with X-ray emission is located within the head of the emission nebula Sim 130. We guess that the star was likely to be missed in the IRAC images due to the bright nebula. The other star (ID 4957) without an X-ray emission was identified as an H emission star, and it is located in the vicinity of Sim 130. All these facts indicate that the stars may be young high-mass stars. Besides these stars, there are a few stars with excess emission in the [5.8] and [8.0] bands. The excess emission may be due to the dust emission in the immediate of the star rather than to a variation of the reddening law in the intracluster medium.
3.3 Distance to NGC 1893
The location and distance of young open clusters are very useful in tracing the local spiral arm structure of the Galaxy. The distance to open clusters can be determined by using the ZAMS fitting method. The reddening correction used to be crucial in obtaining a reliable distance. Paper 0 introduced a reliable ZAMS fitting method based on reddening-independent indices as below:
| (1) |
| (2) |
| (3) |
| (4) |
| (5) |
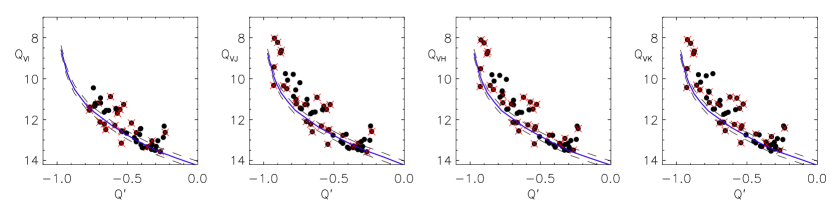
The indices are combinations of and magnitudes respectively. Since the spectra of hot MS stars (O – B-type) in the optical and NIR passbands do not exhibit strong lines apart from H, He, and a few light elements (Lancon & Rocca-Volmerange, 1992; Torres-Dodgen & Weaver, 1993; Dallier et al., 1996; Hanson et al., 1996; Pickles, 1998) we believe that each index is insensitive to any metallicity effect. We determined the distance to NGC 1893 using the ZAMS fitting method with the reddening-independent indices. According to Paper 0, the ZAMS relation should be fitted to the lower ridge line of the MS band to avoid the effects of multiplicity and evolution as presented in Fig. 7. We adjusted the ZAMS relation above and below the distribution of the early-type members in the - planes and obtained a distance modulus of , equivalent to kpc. The uncertainty in the distance modulus was from Fig. 7. This places NGC 1893 (, ) in the Perseus spiral arm.
The distance moduli obtained from the photometry are broadly consistent with each other. Our result, in particular, is in good agreement with the results of previous studies ( mag, Humphreys 1978; 12.6 mag, Sharma et al. 2007, 12.8 mag, Becker 1963; Cuffey 1973b; Loktin et al. 2001; Prisinzano et al. 2011) within the uncertainty. Previous studies determined distances through the spectroscopic parallax, isochrone fitting, and the ZAMS fitting method. The spectroscopic parallax is an apparently easy way to determine the distance and reddening. However, it is difficult to take into account the evolution effects of early-type stars on the variation of their absolute magnitude. Furthermore, the intrinsic scatter in the versus spectral-type diagram of massive evolved stars is large (see figure 3 in Humphreys & Davidson 1979). Therefore, the spectroscopic parallax can give distances slightly shifted from the true one in the process of averaging the distances of individual stars (e. g. Humphreys 1978; Massey et al. 1995). In order to fit an isochrone to observed CMDs, at least 3 free parameters, such as reddening, distance, and age (metallicity if possible), are needed. While reddening can be easily determined if multi colour photometry including is available, it is difficult to constrain the age of young clusters ( 10 Myr) unless the clusters host massive evolved stars at a specific evolutionary stage, such as yellow hypergiants, red supergiants, or Wolf-Rayet stars, as shown in several studies for the starburst cluster Westerlund 1 (Clark et al., 2005; Crowther et al., 2006; Negueruela et al., 2010; Lim et al., 2013). Despite such complexities, the results obtained from isochrone fitting in previous studies (Loktin et al., 2001; Sharma et al., 2007; Prisinzano et al., 2011) give a consistent value. A few studies (Johnson et al., 1961; Becker, 1963; Moffat, 1972) used the traditional ZAMS fitting method and obtained distance moduli of 12.8 and 13.0 mag, respectively. These results are roughly consistent with ours within the uncertainties. The difference between the ZAMS relations of Johnson (1957) and Paper 0 is about -0.09 mag at to -0.47 mag at . The slight discrepancy among the studies may result from the differences of the ZAMS relations used.
On the other hand, the distances (4.4 – 6.0 kpc) determined from Strömgren photometry (Tapia et al., 1991; Fitzsimmons, 1993; Marco et al., 2001) appear to be systematically larger than those derived from photometry. The main targets of the studies were limited to bright stars in the NGC 1893 field due to the narrow band width of the Strömgren system. The error in the colour rapidly increased at 13 – 14 mag. These large errors likely influence the result of the ZAMS fitting. In addition, while the photometric data of Tapia et al. (1991) and Fitzsimmons (1993) show a good consistency with each other, those of Marco et al. (2001) reveal a systematic difference and a large scatter. The colour of Marco et al. (2001) is 0.03 mag bluer than that of Fitzsimmons (1993) at mag. The maximum difference in the index is up to 0.1 mag, and the index shows a spread of 0.2 mag. Hence, the discrepancies and errors in the colours have most likely led to the overestimated distance (6.0 kpc).
3.4 Hertzsprung-Russell Diagram and Age of NGC 1893
We corrected for the reddening of the individual early-type members as described in the previous section. However, as it is very difficult to estimate reliable reddenings of PMS stars without accurate spectral types, the reddening map from Fig. 5 was used in the reddening correction for the PMS members and A-type MS members. Applying the distance modulus of 12.7 mag to all members, the observed CMDs were transformed to the dereddened CMDs, against , , and , and the HRD of NGC 1893 was then constructed using the several relations adopted in Paper 0.
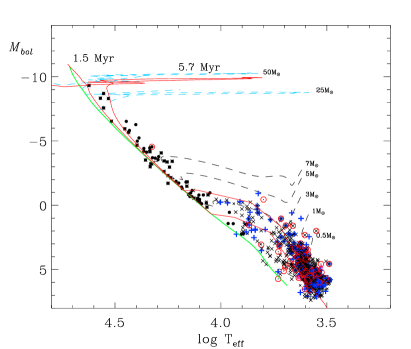
The effective temperature of stars earlier than O9 was obtained from the spectral type-effective temperature relation from table 5 in Paper 0. For the temperature scale of the PMS members with , the relation between and effective temperature of Bessell et al. (1998) was adopted, and another relation between and temperature (Bessell, 1995) was applied to the remaining cool PMS members. For the other MS members, we averaged the temperature derived from spectral type-effective temperature relation and colour-temperature relations with an appropriate weight. The bolometric corrections for all the members were carried out using table 5 in Paper 0. We present the HRD of NGC 1893 in Fig. 8. We note that 4 B-type stars were classified as giants by Massey et al. (1995). Negueruela et al. (2007) presented the more reliable spectral type and luminosity class for 2 B-type giant stars (HDE 243018 and TYC 2394-1141-1). We adopted their classifications in this work (see Table LABEL:tab1). The luminosity class of two B-type stars, TYC 2394-450-1 (B1.0III, , ) and TYC 2394-1502-1 (B1.5III, , ), is needs to be reexamined because Massey et al. (1995) classified them as giants, but they are placed near the ZAMS line. If such stars are bona-fide giants, they may be an old population in the Auriga OB2 association. Although we adopted the published luminosity class (III) in this work it does not cause serious problems because the difference in temperature between a MS and giant star at B1.0 and B1.5 is about 500 – 600 K and the difference in bolometric correction is only 0.01 – 0.02 mag.
Assuming solar composition, we roughly constrained the age of the cluster from the presence of an O4.5V star (HDE 242908). Massey (2013) summarized the properties of massive stars, such as the initial mass, effective temperature, luminosity, surface gravity, with spectral type. The lifetime of an O4V star is estimated to be 5.7 Myr. But with the presence of 3 O-type ZAMS stars (HDE 242935, BD +33 1025, and HDE 242926; Sota et al. 2011), the age of the cluster may be younger than 5.7 Myr. Isochrone fitting to the HRD is a convenient way to estimate the age of a cluster. A few evolutionary tracks (dashed lines) with different initial masses and isochrones (solid lines) for different ages are superimposed on the HRD. The stellar evolutionary models of Ekström et al. (2012) taking into account the effect of stellar rotation on the evolution of stars () were used for MS stars, while we used the models of Siess et al. (2000) for PMS stars. The isochrones (0.0, 1.5, and 5.7 Myr) were constructed from the two evolutionary models. The lower boundary of the most massive stars in the HRD is well predicted by the isochrone with an age of 1.5 Myr. Thus, the MS turn-off age of NGC 1893 is about 1.5 Myr.
There are two previous studies for the light element abundance of NGC 1893 (e.g. Rolleston et al. 1993; Daflon & Cunha 2004). Rolleston et al. (1993) have estimated the abundance of 6 stars using LTE models of stellar atmosphere and concluded that there is no evidence for low abundance. On the other hand, Daflon & Cunha (2004) investigated the light element abundance of 2 cluster members with modern non-LTE models. The light elements were dex less abundant than those of clusters in the solar neighbourhood. If the result of the former is valid, the turn-off age in this work is likely appropriate. The Geneva group has published grids of stellar evolutionary models for extremely different chemical compositions (, Ekström et al. 2012; , Georgy et al. 2013). According to the models for high-mass stars in the range of 32 – 60 , the evolutionary tracks for a given mass are far different because of the large difference in chemical composition. We simply compared the age and luminosity of the high-mass stars at the MS turn-off in the solar metallicity models with those of their counterparts in the low-metallicity models. The solar metallicity models give an older age than low-metallicity models for the same mass. The differences between stars with different chemical composition were about 0.4 Myr in age and 0.1 mag in bolometric magnitude, respectively. We also considered the evolutionary models of Brott et al. (2011), in which they published grids of stellar evolutionary models for 3 different initial metallicity environments - the Galaxy, the Large and Small Magellanic Clouds. The isochrone with the chemical composition of the Galaxy for 1.8 Myr appears to well fit to the position of high-mass members in the HRD, while the models with the composition of the Large Magellanic Cloud gives an age of 2.3 Myr. Thus, a systematic uncertainty of age caused by the uncertainty of chemical composition is about 0.5 Myr in the case of very young open clusters ( 2 Myr).

Although HDE 242926 is an O7Vz star according to Sota et al. (2011), its luminosity () at a given effective temperature is higher than that of HDE 242935 (, O6.5V) and BD +33 1025 (, O7Vz). Jones (1972) has tagged the star as having a variable radial velocity, and therefore it is still possible that HDE242926 may be a binary/multiple system. The luminosity of the O8 star TYC 2394-1214-1 is also comparable to that of HDE 242935. We could not find the luminosity class of the star in Hoag & Applequist (1965) as well as information on possible multiplicity, and therefore the star was assumed to be MS in this work. It is possible that the star has more than one high-mass companion, or that its spectral type is incorrect.
The majority of the PMS members have masses smaller than as seen in the HRD. Intermediate-mass PMS stars () seem to be approaching the ZAMS. There are quite a few PMS members that are near or on the ZAMS. These stars may be either PMS stars with an edge-on disc as discussed by Prisinzano et al. (2011) or old population stars in the Auriga OB 2 association. We also estimated the age of NGC 1893 from the PMS members using the PMS evolutionary models of Siess et al. (2000) and present the age distribution in Fig. 9. The peak of the distribution appears at 1.0 – 1.5 Myr. The median age is about 1.9 Myr with an age spread of 5 Myr, where the spread was defined as the age difference between the 10 and 90 percentiles in the cumulative age distribution of the PMS members (Sung & Bessell, 2010). The age scale between the MS and PMS members also shows a good consistency. The age spread is very similar to that found in other young open clusters, such as NGC 2244 (Park & Sung, 2002), NGC 2264 (Park et al., 2000), NGC 6530 (Sung et al., 2000), Trumpler 14 and 16 (Hur et al., 2012), and IC 1848 (Lim et al., 2014), being in a good agreement with that of Pandey et al. (2013) for NGC 1893.
The age spread of PMS stars is thought to be a key to understanding the formation processes of star clusters. However, there are well-known caveats for the derived age spread of PMS stars. A few observational uncertainties affect the luminosities and effective temperature of PMS stars. The inclusion of field interlopers in the member list can lead the age distribution to be wider (Hartmann, 2003). We obtained the ages of PMS stars based on the carefully selected members (see Section 3.1). The influence of non-members on the age distribution may therefore be negligible. Differential reddening is, in general, found in extremely young open clusters and SFRs. Imperfect reddening correction for such PMS stars is one of the probable sources causing an apparent spread in luminosity and temperature. In addition, PMS stars occupy the faint part of CMDs, and so photometric errors are more likely to contribute to the spread of these stars.
We examined these issues using Monte-Carlo simulations. A total of 800 artificial PMS stars in the mass range of 0.5 to 5 were generated by using the PMS models of Siess et al. (2000). The underlying IMF was assumed to be the Salpeter IMF (Salpeter, 1955). The age of the artificial stars was set to 2 Myr, and an instantaneous star formation history was assumed, i.e. no spread in the age. The luminosity and temperature were transformed to magnitude and color by using the relations of Bessell (1995) and Bessell et al. (1998). The reddening was assumed to be the mean value of mag. In order to reproduce an uncertainty in the reddening correction we adopted a normal distribution ( mag). The reddening law was assumed to be . The reddened photometric data of the artificial stars were then obtained from this procedure. We corrected for the reddening with the mean value, and then obtained the HRD and age distribution as described above. An age spread () of 0.5 Myr was found for a dispersion of 0.1 mag in reddening.
Another data set of artificial stars were generated using the same procedure as above, but without the reddening. We assumed the increase in photometric errors with magnitude to have a similar distribution to the observed one. The errors at a given magnitude were set to have a normal distribution. We obtained the age distribution after adding the generated errors to the data. The derived age spread was about 1 Myr. A simulation taking into account both the uncertainties in reddening and photometry was also carried out. The resultant age spread was also about 1 Myr. Given the results of the simulations, photometric errors can be one of the major sources affecting the age spread. Results obtained from a single ground-based observation may include that spread. However, there needs to be additional sources to explain the observed spread of 5 Myr. Burningham et al. (2005) investigated the influence of variability on timescales of a few years, and binarity, on an observed age spread, concluding that those factors can contribute only a small fraction of the apparent age spread. Star formation history within NGC 1893 turns out to contribute to a spread larger than 0.5 Myr. Details on this issue will be discussed in Section 6. Several previous studies have pointed out that evolutionary models of PMS stars are likely to overestimate the age of intermediate-mass PMS stars (e.g. Sung et al. 1997, 2004; Hartmann 1999). However, were the age distribution of these PMS stars shifted toward older age, one would expect the age spread to become even wider. We checked the age distribution of the PMS members with masses larger than 1.5 . A peak in the distribution appears near at 2 Myr. This is slightly older than that found in Fig. 9. However, the fraction of the stars in the mass range is only about 15 per cent of the used sample. The contribution of intermediate-mass PMS stars to the observed age spread may not be significant.
Our age estimate (1.5 Myr) from the MS members is in good agreement with that of Prisinzano et al. (2011). Tapia et al. (1991) and Sharma et al. (2007) found a somewhat older age of 4 Myr from isochrone fitting. Current studies (Negueruela et al., 2007; Sota et al., 2011) have confirmed that the most massive O-type stars (BD +33 1025, HDE 242908, HDE 242926, and HDE 242935) are on the MS. However, the brightest stars in figure 11 of Tapia et al. (1991) are located on the giant loci. It implies that their age is overestimated due to the incorrect distance (4.4 kpc). In the case of Sharma et al. (2007), the age estimation seems to be associated with the limited age range (from 4 Myr to 16 Gyr) of the stellar evolutionary models they used. For the PMS stars, our age estimates are commensurate with those of previous studies (Negueruela et al., 2007; Sharma et al., 2007; Prisinzano et al., 2011; Pandey et al., 2013).
4 THE INITIAL MASS FUNCTION
The IMF is an essential tool to understand star formation processes. Therefore a lot of studies on IMF, especially on the universality of IMF have been carried out. Bastian et al. (2010) discussed the variation of the IMF with environmental conditions or cosmic time based on many previous studies. However, none of the studies could arrive at any firm conclusion on its variation with environmental conditions, such as different metallicity, the galactic tidal force, suppression of the low-mass star formation by a number of high-mass stars, etc. In this context, NGC 1893 is one of ideal laboratories to study the IMF of young open clusters in the outer Galaxy. In this work, we can derive reliable IMF over a wide mass range, from low-mass PMS stars to massive O-type stars.
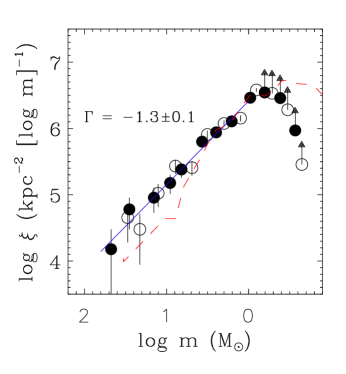
The mass of MS members is estimated by comparing their position in the HRD to the evolutionary tracks of Ekström et al. (2012) with various initial masses. For PMS members, the PMS evolutionary tracks of Siess et al. (2000) were used to determine the individual mass of each star. The sum of the masses of the members yields a total mass of 1,300 for the cluster. This is a lower limit because a large number of sub-solar mass PMS stars below the completeness threshold are not taken into account. In order to derive the IMF we counted stars within a given mass bin (). The star counts were then normalized by the logarithmic mass bin and the observed area. The IMF of NGC 1893 is shown in Fig. 10. We shifted the mass bin by 0.1 and rederived the IMF (open circle) using the same procedure as above to avoid binning effects.
While the IMF of other young open clusters, such as NGC 2244 (Park & Sung, 2002), NGC 2264 (Park et al., 2000), NGC 6530 (Sung et al., 2000), and IC 1848 (Lim et al., 2014), shows a significant dip between and , that of NGC 1893 (this work) exhibits a smooth increase down to the completeness limit (see also Sung & Bessell 2010; Hur et al. 2012; Sung et al. 2013a). It implies that complete membership selection is crucial for the study of the IMF. Sung & Bessell (2010) presented the IMF of NGC 2264 complete down to 0.25 using the X-ray source catalogue of Flaccomio et al. (2006). The luminosity of a PMS star with a mass of 0.2 at 3 Myr was obtained from the PMS models of Siess et al. (2000), and its X-ray luminosity was estimated by assuming the saturation level of X-ray luminosity (). A ratio of the X-ray luminosities of PMS stars in NGC 1893 and NGC 2264 at a completeness limit was computed by considering the distance and the total exposure time of each X-ray observation. The X-ray luminosity of the lowest-mass PMS star in the complete sample of NGC 1893 was estimated to be . From the dynamo saturation level the luminosity of the star was about , which could be found in the PMS model of Siess et al. (2000) for 0.4 star at 1.2 Myr (the peak age in Fig. 9). Hence, the X-ray source catalogue (Caramazza et al., 2012) is complete down to . That mass limit is in good agreement with that expected from Caramazza et al. (2012). Hence, the IMF derived in this work is complete down to according to the completeness of our photometry.
The slope () of the IMF is about for all the observed members with mass larger than . It appears to be consistent with the single IMF (Salpeter, 1955) and the Kroupa IMF (Kroupa, 2001, 2002). However, the spatial coverage in this work is slightly dislocated from that of the Chandra observation as shown in the left-hand side panel of Fig. 1. We derived the IMF only for the members observed within the Chandra field of view. The slope of this IMF is almost the same as the result above. The different spatial coverage may not result in a serious discrepancy. Sharma et al. (2007) also obtained the same slope over the mass range of to from the statistically cleaned () CMD. A further steep slope of was derived by Massey et al. (1995) for stars with mass larger than . Although our research for NGC 1893 was made by assuming a solar composition, it is interesting to note that the slope of the IMF indicates the standard Salpeter/Kroupa IMF. It implies that the property of star formation in the outer Galaxy may be similar to that found in the solar neighbourhood.
We also overplotted the IMF of NGC 2264 (Sung & Bessell, 2010) in Fig. 10 to compare its shape with that of NGC 1893. The IMF of NGC 1893 is flatter than that of NGC 2264 () for masses greater than . However, NGC 1893 hosts 5 confirmed O-type stars, while there is a binary system consisting of 2 O-type stars in NGC 2264 (Gies et al., 1993). Furthermore, the binary system of the latter was assumed to be a single star due to the limited information on the multiplicity of the observed stars. It is difficult to meaningfully compare the IMF of the two clusters in the high-mass regime due to the small number of massive stars. Hence, we are investigating the integrated features of the IMF derived from various SFRs and young open clusters in a homogeneous way based on a series of studies to arrive at a firm conclusion on the universality or diversity of the IMF.
5 MASS ACCRETION RATES OF PMS STARS WITH UV EXCESS
The mass accretion rate is a useful physical quantity to assess the evolution of circumstellar discs and to understand the formation processes of a planetary system around PMS stars. Since the application of the magnetospheric accretion model to PMS stars (Uchida & Shibata, 1985; Bertout et al., 1988; Königl, 1991), the physical quantities associated with the accretion process were studied through observation and modelling UV excess emission or/and spectral lines such as H, Pa , Br, [O I] 6300, etc, within the paradigm. Many studies have been devoted to investigating the mass accretion rates of PMS stars in several nearby SFRs, such as the Chamaeleon I, ONC, Ophiuchi, and Taurus region, etc (Fang et al. 2009, 2013; Manara et al. 2012; Muzerolle et al. 1998, 2003, 2005; Natta et al. 2004, 2006; Rebull et al. 2000, and references therein). The goal from our series of studies is to obtain the mass accretion rate of PMS stars () in many young open clusters within 3 kpc of the Sun in a homogeneous manner. We have photometrically estimated the mass accretion rates of PMS stars in the young open cluster IC 1848 (Lim et al., 2014) as part of the SOS project. Since NGC 1893 is young enough to study the mass accretion rates of intermediate-mass PMS stars, this study can provide more information on the relation for such stars together with the results for IC 1848. In this section we estimate the accretion luminosities and mass accretion rates of the PMS members with a UV excess using the empirical relation derived by Gullbring et al. (1998) and compare the results with that of other studies which used independent ways to estimate accretion luminosities for different nearby SFRs.
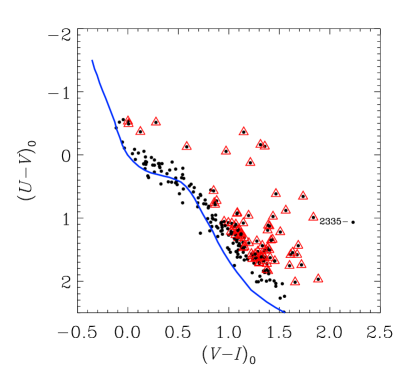
The PMS members with UV excess emission can be identified in the diagram as shown in Fig. 11. These PMS members appear to be bluer in than normal MS stars at a given . Although there may be a considerable scatter, a few stars exhibit a prominent UV excess. Rebull et al. (2000) have discussed several sources affecting the calculated UV excess, such as chromospheric activity, accretion activity, and the difference between the intrinsic colours of MS and giant stars and examined the influence of chromospheric activity on the size of the UV excess using field dMe stars and young stars in the Taurus-Auriga SFR. The authors suggested that the limit of UV excess from chromospheric activity is about -0.5 mag. This value is adopted as a criterion to select those PMS members with UV excess emission as used in Lim et al. (2014). A total of 82 members were identified as PMS stars with a UV excess as shown in Fig. 11 (triangle). It is worth noting that the star ID 2335 with small photometric errors has a blue colour. Given its position in the HRD ( and ) the star may be a very young PMS star evolving along the Hayashi track. Since the luminosity and effective temperature of the star are out of range of the evolutionary tracks published by Siess et al. (2000), we could not obtained its mass, thereby excluding that in the determination of mass accretion rate as well as the IMF.
We computed the magnitude expected for a normal photosphere of MS stars and the extinction-corrected magnitude of stars with a UV excess then transformed them to luminosity ( and ) using a bandwidth (700 Å) and zero flux of Å-1 for the Bessell filter (Cox, 2000). The accretion luminosity was estimated from the relation of Gullbring et al. (1998):
| (6) |
where .
In order to obtain mass accretion rates we estimated the mass of individual stars from the evolutionary models of Siess et al. (2000) as described in the previous section. The radii of stars were obtained by using the effective temperature and bolometric magnitude of PMS stars. The mass accretion rate of PMS stars was estimated by using the mass (), radius (), and accretion luminosity () with the equation below (Hartmann et al., 1998; Gullbring et al., 1998):
| (7) |
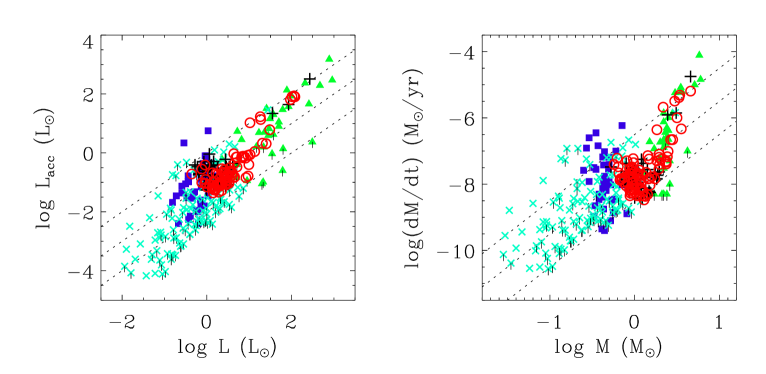
where and represent the gravitational constant and mass accretion rate, respectively. We present the accretion luminosity and mass accretion rate of 82 PMS members in Fig. 12. Because of the large distance to NGC 1893, our study only covers the mass ranges between and . We also plotted the results of other studies for different SFRs (Hartmann et al. 1998; Natta et al. 2006; Mendigutía et al. 2011, and data therein) which used independent ways to estimate the accretion luminosity as well as those of our previous study for the young open cluster IC 1848 (Lim et al., 2014). The accretion luminosity and mass accretion rate in this study seem to be compatible with those of other studies. The mean mass accretion rate of stars with mass smaller than is about .
Attempts to understand the accretion disc have been based on the viscous disc model (Lynden-Bell & Pringle, 1974). Currently, the theory that magnetorotational instability (MRI) in the ionized disc plays a very important role in the angular momentum transport has been accepted as the major viscosity mechanism. Since MRI operates efficiently in a highly ionized accretion disc, there needs to be ionizing sources from the central star or within the disc. Glassgold et al. (1997) suggested that stellar X-rays could be a feasible ionizing source of a circumstellar disc. Muzerolle et al. (2003) pointed out that it is difficult to understand how the variation of X-ray luminosity with the mass of the central stars affects the - relation, although the correlation between X-ray luminosity and mass was found by many other studies (Feigelson et al., 2003; Flaccomio et al., 2003; Mokler & Stelzer, 2002; Preibisch & Zinnecker, 2002). On the other hand, Hartmann et al. (2006) suggested that the - relation can be interpreted as a complicated mix of different accretion mechanisms, such as layered accretion, fully viscous accretion, and gravitational instability.
In the left-hand side panel of Fig. 12, we plotted the 3 dotted lines corresponding to as shown in Mendigutía et al. (2011). With the estimates of other studies the accretion luminosity of the PMS stars () is roughly consistent with , while the accretion luminosity of stars with is close to after an abrupt increase. A similar aspect is found in the relation between the mass accretion rate and the mass of the central stars. The mass accretion rate of PMS stars with mass larger than is approximately 10 times higher than that expected from the - relation for lower mass stars. Mendigutía et al. (2011) found that the age of Herbig Ae/Be stars in their sample was systematically younger than that of low-mass stars, and the steep slope in the mass accretion rate with respect to the stellar mass was interpreted as a consequence of the huge accretion of such stars in the early stages. However, Garcia Lopez et al. (2006) obtained lower mass accretion rates for the same Herbig Ae stars. The estimates of Donehew & Brittain (2011) (except the upper limits), also reveal 3 times lower values for Herbig Ae/Be stars. Practical uncertainties in calibration schemes, reddening correction, and distance can result in systematic differences in the mass accretion rates for the Herbig Ae/Be stars between authors.
While X-ray emission from the central stars plays a crucial role in the operation of MRI within the accretion discs of low-mass PMS stars, the role of X-ray emission in the accretion processes of intermediate-mass PMS stars is still uncertain (Hartmann et al. 2006 and references therein). In our samples 4 out of 6 intermediate-mass PMS stars with UV excess emission () have low X-ray luminosities of erg s-1, that are comparable to those of low-mass counterparts (). It implies that X-ray emission from the central star may be insufficient to operate MRI. On the other hand, gravitational instability is one of the possible mechanisms of angular momentum transfer within circumstellar discs. According to Hartmann et al. (2006) the disc mass of PMS stars derived from dust emission (e.g. Andrews & Williams 2005) is an order of magnitude lower than that required to operate gravitational instability in the disc. They suggested that the smaller derived disk masses may result from an inappropriate accounting for the opacity variation due to dust growth and that the formation of planets within the disk and the spiral structure of the disk are indicating larger disk masses that would enable gravitational instability to operate. In this context, the structure and geometry of accretion discs may be an essential issue in understanding the evolution of the discs in the intermediate-mass PMS star systems. However, the details are not within our scope of study based on such limited data. Those PMS stars with a UV excess are good candidates for spectroscopic follow-up observations in the future.
6 TRIGGERED STAR FORMATION IN NGC 1893
The two emission nebulae Sim 129 and 130 attract many astronomers to study triggered star formation mechanisms in the cluster (e.g. Maheswar et al. 2007; Negueruela et al. 2007; Sharma et al. 2007; Pandey et al. 2013). This is because the glowing heads of the nebulae face the centre of the cluster. A number of H emission stars were identified in the vicinity of the nebulae (Marco & Negueruela, 2002; Maheswar et al., 2007; Negueruela et al., 2007; Sharma et al., 2007). There have been a few attempts to investigate the age sequence of the PMS stars from the centre of cluster to the emission nebulae (e. g. Sharma et al. 2007; Pandey et al. 2013). However, the radial variation in the ages seems to be rather ambiguous (see the right-hand side panel in figure 7 of Pandey et al. 2013). In order to investigate convincing evidence for the triggered star formation we have examined the age distribution of the PMS stars with distance from the centre of the cluster.
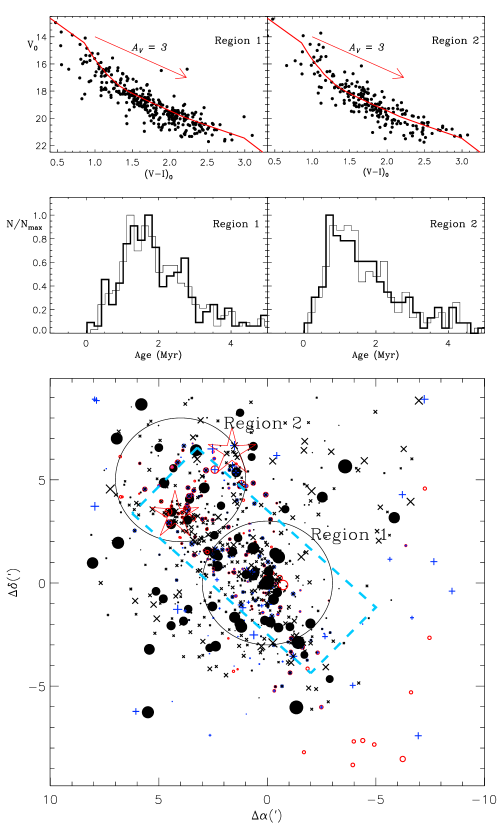
As shown in Fig. 13 two different regions were selected in this analysis. One region (Region 1) was centred on the O6.5V((f))z star HDE 242935 (Sota et al., 2011), and the other region (Region 2) was located in the vicinity of the two emission nebulae. The diameter of the regions is about 6 arcmin. The upper panels in Fig. 13 exhibit the reddening-corrected CMDs of the PMS members in the regions. The relative number of stars brighter than the 1.5 Myr isochrone (solid line) at a given colour appears to be larger in the Region 2. The reddening values of the stars in the regions were estimated by using the same relation as shown in the middle panel of Fig. 5, being within a similar range [ – 0.64 mag] although the differential reddening in the Region 2 is less significant than that in the Region 1. Hence, the luminous PMS members in the Region 2 are not related to any systematic errors in reddening correction. Given that the reddening vector (arrow) is almost parallel to the slope of the PMS isochrone, the difference between the stars in the Region 1 and 2 may be associated with their age difference rather than the variation of reddening.
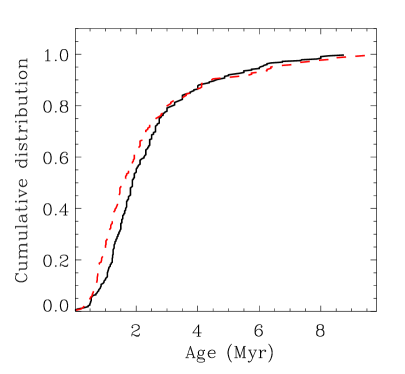
We counted the number of stars within a given age bin, where the bin size was about 0.2 Myr. The age distributions of the PMS members in the Region 1 and 2 are shown in the middle panels, respectively. The histograms are normalized by a peak value of each distribution. To avoid a binning effect another age distribution (thin solid line) was obtained by shifting the age bin by 0.1 Myr. The peak of the age distribution in Region 1 appears at 1.5 Myr, while that in Region 2 is slightly shifted toward a younger age ( 1 Myr). The age difference between the two groups is about 0.5 Myr. The PMS stars close to Sim 129 and 130 are likely to be younger than those around the centre of the cluster (see also Pandey et al. 2013). We present the cumulative age distribution of the PMS stars in each region in Fig. 14. The figure shows that the stars located in Region 2 are slightly younger than those in Region 1. According to the Kolmogorov-Smirnov test, the possibility that the PMS stars in the two regions have the same origin is about 0.1 per cent. A statistical approach also supports the age difference between the two regions.
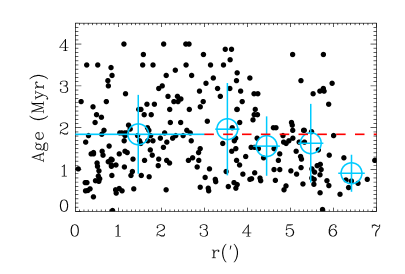
We investigated whether or not the formation of the younger age group was triggered by the high-mass stars. If the O-type stars in the centre of NGC 1893 are responsible for the formation of the new generation stars, one may expect the age of the PMS stars to be sequentially younger with distance from the cluster centre. We selected the PMS members within a region encompassing the cluster core and periphery of the two emission nebulae (the rectangular box in Fig. 13). The mass of the PMS members was limited to 0.5 – 1.5 because of the fact that current evolutionary models tend to overestimate the age of intermediate-mass PMS stars (Hillenbrand, 1997; Sung et al., 1997, 2004; Hartmann, 1999). We only considered the PMS members younger than 4 Myr to seek a clear age variation. Fig. 15 shows the age variation of PMS stars within the rectangular box in Fig. 13 to be away from the cluster core. Since new generation stars are expected to have formed just after the formation of the cluster core the first bin includes all the stars in the core. The projected extent is about 3 arcmin which was inferred from the surface density profile. The mean age (circle) reasonably attenuates toward the emission nebulae out of the cluster core ( arcmin) although there is a rather large scatter arising from many sources of random errors, such as photometric errors, incomplete reddening correction, excess emissions from both circumstellar discs and accretion activities, and variability (see Section 3.4 and the review of Soderblom et al. 2013 for details). On the other hand, the projected distance between the ionizing source HDE 242935 and the emission nebula Sim 129 is about 5.6 arcmin ( 5.6 pc). If we assume a sound speed of 9.6 km/s in an expanding H II region (), the travel time of the materials being compressed from the the O-type star to the current position of the emission nebula is about yr. This is in reasonably agreement with the age difference between Region 1 and 2. Our results well support the argument of previous studies (Sharma et al., 2007; Pandey et al., 2013) that the formation of the young stars in the vicinity of Sim 129 and 130 may have been triggered by the source HDE 242935 in the centre of the cluster.
There are two convincing mechanisms for triggered star formation. The first is the ‘collect and collapse’ (hereafter CC) process proposed by Elmegreen & Lada (1977). Massive stars create an H II region in their natal cloud. Subsequently, the expansion of the H II region contacts the molecular cloud and generates a shock front at the boundary. Gas and dust in the cloud are swept away and compressed into small clumps as the shock front is propagated toward the outside of the cloud. In the end, the clumps become gravitationally unstable at a critical density, and so star formation takes place within the clumps. For instance, the new generation of stars along the border of the giant H II region W5 are thought to have been formed by the CC mechanism (Koenig et al., 2008). The other mechanism is the ‘radiatively driven implosion’ (hereafter RDI) process, in which strong UV radiation from massive stars leads pre-existing density-enhanced clumps to gravitationally collapse. The typical observational evidence are the presence of cometary globules, bright-rimmed molecular clouds, and the spatial distribution and age variation of PMS stars (e. g. Lefloch & Lazareff 1994; Lefloch et al. 1997; Thompson et al. 2004; Sharma et al. 2007; Koenig et al. 2008; Pandey et al. 2013). For the formation of the younger PMS population within NGC 1893, Pandey et al. (2013) advocates a scenario that the formation of new generation stars has been controlled by the RDI process (Sharma et al., 2007; Maheswar et al., 2007).
Sharma et al. (2007) investigated the structure of the surrounding interstellar medium using the Midcourse Space Experiment -band intensity and the NRAO VLA Sky Survey radio contour maps. Few emission clumps were found in the periphery of the cluster, while an extended arc-like cloud was located at the western part (see also figure 1 of Caramazza et al. 2008). The entire structure may have been created by the expansion of the H II region during the early phase of cluster formation. There are two considerable clumps associated with IRAS sources and an O-type star in the extended cloud. These were interpreted as objects escaping from the natal cloud (Sharma et al., 2007). Several PMS stars with either H or MIR excess emission are sparsely populated in the direction of the arc-like cloud (see Fig. 13). If the current location of the stars is related to their birthplace, the expansion of the H II bubble may be responsible for their formation, i.e. the CC process. However, the connection between the stars and the H II bubble seems to be uncertain. Other clumps are associated with the prominent emission nebulae Sim 129 and 130. The morphology of the nebulae facing toward the cluster core, especially the bright rim, is likely indicative of ongoing interaction with the UV radiation emitted from the ionizing sources (Lefloch & Lazareff, 1994). The stellar density in the direction of the nebulae is higher than that in other regions outside of the cluster core (see also figure 6 of Sharma et al. 2007). If the distribution of the stars reflects the sub-structure of the natal cloud prior to their formation (Elmegreen et al., 2000), the density of the cloud might be partly high. This assumption seems to explain the presence of pre-existing density-enhanced clumps. In addition, the ages of the PMS stars near the emission nebulae (in Region 2) are similar to the formation timescale of cometary globules ( Myr, Lefloch & Lazareff 1994). Hence, these aspects indicate that the RDI process seems to be a more plausible triggering mechanism in the north-east of NGC 1893 rather than the CC process.
7 SUMMARY
NGC 1893 which hosts a large number of young stars, from low-mass PMS stars to massive O-type stars, is one of the well-known young open clusters in the Galaxy. The cluster gives us a chance to study star-forming activities in the outer Galaxy, which is (putatively) a different environment from the solar neighbourhood (Caramazza et al., 2008) although its chemical composition is somewhat uncertain (Rolleston et al., 1993; Daflon & Cunha, 2004). We carried out and H photometry for the cluster as part of the SOS project. This study provided not only homogeneous photometric data but also detailed and comprehensive results for NGC 1893 as shown below.
Using the photometric properties of early-type stars, 65 early-type (O – B) and 6 A-type MS stars were selected as members. We identified 213 young stars with MIR excess emission from Spitzer IRAC data (Caramazza et al., 2008). From our H photometry, 126 H emission stars and candidates were also identified, most of which are PMS members. In addition, 703 PMS members (including 55 candidates) were found using the X-ray source list of Caramazza et al. (2012). A total of 906 stars were thus selected as members of NGC 1893.
From the diagram we obtained the reddening of individual early-type stars yielding a mean reddening of mag. As seen in most young star clusters or associations, differential reddening is not negligible. We constructed the reddening map from the differential surface density map between the and 3.6 bands. The photometric data from the optical to MIR for the early-type stars in the observed regions allowed us to test the reddening law of NGC 1893. We confirmed the normal reddening law () toward the cluster from various colour excess ratios over a wide wavelength coverage from the optical to the MIR.
A careful ZAMS fitting to the lower boundary of the MS band was carried out in the reddening-independent - planes, and we obtained a distance modulus of mag, which is in reasonably good agreement with that of previous photometric studies. The isochrone fitting to the most massive stars in the HRD gives an age of 1.5 Myr, and the age distribution of PMS stars shows the median age of 1.9 Myr with an age spread of 5 Myr. The age scale between the MS and PMS members appears to be well consistent. The age spread of the PMS members is very similar to that found in many other young open clusters.
Based on a careful membership selection, the IMF complete down to was derived from cluster members. The slope () is consistent with the Salpeter/Kroupa IMF. It implies that the property of star formation in the outer Galaxy may not be far different from that found in the solar neighbourhood. This will be one of the valuable results to help arrive at a firm conclusion on the universality of the stellar IMF in the future.
We found 82 PMS stars with strong UV excess emission from our photometry. The luminosity was transformed to the accretion luminosity by adopting the empirical relation from the literature. Finally, the mass accretion rate of the PMS stars was estimated by using the accretion luminosity, the computed stellar radius, and the stellar mass inferred from the PMS evolutionary models. The stars with mass smaller than 2 among the UV excess stars exhibited a mean mass accretion rate of . Our result is well consistent with the estimates of other studies. We also found that high-mass stars show a higher mass accretion rate than the accretion rates expected from the correlation as shown in previous studies (Mendigutía et al., 2011; Lim et al., 2014)
The two emission nebulae Sim 129 and 130 are interesting objects with which to study triggered star formation processes in NGC 1893. As done in previous studies (Sharma et al., 2007; Pandey et al., 2013), we investigated the age sequence from the O-type star HDE 242935 to the emission nebulae. The age distribution of the PMS members showed a continuously varying age sequence, which appears to be more significant than the result of previous studies. This has been interpreted as evidence of triggered star formation. On the basis of several discussions, we concluded that the RDI process may be the dominant triggering mechanism for new generation stars in NGC 1893.
acknowledgments
The authors thank the anonymous referee for many useful comments. This work was supported by a National Research Foundation of Korean (NRF) grant funded by the Korea Government (MEST) (Grant No.20130005318).
References
- Agüeros et al. (2009) Agüeros M. A., Anderson S. F., Covey K. R., Hawley S. L., Margon B., Newsom E. R., Posselt B., Silvestri N. M., Szkody P., Voges W., 2009, ApJS, 181, 444
- Andrews & Williams (2005) Andrews S. M., Williams J. P., 2005, ApJ, 631, 1134
- Bastian et al. (2010) Bastian N., Covey K. R., Meyer M. R., 2010, ARA&A, 48, 339
- Becker (1963) Becker W., 1963, ZAp, 57, 117
- Bertout et al. (1988) Bertout C., Basri G., Bouvier J., 1988, ApJ, 330, 350
- Bessell (1990) Bessell M. S., 1990, PASP, 102, 1181
- Bessell (1995) Bessell M. S., 1995, in Proc. ESO Workshop, The Bottom of the Main Sequence and Beyond, ed. C. G. Tinney (Berlin: Springer), 123
- Bessell et al. (1998) Bessell M. S., Castelli F., Plez B., 1998, A&A, 333, 231
- Brott et al. (2011) Brott I. et al., 2011, A&A, 530, 115
- Burningham et al. (2005) Burningham B., Naylor T., Littlefair S. P., Jeffries R. D., 2005, MNRAS, 363, 1389
- Calvet & Gullbring (1998) Calvet N., Gullbring E., 1998, ApJ, 509, 802
- Calvet et al. (2004) Calvet N., Muzerolle J., Briceño C., Hernández J., Hartmann L., Saucedo J. L., Gordon K. D., 2004, AJ, 128, 1294
- Caramazza et al. (2008) Caramazza M., Micela G., Prisinzano L., Rebull L., Sciortino S., Stauffer J. R., 2008, A&A, 488, 211
- Caramazza et al. (2012) Caramazza M., Micela G., Prisinzano L., Sciortino S., Damiani F., Favata F., Stauffer J. R., Vallenari A., Wolk S. J., 2012, A&A, 539, 74
- Clark et al. (2005) Clark J. S., Negueruela I., Crowther P. A., Goodwin S. P., 2005, A&A, 434, 949
- Cox (2000) Cox A. N. (ed.), 2000, in Allen’s astrophysical quantities (4th ed; New York: Springer), p387
- Crowther et al. (2006) Crowther P. A., Hadfield L. J., Clark J. S., Negueruela I., Vacca W. D., 2006, MNRAS, 372, 1407
- Cuffey (1973a) Cuffey J., 1973a, AJ, 78, 408
- Cuffey (1973b) Cuffey J., 1973b, AJ, 78, 747
- Daflon & Cunha (2004) Daflon S., Cunha K., 2004, ApJ, 617, 1115
- Dallier et al. (1996) Dallier R., Boisson C., Joly M., 1996, A&AS, 116, 239
- De Marchi et al. (2013) De Marchi G., Beccari G., Panagia N., 2013, ApJ, 775, 68
- Donehew & Brittain (2011) Donehew B., Brittain S., 2011, AJ, 141, 46
- Draine (2003) Draine B. T., 2003, ApJ, 598, 1026
- Ekström et al. (2012) Ekström S. et al., 2012, A&A, 537, 146
- Elmegreen et al. (2000) Elmegreen B. G., Efremov Y., Pudritz R. E., Zinnecker H. 2000, in Protostars and Planets IV, ed. V. Mannings, A. P. Boss, & S. S. Russell (Tucson: Univ. Arizona Press), 179
- Elmegreen & Lada (1977) Elmegreen B. G., Lada C. J., 1977, ApJ, 214, 725
- Eswaraiah et al. (2011) Eswaraiah C., Pandey A. K., Maheswar G., Medhi B. J., Pandey J. C., Ojha D. K., Chen W. P., 2011, MNRAS, 411, 1418
- Fang et al. (2009) Fang M., van Boekel R., Wang W., Carmona A., Sicilia-Aguilar A., Henning Th., 2009, A&A, 504, 461
- Fang et al. (2013) Fang M., Kim J. S., van Boekel R., Sicilia-Aguilar A., Henning Th., Flaherty K., 2013, ApJS, 207, 5
- Feigelson et al. (2003) Feigelson E. D., Gaffney J. A., Garmire G., Hillenbrand L. A., Townsley L., 2003, ApJ, 584, 911
- Fitzsimmons (1993) Fitzsimmons A., 1993, A&A, 99, 15
- Flaccomio et al. (2003) Flaccomio E., Damiani F., Micela G., Sciortino S., Harnden F. R., Jr., Murray S. S., Wolk S. J., 2003, ApJ, 582, 398
- Flaccomio et al. (1999) Flaccomio E., Micela G., Sciortino S., Favata F., Corbally C., Tomaney A., 1999, A&A, 345, 521
- Flaccomio et al. (2006) Flaccomio E., Micela G., Sciortino S., 2006, A&A, 455, 903
- Garcia Lopez et al. (2006) Garcia Lopez R., Natta A., Testi L., Habart E., 2006, A&A, 459, 837
- Georgy et al. (2013) Georgy C. et al., 2013, A&A, 558, 103
- Gies et al. (1993) Gies D. R., Mason B. D., Hartkopf W. I., McAlister H. A., Frazin R. A., Hahula M. E., Penny L. R., Thaller M. L., Fullerton A. W., Shara M. M., 1993, AJ, 106, 2072
- Glassgold et al. (1997) Glassgold A. E., Najita J., Igea J., 1997, ApJ, 480, 344
- Greve (2010) Greve A., 2010, A&A, 518, 62
- Gullbring et al. (1998) Gullbring E., Hartmann L., Briceño C., Calvet, N., 1998, ApJ, 492, 323
- Hanson et al. (1996) Hanson M. M., Conti P. S., Rieke M. J., 1996, ApJS, 107, 281
- Hartmann (1999) Hartmann L., 1999, NewA Rev., 43, 1
- Hartmann (2003) Hartmann L., 2003, ApJ, 585, 398
- Hartmann et al. (1998) Hartmann L., Calvet N., Gullbring E., D’Alessio P., 1998, ApJ, 495, 385
- Hartmann et al. (2006) Hartmann L., D’Alessio P., Calvet N., Muzerolle J., 2006, ApJ, 648, 484
- Hertz & Grindlay (1983) Hertz P., Grindlay J. E., 1983, ApJ, 275, 105
- Hillenbrand (1997) Hillenbrand L. A., 1997, AJ, 113, 1733
- Hiltner (1956) Hiltner W. A., 1956, ApJS, 2, 389
- Hoag & Applequist (1965) Hoag A. A., Applequist N. L., 1965, ApJS, 12, 215
- Hoag et al. (1961) Hoag A. A., Johnson H. L., Iriarte B., Mitchell R. I., Hallam K. L., Sharpless S., 1961, Publ. U.S. Naval Obs., 17, 343
- Hg et al. (2000) Hg E. et al., 2000, A&A, 355, 27
- Humphreys (1978) Humphreys R. M., 1978, ApJS, 38, 309
- Humphreys & Davidson (1979) Humphreys R. M., Davidson K., 1979, ApJ, 232, 409
- Hur et al. (2012) Hur H., Sung H., Bessell M. S., 2012, AJ, 143, 41
- Im et al. (2010) Im M., Ko J., Cho Y., Choi C., Jeon Y., Lee I., Ibrahimov M., 2010, JKAS, 43, 75
- Johnson (1957) Johnson H. L., 1957, ApJ, 126, 121
- Johnson et al. (1961) Johnson H. L., Hoag A. A., Iriarte B., Mitchell R. I., Hallam K. L., 1961, Lowell Obs. Bull., 5, 133
- Johnson & Morgan (1955) Johnson H. L., Morgan W. W., 1955, ApJ, 122, 142
- Jones (1972) Jones F. S., 1972, PASP, 84, 459
- Koenig et al. (2008) Koenig X. P., Allen L. E., Gutermuth R. A., Hora J. L., Brunt C. M., Muzerolle J., 2008, ApJ, 688, 1142
- Königl (1991) Königl A., 1991, ApJ, 370, 39
- Kook et al. (2010) Kook S.-H., Sung H., Bessell M. S., 2010, JKAS, 43, 141
- Kroupa (2001) Kroupa P., 2001, MNRAS, 322, 231
- Kroupa (2002) Kroupa P., 2002, Science, 295, 82
- Lancon & Rocca-Volmerange (1992) Lancon A., Rocca-Volmerange B., 1992, A&AS, 96, 593
- Lasker et al. (2008) Lasker B. M. et al., 2008, AJ, 136, 735
- Lata et al. (2012) Lata S., Pandey A. K., Chen W. P., Maheswar G., Chauhan N., 2012, MNRAS, 427, 1449
- Lefloch & Lazareff (1994) Lefloch B., Lazareff B., A&A, 289, 559
- Lefloch et al. (1997) Lefloch B., Lazareff B., Castets A., 1997, A&A, 324, 249
- Lim et al. (2008) Lim B., Sung H., Karimov R., Ibrahimov M., 2008, PKAS, 23, 1
- Lim et al. (2009) Lim B., Sung H., Bessell M. S., Karimov R., Ibrahimov M., 2009, JKAS, 42, 161
- Lim et al. (2011) Lim B., Sung H., Karimov R., Ibrahimov M., 2011, JKAS, 44, 39
- Lim et al. (2013) Lim B., Chun M.-Y., Sung H., Park B.-G., Lee J.-J., Sohn S. T., Hur H., Bessell M. S., 2013, AJ, 145, 46
- Lim et al. (2014) Lim B., Sung H., Kim J. S., Bessell M. S., Karimov R., 2014, MNRAS, 438, 1451
- Loktin et al. (2001) Loktin A. V., Gerasimenko T. P., Malysheva L. K., 2001, Astron. Astrophys. Trans., 20, 607
- Long & White (1980) Long K. S., White R. L., 1980, ApJ, 239, 65
- Lucy & White (1980) Lucy L. B., White R. L., 1980, ApJ, 241, 300
- Lynden-Bell & Pringle (1974) Lynden-Bell D., Pringle J. E., 1974, MNRAS, 168, 603
- Maheswar et al. (2007) Maheswar G., Sharma S., Biman J. M., Pandey A. K., Bhatt H. C., 2007, MNRAS, 379, 1237
- Manara et al. (2012) Manara C. F., Robberto M., Da Rio N., Lodato G., Hillenbrand L. A., Stassun K. G., Soderblom D. R., 2012, ApJ, 755, 154
- Marco et al. (2001) Marco A., Bernabeu G., Negueruela I., 2001, AJ, 121, 2075
- Marco & Negueruela (2002) Marco A., Negueruela I., 2002, A&A, 393, 195
- Massey (2013) Massey P., 2013, NewAR, 57, 14
- Massey et al. (1995) Massey P., Johnson K. E., DeGioia-Eastwood K., 1995, ApJ, 454, 151
- Mendigutía et al. (2011) Mendigutía I., Calvet N., Motesinos B., Mora A., Muzerolle J., Eiroa C., Oudmaijer R. D., Merín B., 2011, A&A, 535, 99
- Menzies et al. (1991) Menzies J. W., Marang F., Laing J. D., Coulson I. M., Engelbrecht C. A., 1991, MNRAS, 248, 642
- Moffat (1972) Moffat A. F. J., 1972, A&AS, 7, 355
- Mokler & Stelzer (2002) Mokler F., Stelzer B., 2002, A&A, 391, 1025
- Muzerolle et al. (1998) Muzerolle J., Hartmann L., Calvet N., 1998, AJ, 116, 2965
- Muzerolle et al. (2003) Muzerolle J., Hillenbrand L., Calvet N., Briceño C., Hartmann L., 2003, ApJ, 592, 266
- Muzerolle et al. (2005) Muzerolle J., Luhman K. L., Briceño C., Hartmann L., Calvet N., 2005, ApJ, 625, 906
- Natta et al. (2004) Natta A., Testi L., Muzerolle J., Randich S., Comerón F., Persi P., 2004, A&A, 424, 603
- Natta et al. (2006) Natta A., Testi L., Randich S., 2006, A&A, 452, 245
- Negueruela et al. (2010) Negueruela I., Clark J. S., Ritchie B. W., 2010, A&A, 516, 78
- Negueruela et al. (2007) Negueruela I., Marco A., Israel G. L., Bernabeu G., 2007, A&A, 471, 485
- Pandey et al. (2013) Pandey A. K., Samal M. R., Chauhan N., Eswaraiah C., Pandey J. C., Chen W. P., Ojha D. K., 2013, NewA, 19, 1
- Panzera et al. (1999) Panzera M. R., Tagliaferri G., Pasinetti L., Antonello, E., 1999, A&A, 348, 161
- Park & Sung (2002) Park B.-G., Sung H., 2002, AJ, 123, 892
- Park et al. (2000) Park B.-G., Sung H., Bessell M. S., Kang Y. H., 2000, AJ, 120, 894
- Pickles (1998) Pickles A. J., 1998, PASP, 110, 863
- Preibisch & Zinnecker (2002) Preibisch T., Zinnecker H., 2002, AJ, 123, 1613
- Prisinzano et al. (2011) Prisinzano L., Sanz-Forcada J., Micela G., Caramazza M., Guarcello M. G., Sciortino S., Testi L., 2011, A&A, 527, 77
- Rebull et al. (2000) Rebull L. M., Hillenbrand L. A., Strom S. E., Duncan D. K., Patten B. M., Pavlovsky C. M., Makidon R., Adams M. T., 2000, AJ, 119, 3026
- Rolleston et al. (1993) Rolleston W. R. J., Brown P. J. F., Dufton P. L., Fitzsimmons A., 1993, A&A, 270, 107
- Salpeter (1955) Salpeter E. E., 1955, ApJ, 121, 161
- Sana et al. (2006) Sana H., Rauw G., Nazé Y., Gosset E., Vreux J.-M., 2006, MNRAS, 372, 661
- Schmidt-Kaler (1982) Schmidt-Kaler K., 1982, in Landolt-Börnstein, Vol. 2b, p19, p31, p453
- Sharma et al. (2007) Sharma S., Pandey A. K., Ojha D. K., Chen W. P., Ghosh S. K., Bhatt B. C., Maheswar G., Sagar R., 2007, MNRAS, 380, 114
- Siess et al. (2000) Siess L., Dufour E., Forestini M., 2000, A&A, 358, 5931
- Skrutskie et al. (2006) Skrutskie M. F. et al., 2006, AJ, 131, 1163
- Soderblom et al. (2013) Soderblom D. R., Hillenbrand L. A., Jeffries R. D., Mamajek E. E., Naylor T., 2013, arXiv:1311.7024
- Sota et al. (2011) Sota A., Apellániz J. M., Walborn N. R., Alfaro E. J., Barbá R. H., Morrell N. I., Gamen R. C., Arias J. I., 2011, ApJS, 193, 24
- Sung & Bessell (1999) Sung H., Bessell M. S., 1999, MNRAS, 306, 361
- Sung & Bessell (2004) Sung H., Bessell M. S., 2004, AJ, 127, 1014
- Sung & Bessell (2010) Sung H., Bessell M. S., 2010, AJ, 140, 2070
- Sung et al. (2004) Sung H., Bessell M. S., Chun M.-Y., 2004, AJ, 128, 1684
- Sung et al. (2008) Sung H., Bessell M. S., Chun M.-Y., Karimov R., Ibrahimov M., 2008, AJ, 135, 441
- Sung et al. (1997) Sung H., Bessell M. S., Lee S.-W., 1997, AJ, 114, 2644
- Sung et al. (1998) Sung H., Bessell M. S., Lee S.-W., 1998, AJ, 115, 734
- Sung et al. (2000) Sung H., Chun M.-Y., Bessell M. S., 2000, AJ, 120, 333
- Sung et al. (2013b) Sung H., Lim B., Bessell M. S., Kim J. S., Hur H., Chun M.-Y., Park B.-G., 2013, JKAS, 46, 103 (Paper 0)
- Sung et al. (2013a) Sung H., Sana H., Bessell M. S., 2013, AJ, 145, 37
- Sung et al. (2009) Sung H., Stauffer J. R., Bessell M. S., 2009, AJ, 138, 1116
- Tapia et al. (1991) Tapia M., Costero R., Echevarría J., Roth M., 1991, MNRAS, 253, 649
- Thompson et al. (2004) Thompson M. A., White G. J., Morgan L. K., Miao J., Fridlund C. V. M., Huldtgren-White M., 2004, A&A, 414, 1017
- Torres-Dodgen & Weaver (1993) Torres A. V., Weaver W. B. 1993, PASP, 105, 693
- Uchida & Shibata (1985) Uchida Y., Shibata K., 1985, PASJ, 37, 515
- Vallenari et al. (1999) Vallenari A., Richichi A., Carraro G., Girardi L., 1999, A&A, 349, 825
- Walker & Hodge (1968) Walker G. A. H., Hodge S. M., 1968, PASP, 80, 290
- Walborn (2002) Walborn N. R., 2002, in Hot Star Workshop III: The Earliest Stages of Massive Star Birth., ed. P. A., Crowther, San Francisco, ASP Conf. Proc., 267, 111