Rotating Solar Jets in Simulations of Flux Emergence with Thermal Conduction
Abstract
We study the formation of coronal jets through numerical simulation of the emergence of a twisted magnetic flux rope into a pre-existing open magnetic field. Reconnection inside the emerging flux rope in addition to that between the emerging and pre-existing fields give rise to the violent eruption studied. The simulated event closely resembles the coronal jets ubiquitously observed by Hinode/XRT and demonstrates that heated plasma is driven into the extended atmosphere above. Thermal conduction implemented in the model allows us to qualitatively compare simulated and observed emission from such events. We find that untwisting field lines after the reconnection drive spinning outflows of plasma in the jet column. The Poynting flux in the simulated jet is dominated by the untwisting motions of the magnetic fields loaded with high-density plasma. The simulated jet is comprised of “spires” of untwisting field that are loaded with a mixture of cold and hot plasma and exhibit rotational motion of order 20 km/s and match contemporary observations.
1 Introduction
Coronal jets are hot columnar plasma ejecta that were first observed by the Yohkoh satellite (Shibata et al., 1992a). Subsequent (higher spatio-temporal resolution) observations with the SOHO, STEREO and SDO satellites have permitted study of these ubiquitous phenomena. Appearing as a collimated plasma ejecta from a low-lying loop-like structure they exhibit typical apparent speeds of 160 km/s, lifetimes of 10 minutes, heights of 50 Mm and cross-sectional widths of 8 Mm(Shimojo et al., 1996; Savcheva et al., 2007). The generally accepted view is that these high-speed coronal jets result from the reconnection of newly emerging flux system with the ambient (background) field. This process converts the magnetic energy in the system into thermal and kinetic energy for the plasma, heating it in the vicinity of the reconnection site, and producing the observed high-speed, hot, outflow of the plasma along the magnetic field lines.
Numerical simulations have been widely used to explore the physics behind coronal jets. Shibata et al. (1992b), Yokoyama & Shibata (1995) and Takasao et al. (2013) have studied the acceleration of jets through two-dimensional simulations of flux emergence - those simulations revealed fast outflows after the reconnection took place that were commensurate with the observations. Recent simulations have focused on the transition from a “standard” to “blowout” jet as characterized by Moore et al. (2010) by means of emerging a twisted flux rope into an open field (Archontis & Hood, 2013). Meantime, Moreno-Insertis & Galsgaard (2013) studied the onset mechanisms of the violent recurrent eruptions in the emerging region with a combination of tether-cutting reconnection, kink instability, and mini-CME eruptions. Both later studies produced eruptive jets with dynamic properties that were more broadly comparable with the observational studies. Here, in order to study the emission structure of the ejected plasma column, we setup experiments with field-aligned heat conduction which produces a more realistic distribution of the thermal energy along the field lines during the reconnection event and the jet.
2 Simulation Setup
We solve the ideal MHD equations with the implementation of heat conduction along the magnetic field lines within the Block Adaptive Tree Solar-wind Roe Upwind Scheme (BATS-R-US) that was developed at the University of Michigan (Powell et al., 1999; Tóth et al., 2012):
| (1) |
| (2) |
| (3) |
| (4) |
where , , , , , and are the density, velocity, total energy density, pressure, temperature, magnetic field and gravitational acceleration, respectively. denotes the coefficient of the thermal conductivity, with if and if (Linker et al., 2001), where , is the Spitzer conductivity. The correction of heat conduction coefficient at the transition-region temperatures allows us to expand the transition region artificially, in order to avoid the necessity of resolving the transition-region scale height of 1 km.
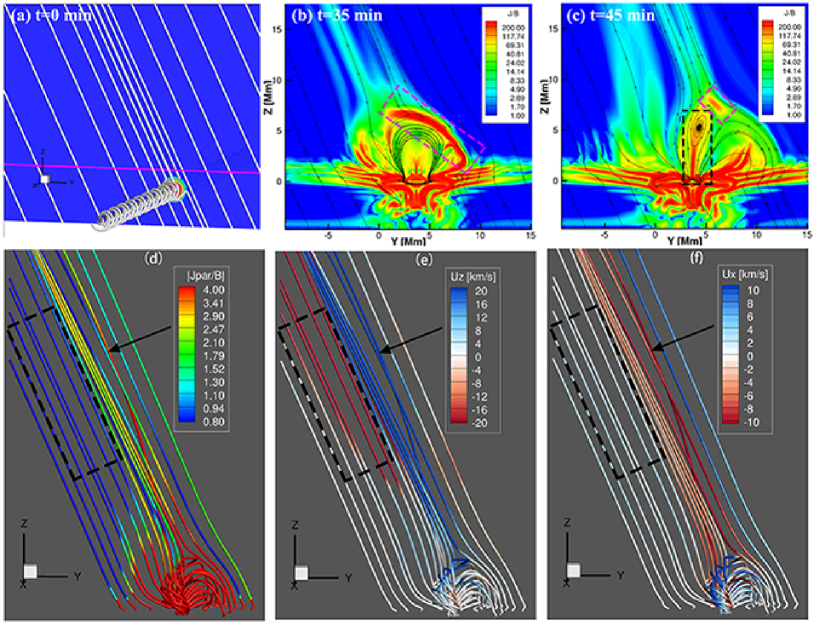
We carry out two simulations here, one with heat conduction and the other without. The domain of our simulation covers 49.5(X)49.5(Y)79.2(Z) Mm3, extending 4.9 Mm below the photosphere and 74.3 Mm into the corona with an initial background stratification of atmosphere in hydrostatic equilibrium, following Fan (2001). We then impose a uniform ambient magnetic field , where = 25∘ (Moreno-Insertis & Galsgaard, 2013). Within the ambient field, we insert a horizontal flux rope in the x direction at Z = -1.7 Mm, following (Fan, 2001) by , where kG, is the strength of the magnetic fields at the central axis of the rope, , is the rate of twist per unit length, and Mm is the radius of Gaussian decay. The initial rope is density-depleted in the central portion, and the thermal pressure inside the flux rope is modified to maintain the total pressure balance. Panel (a) of Fig. 1 shows the 3D structure of the initial flux rope placed closely to the photosphere (represented by the purple line). The direction of magnetic fields in the flux rope and ambient fields are initialized to be anti-parallel at the interface. After the initialization, the buoyant, kink-stable flux rope emerges at its middle section and interacts with the ambient (open) field.
3 Results
The initially-buoyant central part of the flux rope starts to rise immediately after being inserted into the convection zone, protrudes into the photosphere and expands further into the corona. Given the initial setup of the ambient field direction, the two flux systems are anti-parallel when they come into contact. This gives rise to the formation of a strong current sheet at the interface, as outlined by the purple rectangle in Panel (b) of Fig. 1. The continuous emergence of the flux rope leads to thinning of the current sheet which eventually results in reconnection, releasing the free energy in the current sheet. The reconnection heats up the plasma, which is accelerated outward by the magnetic tension of the reconnected field. The emitted outflow has been categorized as a “standard jet” by Moore et al. (2010). In addition to the interface current between the ambient fields and the anchored outer fields of the emerging flux rope, a strong current system develops in the central part of the emerging twisted flux rope - similar to the formation of current in other simulations without ambient fields (Manchester et al., 2004). The central core field of the flux rope, continues to rise and expand, forming another current sheet between the rising core and ambient fields. In Panel (c) of Fig. 1 the core current is represented by the black rectangle while that between the core and ambient field is purple. Reconnections take place in these areas of strong current. Underneath the core, the reconnection lifts up the core fields, as shown by the field lines in the black rectangle. At the interface, the reconnection opens up the anchored emerging field, with a portion of the emerging field being redirected upward, at speeds up to 180 km/s. The other portion of the emerging flux system collapses into the lower atmosphere, forming a set of post-eruption loops (see Panel (c) in Fig. 3). This process, jet ejection resulting from reconnection at the base of the erupting core and the interface of the two flux systems, was dubbed a “blowout jet” by Moore et al. (2010).
3.1 Mass ejection driven by the untwisting motion of the magnetic fields
Frequently the observed X-ray and EUV jets undulate (as originally noted by Shibata et al., 1992a). This property was explained as the movement of jets along helically twisted magnetic field lines that are accelerated by the force during the relaxation and propagation of the magnetic twist along the field lines. Canfield et al. (1996) also observed the spinning of H surges when ejected outward using Yohkoh data, and found that the spin is uniform along the surges and is in such a direction that is consistent with the relaxation of the magnetic twist stored in the emerging fields. The untwisting motion found both in jets and H surges (Cirtain et al., 2007; Schmieder et al., 2013; Moore et al., 2013) is interpreted as the propagation of MHD or torsional Alfvn waves transporting the stored twist and helicity in the closed magnetic fields into the open ambient field. Savcheva et al. (2007) carried out a statistical study of the properties of the transverse motion of the X-ray jets, and found speeds ranging from of 0 to 35 km/s.
We can examine the transverse motion in our simulated jet by analyzing the velocity and current structures. When reconnection takes place between the emerging twisted magnetic flux rope and the (uniform) open ambient fields, a new set of open field lines forms at the interface and the plasma has an outward speed (uz). The 3D structure of the reconnected field lines is illustrated in Panel (d)-(f) of Fig. 1 where the lines are colored to show which measures the magnetic twist (d), uz (e) and ux (f) respectively. The new open field, differs from the initial ambient open field in that they inherits magnetic twist from the erupting twisted flux rope during the reconnection, as shown by the braidinging rods identified with black arrows. Shedding magnetic twist onto the new field yields an uneven distribution of the magnetic twist along the field lines, as shown by the color in Panel (d) of Fig. 1. Panel (e) shows that both upward and downward vertical motions are present in the jet column. Interestingly, on comparing panels (d) and (e) we see that the upflowing plasma is associated with field lines of strong twist while the downflowing plasma (as outlined by the black dashed rectangles) is associated with much weaker twist. Meanwhile, panel (f) shows the ux of the field lines, which is the component of velocity perpendicular to the plane. The reversal of ux indicates that the ejecta is rotating in the more twisted field lines (shown in Panel (d)). In contrast, in the dashed rectangle in panels (d)-(f), the field lines that were produced by the reconnection during the standard jet phase (see panel (b) of Fig. 1) have already unwound themselves and possess much weaker magnetic twist (see panel (d)). On these field lines the plasma motion consists of a simple downward flow with a speed up to 66 km/s (see panel (e)), which corresponds to the speed under the combined effect of pressure gradient and gravity, with no apparent rotation (see panel (f)). The rotating upflow and non-rotating downflow of the plasma suggests that on the field lines with weak twist, the plasma falls back along the field lines under the effect of pressure gradient and gravitational acceleration. These are consistent with observations by Liu et al. (2009), where they reported untwisting motion with transverse oscillation velocities ranging from 26 to 151 km/s in the outward flow while the downward component exhibits no transverse motion.
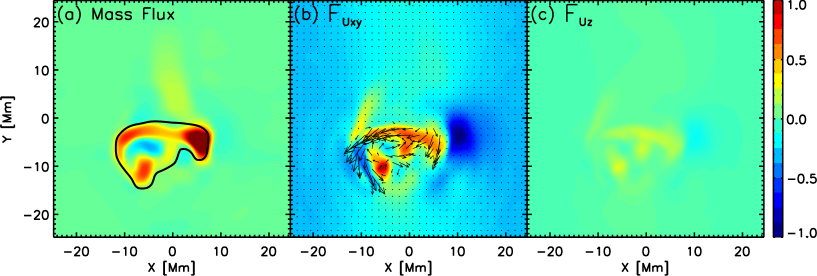
To study the relaxation of the reconnected field lines we examine the mass and energy transport in the corona during the eruption. We calculate the Poynting flux density associated with horizontal and vertical velocities at the plane Z = 30 Mm by:
| (5) | |||||
| (6) |
where u⟂x, u⟂y and u⟂z are the x-, y- and z-components of the velocity perpendicular to the magnetic field. Fig. 2 shows the mass flux density and Poynting flux density with horizontal and vertical flows at t = 59 min, with arrows in the panels (b) representing the horizontal velocity uxy. We find that the horizontal velocity clearly presents a pattern of rotating motion. Comparing the Poynting flux component F and F shows that it is the horizontal untwisting motion that dominates the energy flux into the corona. In addition, the mass transported into the corona consists of high-density plasma, shown by the contour lines of in panel (a), with mixed hot and cool temperatures - panel (a) in Fig. 3. And the mass ejection is accompanied by the Poynting energy flux associated with the horizontal untwisting motion, shown in panel (b) of Fig. 2.
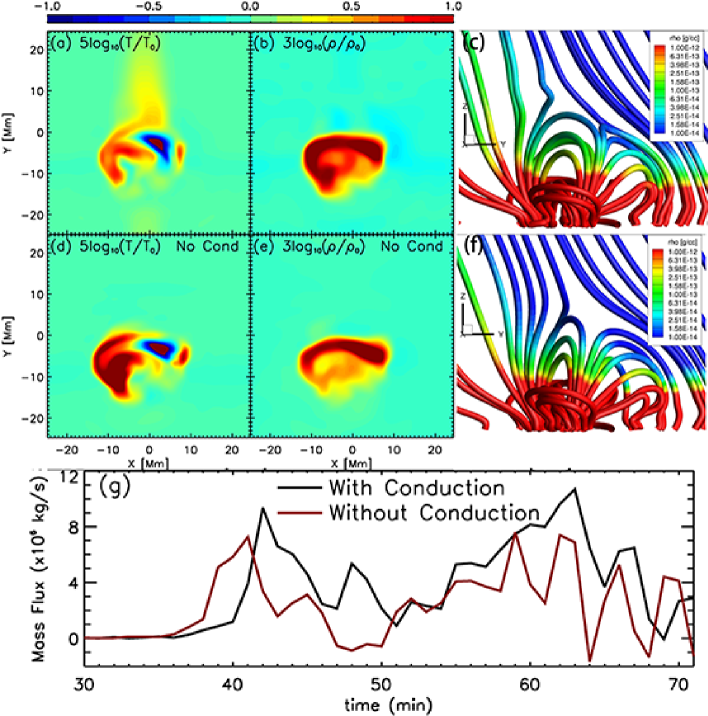
The mass ejection into the corona is strongly facilitated by the field-aligned thermal conduction, as shown in Fig. 3 comparing results from simulations with and without conduction. We find that the mass increase (3) at t = 59 min in the blowout jet is stronger with thermal conduction (Panel (b)). Also noticeable is that the temperature structure in the non-conduction run (Panel (d)) consists of more extreme components as compared to the case with conduction (Panel (a)). Panels (c) and (f) show the 3D structures of the post-eruption loops after the reconnection at t = 40 min, colored by the density. In these post-eruption loops, heat conduction redistributed the thermal energy from the reconnection site along the field lines, which drives more plasma upward into the corona. This upward mass transport gives rise to the observed stronger mass loading in the closed loops in the simulation with heat conduction (panel (c)). In panel (g), we calculate the mass flux across Z = 30 Mm plane in the corona, and find that multiple mass ejections occur during both simulations, with the first peak of mass flux (occurring at time t = 41 and 42 min for non-conduction and conduction run, respectively) associated with standard jet. Clearly, heat conduction greatly increases the mass ejection in the standard phase, from 1.46109 in the non-conduction run to 2.30109 kg in the conduction one. The total ejection of mass into the corona during the 71 min of simulation is 9.2109 kg in the case with heat conduction, as compared with only 5.8109 kg in the non-conduction one with more instances of negative mass flux.
3.2 Synthetic Emission
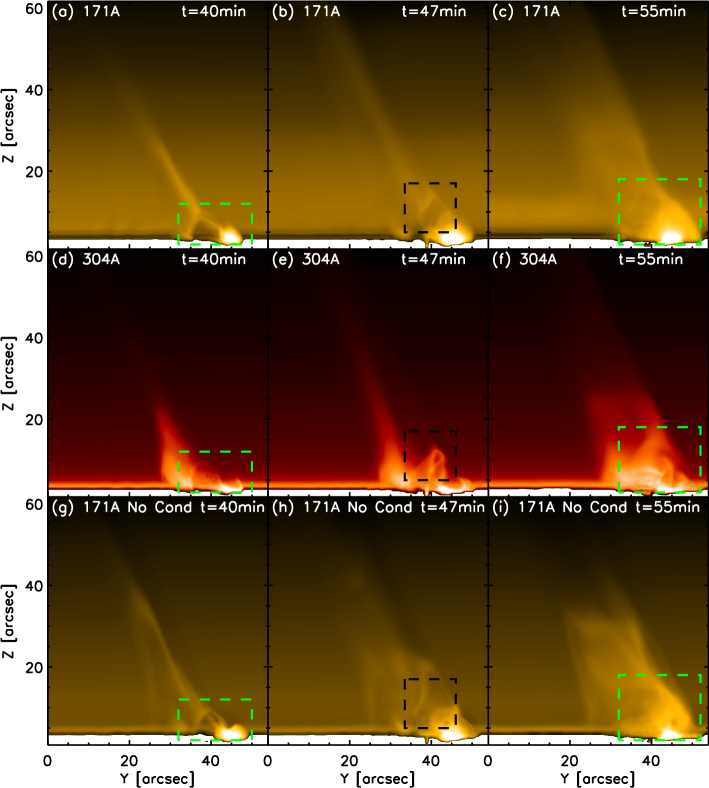
Mass ejected into the corona is guided outward by the magnetic field lines in simulations with field-aligned thermal conduction. To evaluate the observational effects of the mass ejection, we calculate the coronal and upper transition-region (Fe VIII dominated - 171Å) and transition-region (He II dominated - 304Å) synthetic emission using the Atmospheric Imaging Assembly (AIA) temperature response functions. Fig. 4 shows the emission at different times during the eruption, as viewed along the axial direction of the flux rope. In the coronal line - panels (a) and (c) - two jet “spires” form inside the column, one (Panel (a)) related to the reconnection between the ambient fields with the fields in the outer periphery of the emerging flux rope and another (Panel (c)) which forms when the core fields rise into the corona and reconnects with the open field. The apprearance of the second spire (Panel (c)) starts after the cool transition-region plasma is ejected into the lower corona, as outlined in the dashed square in Panel (b), and clearly at transition-region temperature shown in Panel (e). The jet column widens and brightens in both channels (panels (c) and (f)), grossly resembling the blowout jets reported in observations (Moore et al., 2010). In contrast, emission from the non-conduction simulation (panels (g-i)) clearly show that most of the massive material ejected during the eruption, outlined by the dashed square in Panel (h), cannot be levitated beyond the lower corona, and falls back after the eruption (see also the online movies). Interestingly, the post-eruption loops (green rectangles in Fig. 4), which are closed field lines resulting from the reconnection of the ambient fields and that in the emerging flux rope, appears brighter with heat conduction, both at t = 40 min during the standard phase (panels (a) and (g)), and at t = 55 min during the blowout jet (panels (c) and (i)).
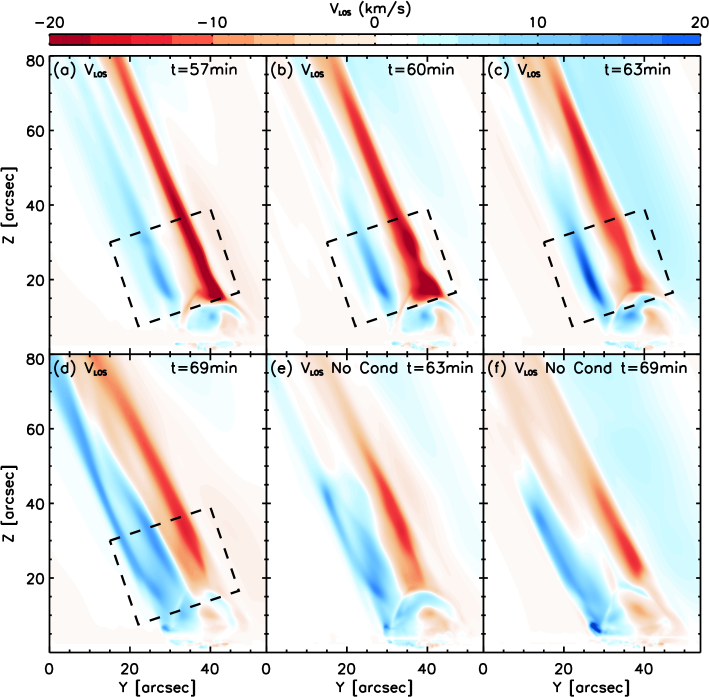
In Fig. 5 we calculate the 304Å intensity-weighted line-of-sight (LOS, x-direction) velocity VLOS and we see the reversal of sign in VLOS during the eruption which suggests that the jet column is rotating at a speed of 20 km/s that is consistent with observations (Liu et al., 2009). The swirling spire in panel (d) corresponds to braided magnetic fields loaded with dense plasma. The dashed rectangle in panels (a) through (d) identifies another ejection of cool plasma (panel (b)) in the blowout jet that is followed by the brightening and widening of the jet in the corona, which corresponds to the peak in mass flux at t = 63 min in Panel (g) of Fig. 3. At the corresponding times, the non-conduction simulation produces a similar reversal pattern in VLOS, seen in Panel (e) and (f). However, the mass loading does not delineate the field lines as well in this case without the inclusion of thermal conduction. Hence, the structure of intensity-weighted VLOS does not resemble the configuration of the magnetic fields.
4 Summary and Conclusions
We present numerical simulations of coronal jets which occur during the emergence of a twisted flux rope into an ambient open field. The emergence and expansion of the flux rope into the ambient field gives rise to magnetic reconnection at multiple locations during the phases of the eruption (Archontis & Hood, 2013; Moreno-Insertis & Galsgaard, 2013). We find that a mixture of hot and cold plasma is driven upward along the unwinding field lines during the eruption which produces the observed oscillatory transverse motion of the ejected jet spires, while the companion downward motion in the jet exhibits no rotation (Liu et al., 2009). The rotating upflowing motion and the simple downflow are correlated with the spatial distribution of magnetic twist in the jet column, with stronger magnetic twist in the rotating upflowing plasma (see Fig. 1). This strongly suggests that material is accelerated upward by the Lorentz force. Further, the rotating motion of the ejected plasm has the same sense as the unwinding reconnected field lines. Analysis of the energy flux in the system shows that the Poynting flux in the corona, dominated by the rotating motion of the structure, coincides with the outward mass transport of dense plasma. During the blowout jet, multiple ejecta take place low in the atmosphere, propagating along the twisted magnetic field lines after the reconnection between the rising core fields of the flux rope and the ambient fields, drive plasma of chromospheric and transition-region temperatures up into the corona by Lorentz force in addition to the hot reconnection outflow. Field-aligned thermal conduction efficiently distributes the energy release from the reconnection region into the lower atmopshere and promotes the ejection of dense plasma into the corona along the field lines, which is essential for comparing synthetic emission (Fig. 4 and 5) with observations. Without conduction, the ejected mass does not delineate field lines as well, and more importantly, falls back to the lower atmosphere due to lack of support, resulting in a reduced total mass ejection into the corona. The total mass in the corona is increased by a factor of 2 during the blowout jets. These jets with hot mass outflow into the corona, have been suggested as a source of heated mass of the solar wind (De Pontieu et al., 2007; McIntosh et al., 2010), will be studied in more detail in the future.
References
- Archontis & Hood (2013) Archontis, V. & Hood, A. W. 2013, ApJ, 769, L21
- Canfield et al. (1996) Canfield, R. C., Reardon, K. P., Leka, K. D., Shibata, K., Yokoyama, T., & Shimojo, M. 1996, ApJ, 464, 1016
- Cirtain et al. (2007) Cirtain, J. W., Golub, L., Lundquist, L., van Ballegooijen, A., Savcheva, A., Shimojo, M., DeLuca, E., Tsuneta, S., Sakao, T., Reeves, K., Weber, M., Kano, R., Narukage, N., & Shibasaki, K. 2007, Science, 318, 1580
- De Pontieu et al. (2007) De Pontieu, B., McIntosh, S. W., Carlsson, M., Hansteen, V. H., Tarbell, T. D., Schrijver, C. J., Title, A. M., Shine, R. A., Tsuneta, S., Katsukawa, Y., Ichimoto, K., Suematsu, Y., Shimizu, T., & Nagata, S. 2007, Science, 318, 1574
- Fan (2001) Fan, Y. 2001, ApJ, 554, L111
- Linker et al. (2001) Linker, J. A., Lionello, R., Mikić, Z., & Amari, T. 2001, J. Geophys. Res., 106, 25165
- Liu et al. (2009) Liu, W., Berger, T. E., Title, A. M., & Tarbell, T. D. 2009, ApJ, 707, L37
- Manchester et al. (2004) Manchester, IV, W., Gombosi, T., DeZeeuw, D., & Fan, Y. 2004, ApJ, 610, 588
- McIntosh et al. (2010) McIntosh, S. W., Innes, D. E., de Pontieu, B., & Leamon, R. J. 2010, A&A, 510, L2
- Moore et al. (2010) Moore, R. L., Cirtain, J. W., Sterling, A. C., & Falconer, D. A. 2010, ApJ, 720, 757
- Moore et al. (2013) Moore, R. L., Sterling, A. C., Falconer, D. A., & Robe, D. 2013, ApJ, 769, 134
- Moreno-Insertis & Galsgaard (2013) Moreno-Insertis, F. & Galsgaard, K. 2013, ApJ, 771, 20
- Powell et al. (1999) Powell, K. G., Roe, P. L., Linde, T. J., Gombosi, T. I., & de Zeeuw, D. L. 1999, Journal of Computational Physics, 154, 284
- Savcheva et al. (2007) Savcheva, A., Cirtain, J., Deluca, E. E., Lundquist, L. L., Golub, L., Weber, M., Shimojo, M., Shibasaki, K., Sakao, T., Narukage, N., Tsuneta, S., & Kano, R. 2007, PASJ, 59, 771
- Schmieder et al. (2013) Schmieder, B., Guo, Y., Moreno-Insertis, F., Aulanier, G., Yelles Chaouche, L., Nishizuka, N., Harra, L. K., Thalmann, J. K., Vargas Dominguez, S., & Liu, Y. 2013, A&A, 559, A1
- Shibata et al. (1992a) Shibata, K., Ishido, Y., Acton, L. W., Strong, K. T., Hirayama, T., Uchida, Y., McAllister, A. H., Matsumoto, R., Tsuneta, S., Shimizu, T., Hara, H., Sakurai, T., Ichimoto, K., Nishino, Y., & Ogawara, Y. 1992a, PASJ, 44, L173
- Shibata et al. (1992b) Shibata, K., Nozawa, S., & Matsumoto, R. 1992b, PASJ, 44, 265
- Shimojo et al. (1996) Shimojo, M., Hashimoto, S., Shibata, K., Hirayama, T., Hudson, H. S., & Acton, L. W. 1996, PASJ, 48, 123
- Takasao et al. (2013) Takasao, S., Isobe, H., & Shibata, K. 2013, PASJ, 65, 62
- Tóth et al. (2012) Tóth, G., van der Holst, B., Sokolov, I. V., De Zeeuw, D. L., Gombosi, T. I., Fang, F., Manchester, W. B., Meng, X., Najib, D., Powell, K. G., Stout, Q. F., Glocer, A., Ma, Y.-J., & Opher, M. 2012, Journal of Computational Physics, 231, 870
- Yokoyama & Shibata (1995) Yokoyama, T. & Shibata, K. 1995, Nature, 375, 42