The First Very Long Baseline Interferometry Image of 44 GHz Methanol Maser with the KVN and VERA Array (KaVA)
Abstract
We have carried out the first very long baseline interferometry (VLBI) imaging of 44 GHz class I methanol maser (70) associated with a millimeter core MM2 in a massive star-forming region IRAS 181511208 (catalog ) with KaVA (KVN and VERA Array), which is a newly combined array of KVN (Korean VLBI Network) and VERA (VLBI Exploration of Radio Astrometry). We have succeeded in imaging compact maser features with a synthesized beam size of 2.7 milliarcseconds 1.5 milliarcseconds (mas). These features are detected at a limited number of baselines within the length of shorter than 650 km corresponding to 100 M in the -coverage. The central velocity and the velocity width of the 44 GHz methanol maser are consistent with those of the quiescent gas rather than the outflow traced by the SiO thermal line. The minimum component size among the maser features is 5 mas 2 mas, which corresponds to the linear size of 15 AU 6 AU assuming a distance of 3 kpc. The brightness temperatures of these features range from to K, which are higher than estimated lower limit from a previous Very Large Array observation with the highest spatial resolution of 50 mas. The 44 GHz class I methanol maser in IRAS 181511208 (catalog ) is found to be associated with the MM2 core, which is thought to be less evolved than another millimeter core MM1 associated with the 6.7 GHz class II methanol maser.
1 Introduction
Methanol masers are known to be associated with star-forming regions. They are classified into two series of transitions called class I and class II (Menten, 1991). The class I and II methanol masers are considered to be excited by collisional (e.g., Cragg et al., 1992) and radiative pumping mechanisms (e.g., Sobolev & Deguchi, 1994; Cragg et al., 2005), respectively. In general, the class I methanol masers are likely to be associated with interacting regions between outflows and dense ambient gases in both low- and high-mass star-forming regions (e.g., Plambeck & Menten, 1990; Kalenskii et al., 2010). In contrast, the class II methanol masers are centrally concentrated around hot molecular cores, ultracompact (UC) Hii regions, OH masers and near-IR sources only in high-mass star-forming regions (e.g., Minier et al., 2003; Xu et al., 2008; Cyganowski et al., 2009; Breen et al., 2013), and possibly associated with disk-like structures and outflows around massive young stellar objects (e.g., Bartkiewicz et al., 2009; De Buizer, 2003). The class I and II methanol masers are complementary, and proper motion measurements of both maser lines are important to understand three-dimensional velocity structures of massive young stellar objects associated with jet/outflow/circumstellar disk systems. The class I and II methanol masers also hold a possibility of evolutionary tracers, but the relationship between them is still unclear (e.g., Ellingsen et al., 2007; Breen et al., 2010; Fontani et al., 2010).
The methanol maser at 6.7 GHz is one of the brightest maser species, and classified as the class II. The 6.7 GHz methanol-maser emitting sources have been widely investigated with radio interferometers such as ATCA and Very Large Array (VLA; e.g., Walsh et al., 1998), and very long baseline interferometry (VLBI; e.g., Sugiyama et al., 2008; Bartkiewicz et al., 2009). In contrast, the methanol maser at 44 GHz is representative of the class I methanol maser. Recently, the 44 GHz methanol masers have been extensively observed with single-dish radio telescopes and connected-element interferometers (e.g., Kurtz et al., 2004).
However, there is a difficulty in observing the class I methanol masers at high angular resolution. Previous VLBI observations of the class I methanol masers (the transition at 95.2 GHz: Lonsdale et al., 1998) have failed to detect any fringes for several strong class I methanol maser sources. As the results of the VLA observations (e.g., Slysh et al., 2002; Polushkin et al., 2009) and the negative results of Lonsdale et al. (1998), spot sizes of the class I methanol masers are expected to be between several milliarcseconds (mas) and 50 mas. Because of such extended structures, it has been recognized that the class I methanol masers are easily resolved out and hence, hardly detected with current VLBI instruments with a typical angular resolution of an order of 1 mas. Thus, there was no report for successful imaging of the class I methanol masers with VLBI to date.
Recently, a new VLBI instrument, Korean VLBI Network (KVN) has been constructed, which consists of three 21 m radio telescopes (Lee et al., 2014). Since the maximum baseline length of KVN is 500 km ( 3 mas at 44 GHz), it is the most suitable for conducting VLBI observations of the 44 GHz class I methanol masers (K. T. Kim et al., in preparation). To conduct high quality VLBI imaging, we extend the array by including four stations of VLBI Exploration of Radio Astrometry (VERA), which is another VLBI network in Japan.
In this Letter, we report on the first result of our VLBI imaging observation of the 44 GHz methanol maser line toward a star-forming region providing the highest angular resolution image. Our target source is one of the brightest 44 GHz methanol maser sources, IRAS 181511208 MM2 (catalog ). The distance of this source was estimated to be 3 kpc (Sridharan et al., 2005). This source was detected in the course of a KVN single-dish survey with a total flux density of about 500 Jy (K. T. Kim et al., in preparation), and hence, it is an ideal target to conduct high-resolution VLBI observations with KaVA (KVN and VERA Array), which is a newly combined array of KVN and VERA, with the longest baseline length of 2,300 km (Niinuma et al., 2014).
2 Observation and data reduction
A VLBI observation was carried out on 2012 April 8, from UT 17:10 to 23:53, with KaVA. Our target source was the 44 GHz methanol maser around IRAS 181511208 MM2 (catalog ). The phase tracking center position was 17m501 and 120748. NRAO 530 (catalog ) was observed as a delay and bandpass calibrator. A radio frequency of 44.069410 GHz (Tsunekawa et al. 1995;111111http://www.sci.u-toyama.ac.jp/phys/4ken/atlas/ Müller et al., 2004) is adopted in this Letter as the rest frequency of the CH3OH transition. Left-hand circular polarization (LHCP) signals were recorded with SONY DIR1000 recorders at a rate of 128 Mbit s-1 at all the stations. A correlation process was carried out with the Mitaka FX correlator in NAOJ, Mitaka (Chikada et al., 1991). The resultant auto-correlation and cross-correlation spectra consist of 1024 spectral points with a frequency spacing of 31.25 kHz ( 0.21 km s-1) in two 16 MHz bandwidth channels (1st CH: 44.05944.075 GHz, 2nd CH 44.07544.091 GHz in sky frequencies). In addition, both LHCP and RHCP (right-hand circular polarization) signals were recorded with Mark 5B recorders at a rate of 1024 Mbit s-1 at all the three KVN stations. They were correlated with the Distributed FX (DiFX; Deller et al., 2007, 2011) software correlator in KASI, Daejeon (Lee et al., 2014). Because we failed to record the data with the DIR1000 recorder at one of the KVN stations, Tamna, we instead employed the Mark 5B/DiFX data for the Tamna baselines and combined with the DIR1000/Mitaka FX data for the other baselines. In this Letter, we only employed two 16 MHz base-band signals of LHCP which are compatible with all the stations.
Data reduction was performed using the NRAO AIPS package by applying a standard procedure. At first, the two datasets, correlated with DiFX and Mitaka FX, were calibrated separately as follows. The delay and the delay-rate offset were calibrated using NRAO 530 (catalog ). Bandpass responses were also calibrated using NRAO 530 (catalog ). Amplitude calibrations were performed by a template method using the total-power spectra of the 44 GHz methanol maser in IRAS 181511208 MM2 (catalog ). Fringe-fitting was conducted for a reference maser component in IRAS 181511208 MM2 (catalog ) at a LSR (local standard of rest) velocity, , of 29.6 km s-1. Then, the datasets were combined after flagging a duplicated baseline in the data correlated with DiFX (the Yonsei-Ulsan baseline). In the self-calibration of the reference maser component, visibility based model-fittings and self-calibrations were iteratively conducted with the DIFMAP software package provided by Caltech to detect faint components from the limited -coverage data. The self-calibration solutions were applied to the other velocity channels of the maser data.
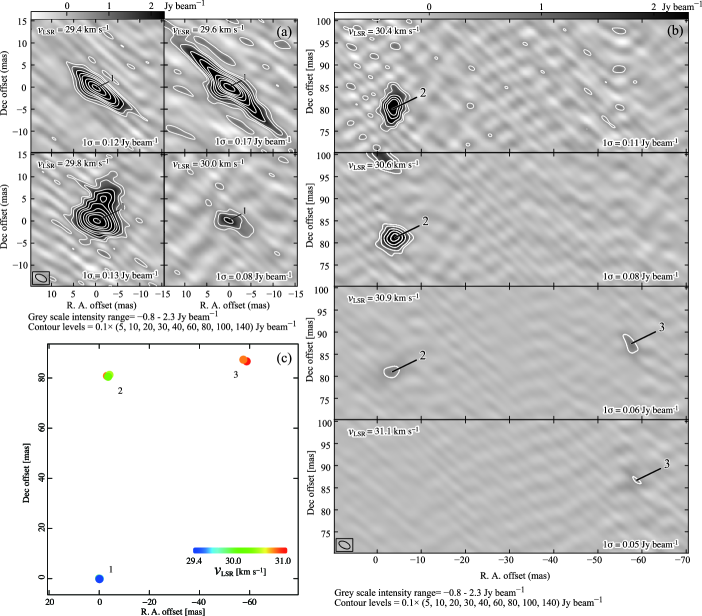
Synthesis imaging and deconvolution were performed using DIFMAP with uniform weighting. In this procedure, cut-off signal-to-noise ratios (S/N) of 714 were used to avoid possible effects of side-lobes. These cut-off values depend on dynamic ranges of each channel map. The rms noise levels in the deconvolved maps are 50200 mJy for IRAS 181511208 MM2 (catalog ). The synthesized beam sizes (FWHM) and the position angle were 2.7 mas 1.5 mas and 64∘, respectively. For all maser channels, maps were made with 8192 pixel 8192 pixel with a pixel size of 0.1 mas. Because of the insufficient velocity resolution and uncertainty in the clean process with our limited -coverage, maser structures in the images vary significantly from channel to channel (Figures 1 (a) and (b)). However, we regarded the three maser features identified in multi-channels within the synthesized beam size as real from a comparison between the visibility data and the convolution models. For example, the map of = 29.8 km s-1 in Figure 1 (a) shows a double-peaked structure in a north-south direction while the northern component at (2, 5) position was not detected in neighboring channels. Therefore, this northern component is not considered in the following results and discussions.
Finally, the maser positions, fluxes, and sizes were derived by Gaussian fitting to each maser component in the identified three maser features using the AIPS task JMFIT (Table 1). To avoid influences from complicated structures of weak components, we employed image pixels with the intensity greater than the 90 % of the peak intensity in the fitting. These maser components in the three maser features have S/N greater than 10 as seen in Table 1 and Figures 1 (a) and (b). These peak intensities in the deconvolved maps correspond to 1.48.3 times the cut-off S/N in the imaging process.
3 Results
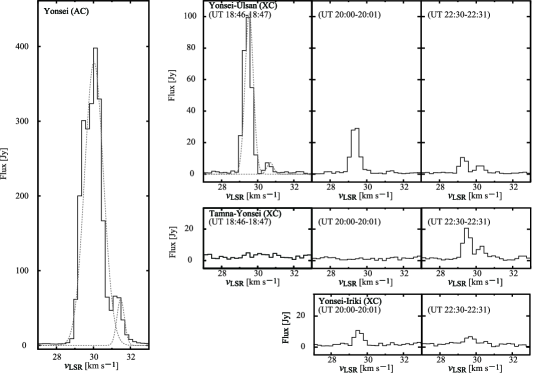
Figure 2 shows spectra of the 44 GHz methanol maser line obtained from our observation. A velocity width of the 44 GHz methanol maser line is around 3 km s-1. The weak red-shifted wing can be seen in the auto-correlation and cross-correlation spectra of the 44 GHz methanol maser (Figure 2). The peak flux density of the 44 GHz methanol maser is 379 22 Jy ( = 30.0 km s-1) in the auto-correlation spectrum. However, the maximum value of the cross-correlation spectrum is 102 1 Jy ( = 29.5 km s-1) in Yonsei-Ulsan baseline at UT 18:46 - 18:47 corresponding to 18 M and 19 M. Furthermore, except UT 17 h21 h of Yonsei - Ulsan baseline, peak flux densities of all the baselines are lower than 20 Jy. Thus, 27 % of the emission can be recovered with our VLBI images and the remaining 73 % is completely resolved out. This means that the 44 GHz methanol maser emission is not a compact point source but is dominated by a spatially extended structure.
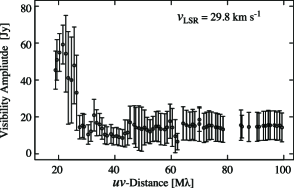
Such an extended structure of each feature is also shown in a -distance plot (Figure 3). This plot shows a variation of the visibility amplitude with the -distance for the systemic velocity of 29.8 km s-1. There is a decreasing trend of the amplitude within 27 M. The data points between 100330 M could not be detected in the fringe-fitting process. From Gaussian fitting to this plot along with the flux of auto-correlation spectrum, this trend suggests an extended maser component with a size of 4 mas. In addition, an increasing trend of the amplitude around 20 M suggests an elongated maser structure. The visibility data with the -lengths shorter than 20 M corresponds to the Yonsei-Ulsan baseline data at UT 17:16 - 18:48. In contrast, visibility amplitudes with the baseline lengths longer than 30 M have almost constant values of 15 Jy, suggesting a spatially compact structure.
Figure 1 (c) shows a spatial and velocity distribution of the 44 GHz methanol maser components. We found three maser features at different LSR velocities, denoted as 13. The absolute position of the maser component with = 29.4 km s-1 at (0, 0) position is derived from a fringe-rate mapping using the AIPS task FRMAP to be 17m4995, and 1208065. Thus, the 44 GHz methanol maser components are separated from the MM2 core position (Beuther et al., 2002a) by 0.4″and 11.5″.
As mentioned in Section 1, the 44 GHz methanol maser toward the IRAS 181511208 MM2 (catalog ) was detected in the course of KVN single-dish survey observations (K. T. Kim et al. in preparation). The single-dish observation was carried out toward the MM1 position, but the bright maser emission was found to be offset toward the southwest direction. According to the five-point cross-scan, the maser position was identified as the MM2 position with the accuracy of 5″. In our VLBI observation, we adopted the coordinates obtained from the single-dish survey. However, the coordinates obtained from the fringe-rate mapping was different from the single-dish result by 19″in a north-south direction, which is larger than the position error. The difference would be caused by a larger uncertainty in the fringe-rate mapping probably due to our insufficient -coverage which made the lines in the fringe-rate map roughly lie north-south directions. Even if the result of the fringe-rate mapping has the error of around 20″, the maser components detected in our observation are considered to belong to the MM2 region (see Figure 1 of Beuther et al., 2002a).
The radial velocities of these components range from to 31.1 km s-1. They are spread over an area of 60 mas 90 mas or 180 AU 270 AU at an assumed distance of 3 kpc (Sridharan et al., 2005). We cannot see significant velocity structure indicative of outflow, infall, or rotational motions.
The channel maps are shown in Figures 1 (a) and (b) for the 44 GHz methanol maser features. These maser structures are clearly more extended than the beam size. Their detailed properties are summarized in Table 1. The minimum size among the maser features is 4.98 ( 0.32) mas 2.16 (0.14) mas at of 30.9 km s-1, and the maximum brightness temperature is estimated to be K at of 29.6 km s-1 with an uncertainty in the absolute amplitude calibration around a few tens percent in addition to the fitting errors in Table 1.
4 Discussions
We have succeeded in detecting the 44 GHz methanol maser features around the IRAS 181511208 MM2 using newly organized KaVA. This is the first VLBI image of the class I methanol maser line at 44 GHz with the highest angular resolution of about 2 mas. Thanks to the high angular resolution, our results suggest that the 44 GHz methanol masers also have compact components with the sizes of a few tens of AU that are detectable by VLBI observations. With further observations of the class I methanol masers, it will be possible to provide three-dimensional velocity maps including radial velocities and proper motions as well as useful information to reveal the maser pumping mechanisms by comparing positions of multiple methanol maser lines at high spatial resolutions comparable with their spot sizes.
Previously, the highest resolution maps of the 44 GHz methanol masers were reported by Polushkin et al. (2009) for DR21(OH) (catalog ) using VLA with the resolution of 50 mas. They derived the linear sizes of the maser components to be 30480 AU. Slysh et al. (2002) also reported an upper limit of the maser component size of typically 50 mas, and their linear sizes are less than several hundred AU for five sources with VLA observation with an angular resolution of 100 mas. They showed the lower limit of the brightness temperature of 108 K for the strongest masers.
In our VLBI images, the minimum size among the maser features is estimated to be 24 mas, and the maximum brightness temperature is estimated to be 1010 K. This brightness temperature is much higher by two to four orders of magnitude than those estimated by previous lower resolution observations with VLA (e.g., Kogan & Slysh, 1998; Slysh et al., 2002). This is the first case determining the brightness temperature for the class I methanol masers with a sufficiently high spatial resolution, and consistent with the previous suggestions (e.g., Kogan & Slysh, 1998; Slysh et al., 2002).
As seen in Figure 2, the central velocity of the 44 GHz methanol maser agrees well with the ambient molecular gas traced by the H13CO+ thermal line (see Figure 1 of Sakai et al., 2010). Although it is proposed that the 44 GHz methanol maser is excited in the shocked molecular gas, both central velocity and its velocity range are not well correlated with the outflows traced by the SiO thermal line (see Figure 1 of Sakai et al., 2010). It is consistent with previous interpretations for other sources that the class I methanol maser at 95 GHz traces intermediate gas around interaction regions with protostellar outflows and ambient quiescent molecular gas (Plambeck & Menten, 1990).
In the IRAS 181511208 (catalog ) region, there are four millimeter massive cores labeled MM1 to MM4 (Beuther et al., 2002a) and two of them, MM1 and MM2, are associated with maser emissions (Beuther et al., 2002b). The 6.7 GHz class II methanol maser is detected toward MM1 (e.g., Beuther et al., 2002b), and the 22 GHz H2O maser is detected toward both MM1 (Valdettaro et al., 2001) and MM2 (Beuther et al., 2002b). These water/methanol maser lines and CO outflows (Marseille et al., 2008) are signposts of young stellar objects.
MM2 is considered as a chemically and dynamically less-evolved massive core than MM1 (e.g., Marseille et al., 2008; Sakai et al., 2010; Chen et al., 2011a; Ragan et al., 2012). MM1 is the birthplace of a massive young stellar object, possibly a pre-UC Hii region (e.g., Campbell et al., 2008; Marseille et al., 2008). In fact, around the MM1 position, radio continuum emissions are detected at 1.3 cm (Beuther et al., 2009; Hofner et al., 2011) and 3.6 cm (Carral et al., 1999), which are interpreted as shock-ionized flows/jets rather than UC Hii region (Hofner et al., 2011). In contrast, there is no detection of the 6.7 GHz methanol maser or radio continuum at cm-wavelength around the MM2 position.
Based on infrared observations, MM1 is also identified as a high-mass protostellar object with a point source of 8 m and 24 m emissions (Sakai et al., 2012), while MM2 is an dark source and associated with the 24 m emission (Sakai et al., 2012). data also show that MM1 and MM2 are associated with far-infrared point sources in 70500 m images, and MM1 is brighter than MM2 (Ragan et al., 2012). From the data, the masses of MM1 and MM2 cores are estimated to be 106 and 81 , respectively (Ragan et al., 2012).
All these characteristics suggest that the evolutionary stage of MM2 could be earlier than MM1. While we cannot rule out a possibility that MM2 does not host any massive young stellar objects judging from a non-detection of the 6.7 GHz class II methanol maser, it is a potential site of massive star formation with a sufficient mass of 81 . If this is the case, our result suggests that the 44 GHz class I methanol maser tends to appear in an earlier evolutionary phase than that traced by the 6.7 GHz class II methanol maser in the IRAS 181511208 (catalog ) region. It is consistently explained by one of the currently proposed scenarios of the evolutionary phase of massive star-forming regions that the class I methanol masers appear in a younger phase than the class II methanol masers (Ellingsen et al., 2007). However, other observational studies claimed another trend in which the class I methanol masers may be associated with more than one evolutionary stage (i.e., hot core and UC Hii) during formation of massive young stellar objects (Voronkov et al., 2010; Chen et al., 2011b; Cyganowski et al., 2012). One possible reason for such a discrepancy would be insufficient spatial resolutions employed in some of the survey observations with single-dish telescopes, which could be affected by the complicated structure of massive star-forming regions as found in our target source IRAS 181511208 (catalog ). Thus, further high-angular resolution observations of a much larger sample of methanol maser sources are required to discuss the evolutionary stage of massive young stellar objects with maser species. VLBI observations of the 44 GHz methanol masers will be powerful tools to provide their accurate positions and proper motions, which are crucial to identifying the powering source of masers.
References
- Bartkiewicz et al. (2009) Bartkiewicz, A., Szymczak, M., van Langevelde, H. J., Richards, A. M. S., & Pihlström, Y. M. 2009, A&A, 502, 155
- Beuther et al. (2002a) Beuther, H., Schilke, P., Menten, K. M., et al. 2002a, ApJ, 566, 945
- Beuther et al. (2002b) Beuther, H., Walsh, A., Schilke, P., et al. 2002b, A&A, 390, 289
- Beuther et al. (2009) Beuther, H., Walsh, A. J., & Longmore, S. N. 2009, ApJS, 184, 366
- Breen et al. (2010) Breen, S. L., Ellingsen, S. P., Caswell, J. L., & Lewis, B. E. 2010, MNRAS, 401, 2219
- Breen et al. (2013) Breen, S. L., Ellingsen, S. P., Contreras, Y., et al. 2013, MNRAS, 435, 524
- Campbell et al. (2008) Campbell, M. F., Sridharan, T. K., Beuther, H., et al. 2008, ApJ, 673, 954
- Carral et al. (1999) Carral, P., Kurtz, S., Rodríguez, L. F., et al. 1999, RMxAA, 35, 97
- Chen et al. (2011a) Chen, H.-R., Liu, S.-Y., Su, Y.-N., & Wang, M.-Y. 2011a, ApJ, 743, 196
- Chen et al. (2011b) Chen, X., Ellingsen, S. P., Shen, Z.-Q., Titmarsh, A., & Gan, C.-G. 2011b, ApJS, 196, 9
- Chikada et al. (1991) Chikada, Y., Kawaguchi, N., Inoue, M., et al. 1991, Frontiers of VLBI, ed. H. Hirabayashi, M. Inoue, & H. Kobayashi (Tokyo: Universal Academy Press), 79
- Cragg et al. (1992) Cragg, D. M., Johns, K. P., Godfrey, P. D., & Brown, R. D. 1992, MNRAS, 259, 203
- Cragg et al. (2005) Cragg, D. M., Sobolev, A. M., & Godfrey, P. D. 2005, MNRAS, 360, 533
- Cyganowski et al. (2009) Cyganowski, C. J., Brogan, C. L., Hunter, T. R., & Churchwell, E. 2009, ApJ, 702, 1615
- Cyganowski et al. (2012) Cyganowski, C. J., Brogan, C. L., Hunter, T. R., et al. 2012, ApJ, 760, L20
- De Buizer (2003) De Buizer, J. M. 2003, MNRAS, 341, 277
- Deller et al. (2011) Deller, A. T., Brisken, W. F., Phillips, C. J., et al. 2011, PASP, 123, 275
- Deller et al. (2007) Deller, A. T., Tingay, S. J., Bailes, M., & West, C. 2007, PASP, 119, 318
- Ellingsen et al. (2007) Ellingsen, S. P., Voronkov, M. A., Cragg, D. M., et al. 2007, in IAU Symp. 242, Astrophysical Masers and Their Environments, ed. J. M. Chapman & W. A. Baan (Cambridge: Cambridge Univ. Press), 213
- Fontani et al. (2010) Fontani, F., Cesaroni, R., & Furuya, R. S. 2010, A&A, 517, A56
- Hofner et al. (2011) Hofner, P., Kurtz, S., Ellingsen, S. P., et al. 2011, ApJ, 739, L17
- Kalenskii et al. (2010) Kalenskii, S. V., Johansson, L. E. B., Bergman, P., et al. 2010, MNRAS, 405, 613
- Kogan & Slysh (1998) Kogan, L., & Slysh, V. 1998, ApJ, 497, 800
- Kurtz et al. (2004) Kurtz, S., Hofner, P., & Álvarez, C. V. 2004, ApJS, 155, 149
- Lee et al. (2014) Lee, S.-S., Petrov, L., Byun, D.-Y, et al. 2014, AJ, 147, 77
- Lonsdale et al. (1998) Lonsdale, C. J., Doeleman, S. S., Liechti, S., et al. 1998, BAAS, 30, 1355
- Marseille et al. (2008) Marseille, M., Bontemps, S., Herpin, F., van der Tak, F. F. S., & Purcell, C. R. 2008, A&A, 488, 579
- Menten (1991) Menten, K. 1991, in ASP Conf. Ser. 16, Atoms, Ions and Molecules: New Results in Spectral Line Astrophysics, ed. A. D. Haschick & P. T. P. Ho (San Francisco, CA: ASP), 119
- Minier et al. (2003) Minier, V., Ellingsen, S. P., Norris, R. P., & Booth, R. S. 2003, A&A, 403, 1095
- Müller et al. (2004) Müller, H. S. P., Menten, K. M., Mäder, H. 2004, A&A, 428, 1019
- Niinuma et al. (2014) Niinuma, K., Lee, S.-S., Kino, M., et al., PASJ, submitted
- Plambeck & Menten (1990) Plambeck, R. L., & Menten, K. M. 1990, ApJ, 364, 555
- Polushkin et al. (2009) Polushkin, S. V., Val’tts, I. E., & Slysh, V. I. 2009, ARep, 53, 113
- Ragan et al. (2012) Ragan, S., Henning, T., Krause, O., et al. 2012, A&A, 547, A49
- Sakai et al. (2012) Sakai, T., Sakai, N., Furuya, K., et al. 2012, ApJ, 747, 140
- Sakai et al. (2010) Sakai, T., Sakai, N., Hirota, T., & Yamamoto, S. 2010, ApJ, 714, 1658
- Slysh et al. (2002) Slysh, V. I., Val’tts, I. E., & Kalenskii, S. V. 2002, in IAU Symp. 206, Cosmic Masers: From Protostars to Black Holes, ed. V. Migenes & M. J. Reid (San Francisco, CA: ASP), 199
- Sobolev & Deguchi (1994) Sobolev, A. M., & Deguchi, S. 1994, A&A, 291, 569
- Sridharan et al. (2005) Sridharan, T. K., Beuther, H., Saito, M., Wyrowski, F., & Schilke, P. 2005, ApJ, 634, L57
- Sugiyama et al. (2008) Sugiyama, K., Fujisawa, K., Doi, A., et al. 2008, PASJ, 60, 23
- Tsunekawa et al. (1995) Tsunekawa, S., Ukai, T., Toyama, A., & Takagi, K. 1995, Toyama University. Microwave Frequencies of the CH3OH Molecule in the Frequency Range from 7 to 200 GHz, report for the Grant-in-aid for Scientific Research on Priority Areas (Interstellar Matter, 19911994) of the Ministry of Education, Science, and Culture, Japan (Toyama: Toyama Univ.)
- Valdettaro et al. (2001) Valdettaro, R., Palla, F., Brand, J., et al. 2001, A&A, 368, 845
- Voronkov et al. (2010) Voronkov, M. A., Caswell, J. L., Ellingsen, S. P., & Sobolev, A. M. 2010, MNRAS, 405, 2471
- Walsh et al. (1998) Walsh, A. J., Burton, M. G., Hyland, A. R., & Robinson, G. 1998, MNRAS, 301, 640
- Xu et al. (2008) Xu, Y., Li, J. J., Hachisuka, K., et al. 2008, A&A, 485, 729
| Feature | Peak Intensity | Component size | P. A. | ||||||||||
|---|---|---|---|---|---|---|---|---|---|---|---|---|---|
| ID | [km s-1] | [mas] | [mas] | [Jy beam-1] | [mas] | [∘] | [K108] | ||||||
| 1 | 29.4 | 0.10 ( | 3) | 0.19 ( | 2) | 10.74 ( | 12) | 7.01 2.51 ( | 8, 3) | 55.1 ( | 4) | 67.5 ( | 8) |
| 1 | 29.6 | 0.07 ( | 2) | 0.07 ( | 2) | 16.33 ( | 17) | 6.03 2.52 ( | 6, 3) | 59.9 ( | 4) | 103 ( | 1) |
| 1 | 29.8 | 0.27 ( | 2) | 0.03 ( | 1) | 14.90 ( | 12) | 5.61 3.13 ( | 5, 3) | 65.8 ( | 5) | 93.7 ( | 8) |
| 1 | 30.0 | 0.09 ( | 8) | 0.12 ( | 5) | 2.30 ( | 9) | 5.10 2.29 ( | 19, 9) | 63.4 ( | 17) | 14.4 ( | 5) |
| 2 | 30.4 | 3.53 ( | 3) | 80.52 ( | 5) | 5.43 ( | 10) | 6.39 3.73 ( | 12, 7) | 162.3 ( | 13) | 34.2 ( | 6) |
| 2 | 30.6 | 4.06 ( | 3) | 81.25 ( | 3) | 4.49 ( | 8) | 4.96 3.91 ( | 8, 7) | 120.8 ( | 29) | 28.2 ( | 5) |
| 2 | 30.9 | 3.06 ( | 14) | 80.82 ( | 10) | 0.74 ( | 6) | 4.30 3.15 ( | 32, 24) | 82.8 ( | 96) | 4.68 ( | 35) |
| 3 | 30.9 | 57.50 ( | 9) | 87.32 ( | 12) | 0.87 ( | 6) | 4.98 2.16 ( | 32, 14) | 32.5 ( | 28) | 5.46 ( | 35) |
| 3 | 31.1 | 58.82 ( | 21) | 86.62 ( | 18) | 0.55 ( | 1) | 6.70 2.14 ( | 62, 20) | 50.3 ( | 27) | 3.45 ( | 3) |