Early-type galaxies in the Chandra COSMOS Survey
Abstract
We study a sample of 69 X-ray detected Early Type Galaxies (ETGs), selected from the Chandra COSMOS survey, to explore the relation between the X-ray luminosity of hot gaseous halos (LX,gas) and the integrated stellar luminosity (LK) of the galaxies, in a range of redshift extending out to z=1.5. In the local universe a tight steep relationship has been stablished between these two quantities () suggesting the presence of largely virialized halos in X-ray luminous systems. We use well established relations from the study of local universe ETGs, together with the expected evolution of the X-ray emission, to subtract the contribution of low mass X-ray binary populations (LMXBs) from the X-ray luminosity of our sample. Our selection minimizes the presence of active galactic nuclei (AGN), yielding a sample representative of normal passive COSMOS ETGs; therefore the resulting luminosity should be representative of gaseous halos, although we cannot exclude other sources such as obscured AGN, or enhanced X-ray emission connected with embedded star formation in the higher z galaxies. We find that most of the galaxies with estimated L1042 erg s-1 and z0.55 follow the relation of local universe ETGs. For these galaxies, the gravitational mass can be estimated with a certain degree of confidence from the local virial relation. However, the more luminous (101043.5 erg s-1) and distant galaxies present significantly larger scatter; these galaxies also tend to have younger stellar ages. The divergence from the local relation in these galaxies implies significantly enhanced X-ray emission, up to a factor of 100 larger than predicted from the local relation. We discuss the implications of this result for the presence of hidden AGN, and the evolution of hot halos, in the presence of nuclear and star formation feedback.
1 Introduction
The discovery of widespread diffuse X-ray emission from early type galaxies (elliptical and SO, ETG hereafter) with the Einstein X-ray Observatory (Trinchieri & Fabbiano 1985; Forman et al. 1985) spurred speculations on the nature of this emission and on the amount that could be ascribed to gaseous halos. The latter, if in hydrostatic equilibrium, would provide a unique way for measuring the total gravitational mass of these galaxies. However, with the earlier data, it was virtually impossible to discriminate between gaseous and non-gaseous emission in these galaxies. These observational limitations left the field open to a lively discussion, aimed at understanding the nature of the X-ray emission, and how this emission could constrain physical models of halo evolution, including SNIa and nuclear feedback and interaction with cluster and group hot media (see e.g., Fabbiano 1989; Canizares et al. 1987; Ciotti et al. 1991; David et al. 1991; White & Sarazin 1991; Matthew & Brighenti 2003; Ciotti et al. 2010).
With the high angular resolution and sensitivity of Chandra, coupled with the spectral capabilities of the ACIS detector (Garmire et al. 2003), the study of the X-ray emission of ETGs in the local universe has taken a substantial leap forward. The presence of populations of low-mass X-ray binaries (LMXBs, Trinchieri & Fabbiano 1985) has been definitely proven, and these LMXBs have been detected and studied in several ETGs, to distances of several ten megaparsecs (see review by Fabbiano 2006). Using Chandra observations, and the information gathered from deep studies of nearby ETGs, which established the LMXB luminosity function (e.g., Kim & Fabbiano 2004; Gilfanov 2004; Kim et al. 2009), Boroson, Kim and Fabbiano (2011; BKF), were able to estimate accurately the gaseous component of the X-ray luminosity (LX,Gas) of 30 ETGs within a distance of 32 Mpc and establish scaling relations for this emission.
Kim & Fabbiano (2013; KF13) took this approach a step further by establishing that L, where MTotal is the total mass obtained from kinematic measurements of globular clusters and planetary nebulae (located within 5 effective radii from the center) for a small sample of 14 ETGs. This scaling relation, together with the steep L of BKF suggest that the hot gas is virialized, at least for L erg s-1. If this result holds in general for ETGs, we may have finally a way to measure the total mass of these galaxies.
Not many studies of X-ray selected ETGs have been performed beyond the local Universe. While Tzanavaris & Georgantopoulos (2008) mainly focused on the X-ray luminosity function of ETGs in the Chandra Deep Field North, finding no evolution out to , Lehmer et al. (2007) and Danielson et al. (2012) studied the X-ray (using both detections and stacking analysis) and multiwavelength properties of optically selected ETGs in the Chandra Deep Field South. The Chandra Deep Fields works consistently find that the mean of L⊙ ETGs remains equal or mildly increases over z=0-0.7 (Lehmer et al. 2007), and that the soft X-ray luminosity/B-band luminosity evolves mildly as keV)/ since (Danielson et al. 2012). This was taken as evidence for some heating mechanism preventing the hot gas from cooling, and this mechanism was found to be consistent with mechanical heating from radio AGNs. Indeed, a number of processes, in addition to radiative cooling and radio AGN heating, are expected to contribute to the evolution of the hot gas: a continuous, time decreasing, rate of mass input from stellar winds and energy input from Type Ia supernovae, periodic heating from nuclear radiative outbursts and AGN winds, and galaxy interactions (to quote those expected to be most relevant; e.g., Kim & Pellegrini 2012). To quantify the role of each of these processes requires detailed, and self-consistent, hydrodynamical simulations of the gas evolution, as for example those made by Ciotti et al. (2010). Subsequently Pellegrini et al. (2012) derived expected observational properties for the latter models, finding that, outside nuclear outbursts, the gas keeps at a roughly constant average T, and shows a mild secular decline of Lx, in agreement with current observations.
Jones et al. (2013), starting from a K-band limited and selected sample of 3500 galaxies in the COSMOS field at 0.52, performed X-ray stacking analysis using the Chandra data available in the field (see below) dividing the sources according to galaxy types and redshift bins. For older galaxies they find that nuclear activity or hot gas dominate the X-ray emission, and a slight increase in X-ray luminosity with redshift.
The COSMOS survey (Scoville et al. 2007), resulting in a multi-wavelength characterization of over 1.5 million galaxies at redshift up to 5 in 2 deg2 of the sky, and with Chandra X-ray coverage (C-COSMOS, Elvis et al. 2009) over 0.9 deg2, gives us the means to select X-ray ETGs extending local studies to higher redshifts and explore the redshift evolution of hot halos. The small area covered by the deep fields allows to probe higher redshifts and fainter sources, while the larger area of COSMOS is optimal for this study detecting brighter and more rare sources.
In this paper, we use the sample of ETGs detected in X-rays in the C-COSMOS survey (Section 2), to expand the ETGs “local sample”111We will call hereafter ETGs “local sample” the sample including the 30 ETGs from BKF plus 8 ETGs added to this sample subsequently by KF13. to higher redshifts, and explore if the BKF relation is valid at higher redshift and test whether there is evolution of the scaling relation with redshift. We subtract the LMXB contribution from their X-ray luminosity (Section 3.2), obtaining an estimate of the LX,Gas plus an unknown contribution of nuclear emission, which we try to constrain using the observational properties of the sample. The resulting LX-LK relation is examined in Section 4, as a function of several inferred and observational properties of the ETGs (Section 3). This relation is consistent with the LX,Gas - LK relation derived in the local universe (BKF; KF13) for sources with X-ray luminosity L 1042 erg s-1, suggesting that the hot gas in these galaxies may be virialized as well. We define a local strip and analyze the outliers. For the sources in the local strip, we estimate their total masses using the KF13 relation (Section 5).
We assume a cosmology with H0 = 71 km s-1 Mpc-1, = 0.27 and = 0.73. The AB magnitude system is used in this paper if not otherwise stated.
2 Sample Selection
The galaxies in our sample were selected from the C-COSMOS X-ray source identification catalog (Civano et al. 2012) to have a rest frame X-ray luminosity of L erg s-1 in the 0.5-10 keV band (using the spectral assumptions in Elvis et al. 2009) and to be classified as elliptical or S0 from their optical to near-infrared spectral energy distribution (SED). The SED identification is from the most recent version of the photometric catalog of Ilbert et al. (2009), which includes the near-infrared photometry from the Ultra Deep Survey with the VISTA telescope (Ultra-VISTA; McCracken et al. 2013). For the SED fit, Ilbert et al. (2009) used 7 elliptical galaxy templates (see their Figure 1) with ages from 2 to 13 Gyr (Polletta et al. 2007). Ilbert et al. (2010) derived galaxy properties (mass, age and star formation rate) for the galaxies in the same COSMOS sample. We also use these properties here. More details on how the properties were derived can be found in their paper. Briefly, the SED templates were generated with the stellar population synthesis package developed by Bruzual & Charlot (2003), assuming an initial mass function from Chabrier (2003) and an exponentially declining star formation history.
Our sample includes 69 sources; we will refer to it as the X-ray ETG sample hereafter. The C-COSMOS survey sensitivity limit 1.110-15 (at 20% completeness, dashed line in Figure 1; Puccetti et al. 2009) in the 0.5-10 keV band is such that at z=0.8 the minimum detectable X-ray luminosity is 1042.3 erg s-1. The luminosities in the 0.5-10 keV band (computed assuming a model with Galactic column density NH,Gal=2.61020cm-2, Kalberla et al. 2005), and a power law slope =1.4 222This slope value is used here for the sole purpose of comparing the luminosity of the sample with the C-COSMOS survey limit. as used in the C-COSMOS catalog) for the 69 X-ray ETGs are plotted in Figure 1. The flux limit applied to the sample is consistent with the signal-to-noise ratio thresholds chosen by Puccetti et al. (2009), on the basis of extensive simulations, to avoid the Eddington bias in the computation of the number counts of the entire C-COSMOS sample. Thus, Eddington bias is not affecting this sample and analysis.
As a comparison sample, we selected from the COSMOS photometric catalog, covering the full 2 deg2 of the COSMOS field, all the elliptical and S0 galaxies with reliable Ultra-VISTA photometry in the J and K band and photometric redshifts. To be consistent with the X-ray selection, we consider only the sources in the C-COSMOS area. The comparison sample comprises 6600 galaxies and we will refer to it as COSMOS ETG sample.

3 Sample properties
3.1 Optical properties
Of the 69 galaxies in the X-ray ETG sample, 53 have spectroscopic redshifts. For the remaining 16 galaxies, we used the available photometric redshifts reported in the C-COSMOS identification catalog (Civano et al. 2012, Salvato et al. 2011). Given the high quality of the photometry available for the sources in the COSMOS field (see Salvato et al. 2011), we are confident that we can use photometric redshifts when spectroscopic ones are not available. the Although not uniform, an optical spectroscopic classification is available for the C-COSMOS sources (see Civano et al. 2012 for the details on observing programs). According to the spectroscopic classification, our sample includes: 24 absorption line galaxies (ALG) and 29 narrow emission line (NL) objects. Moreover, using standard diagnostic diagrams (Bongiorno et al. 2010), we find that of the 29 NL sources, 5 are classified as NL active galactic nuclei (i.e. Type 2 AGN), 7 as star forming galaxies, while 17 spectra remain unclassified.
The K band luminosity was computed from the Ultra-VISTA K-band aperture magnitude of the COSMOS photometric catalog. We applied aperture corrections to derive the total magnitude using the appropriate extension parameter available in the COSMOS catalog (called ext below), which was computed from the FWHM measured for all the COSMOS extended sources in the Hubble ACS data (Leauthaud et al. 2007). To evaluate rest frame K-band luminosities, we assumed a spectral shape of the type with =, where J and K are taken from the COSMOS catalog. The luminosity expressed in solar luminosity is then
| (1) |
where K is the AB magnitude from the COSMOS photometric catalog, ext is the aperture correction parameter, is the redshift, is the luminosity distance in parsec.
In Figure 2, the K-band luminosity histograms for the X-ray ETGs (solid line), the comparison sample of COSMOS ETGs (dashed line) and the BKF local sample are plotted. Given the X-ray flux limit of the C-COSMOS survey, the X-ray ETGs have luminosities consistent with the high luminosity tail of the entire ETG population. Note that the luminosity threshold is a function of redshift because of the uniform magnitude limit of the Ultra-VISTA COSMOS survey (Ks 24, McCracken et al. 2013). The main peak of the K-band luminosity histogram for X-ray detected and undetected ETGs is consistent with the distribution of the local sample, although slightly shifted to higher luminosities.

In Figure 3, the age and stellar mass (Ilbert et al. 2010) of the X-ray ETGs are compared to the values of the entire COSMOS ETG population. The age was derived from Bruzual & Charlot (2003) template fitting. Given the possible errors on age estimation, we will later divide the sources in 3 wide age bins (5 Gyrs, 5–9 Gyrs and 9 Gyrs). The age spread of the X-ray ETGs is representative of the entire ETG sample, although the X-ray detected sources present a larger fraction of old galaxies with ages 6 Gyrs, relative to the entire population. As can be seen in Figures 2 and 3, X-ray ETGs are among the most massive COSMOS ETGs. A two sample Kolmogorov-Smirnov (K-S) test demonstrates that the X-ray ETGs and the COSMOS ETGs are not drawn from the same parent distributions of luminosity, age, and mass distributions with p-values of , , and , respectively.
Figure 4 compares the specific star formation rates (sSFRs) of X-ray ETGs with those of COSMOS ETGs and with a sample of 130,000 spiral galaxies selected from the same Ilbert et al. (2010) catalog using SED classification. The X-ray ETGs have consistent sSFR values with the COSMOS ETGs. About 95% of the spiral galaxies have (sSFR)-10.5 while only 20% of the COSMOS ETGs have similar sSFR and only one X-ray ETG has such high value. The K-S test result shows that X-ray ETGs and COSMOS ETGs could be drawn from different parent sample though with a lower confidence than the above tests on mass, age and luminosity (K-S p-value = 610-5). On the contrary, we can state with high confidence that both X-ray ETG and COSMOS ETG sSFR are not sampled from the distribution of spiral galaxy sSFR (K-S p-value 110-54). The sSFR of the X-ray ETGs is in the regime where Ilbert et al. (2010) defines galaxies as quiescent. Even if there is SF in ETGs (as most likely happens in young ETGs), their sSRF is about 1000 times lower than typical spiral galaxies (Figure 4).
The properties (luminosity, mass, star formation rate and age) of the COSMOS ETGs are in agreement with those reported by Moresco et al. (2013) for a sample of ETGs selected using multiple criteria including color-color diagrams, spectra, star formation rate and SED classification. Overall, masses and luminosities are in agreement with those of the K-selected elliptical galaxies presented by Jones et al. (2013) selected from a small area of the COSMOS field, for which individual X-ray detection is not available but only a stacked signal.


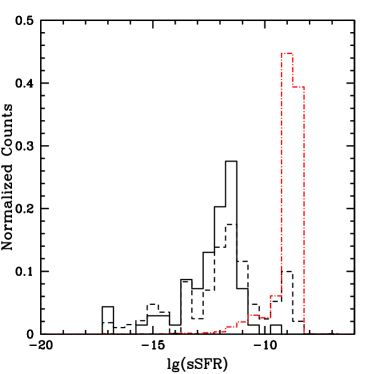
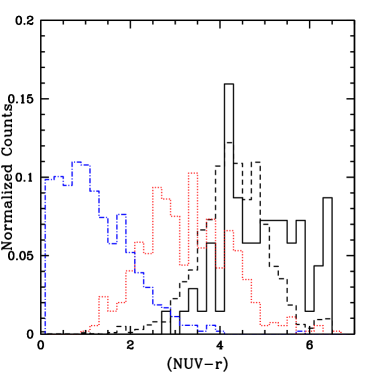
Figure 5 shows the (NUV–r) rest-frame color distribution as used by Ilbert et al. (2010) to classify galaxies according to their current and past star formation activity: quiescent galaxies with (NUV–r)3.5, intermediate with (NUV–r)= 1.2 to 3.5, and high activity galaxies with (NUV–r) 1.2. The rest frame color is reported in the photometric catalog of lbert et al. (2010). Here, we compare the distributions of the X-ray ETGs, the COSMOS ETGs and also spectroscopically and photometrically identified X-ray detected COSMOS Type 1 and Type 2 AGN (Lusso et al. 2010, 2011, 2012). X-ray ETGs have the reddest, highest (NUV–r) color and show an excess of extremely red galaxies with (NUV–r)5 with respect to the X-ray undetected population. Type 1 AGN (538 sources) have the colors of high activity galaxies, Type 2 AGN (546 sources) lie in an intermediate region with a tail of the distribution overlapping with the X-ray ETG distribution. When looking at the spectroscopically identified Type 2 AGN only, the distribution becomes narrower showing less overlap with the ETG sample. This effect is due to the degeneracy of some obscured AGN templates with galaxy templates. This color diagnostic suggests very little or no contamination from Type 2 and Type 1 AGN, respectively, is expected to affect the X-ray ETG sample.
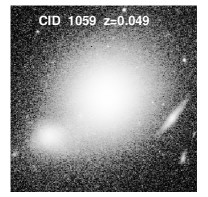
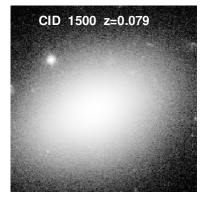
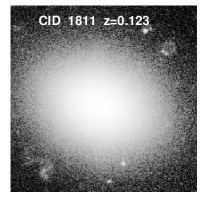
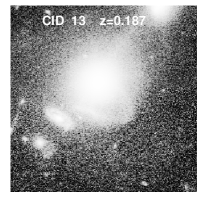
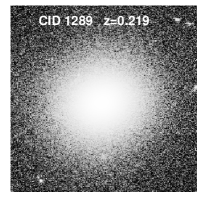
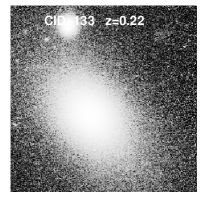
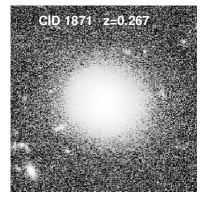
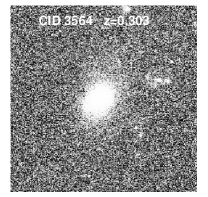
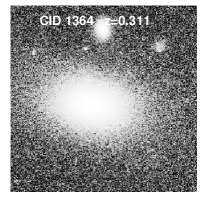
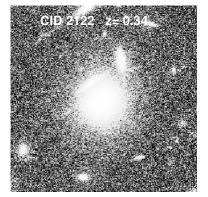
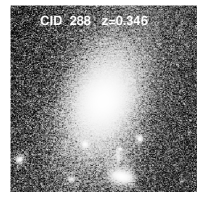
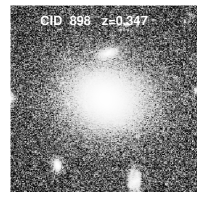
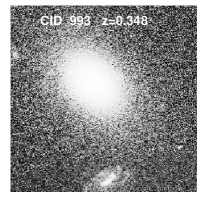
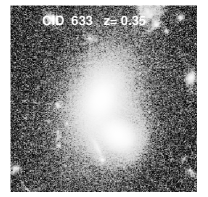
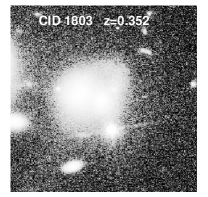
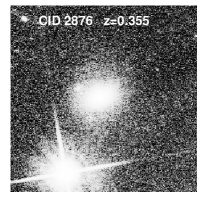
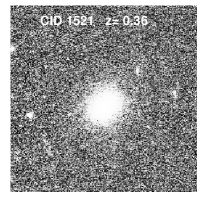
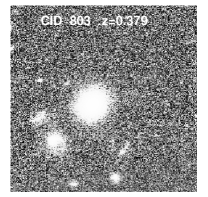
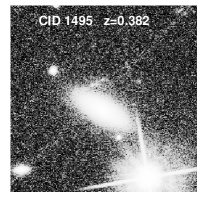
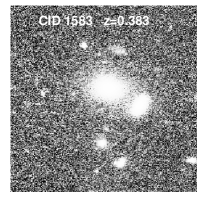
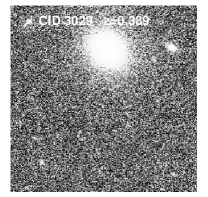
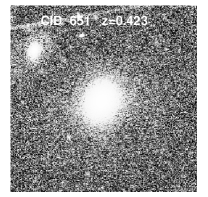
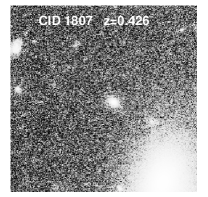
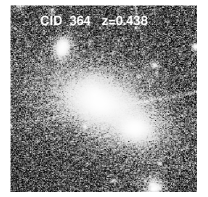
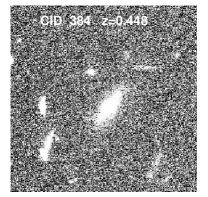
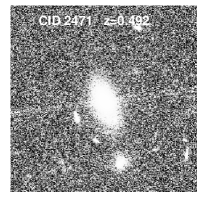
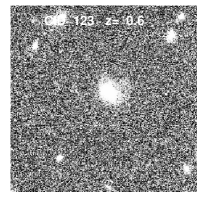
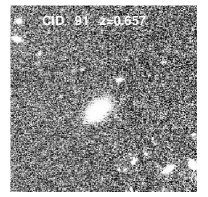
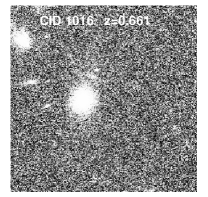
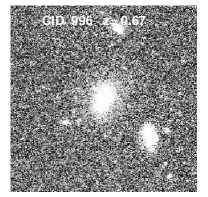
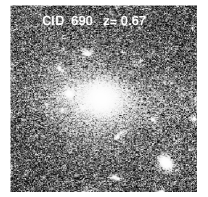
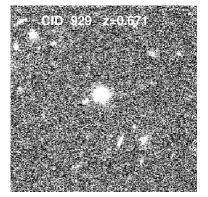
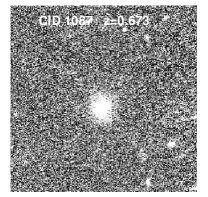
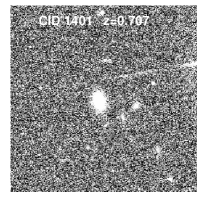
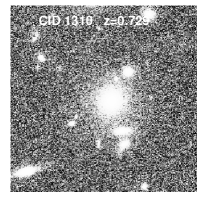
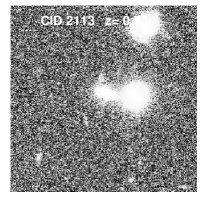
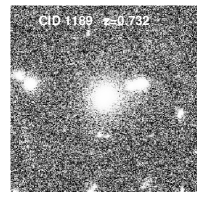
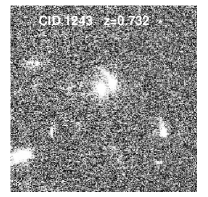
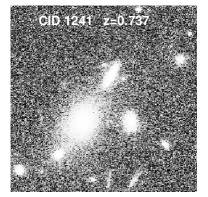
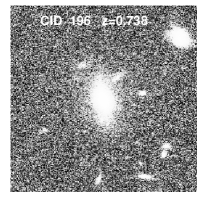
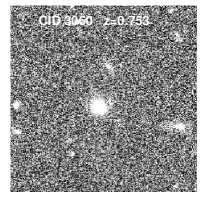
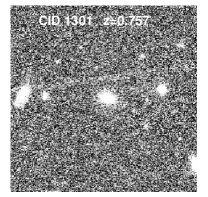
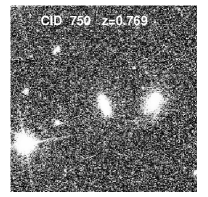
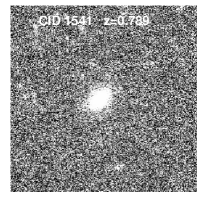
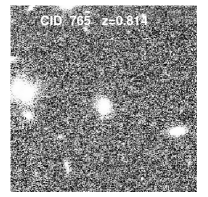
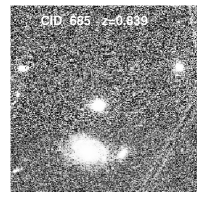
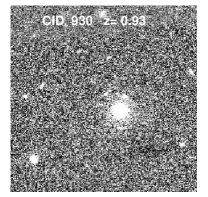
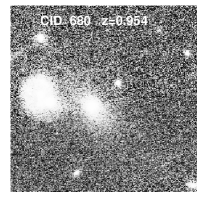
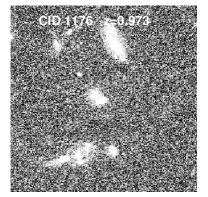
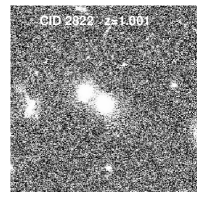
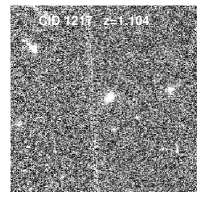
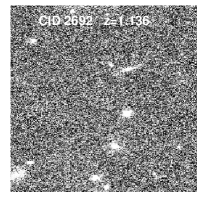
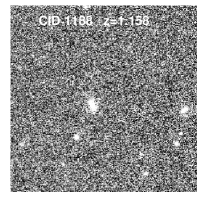
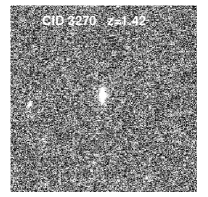
All the sources included in the X-ray ETG sample have been classified as extended in the optical band using the Hubble ACS data (filter FW814) (Leauthaud et al. 2007). A further visual inspection of the sources confirms this finding, even for the sources at the higher redshifts (see Figure 15).
3.2 X-ray properties
The goal of this analysis is to compare the X-ray luminosity due to the hot gas emission with the K-band luminosity following the analysis of BKF and KF13. In order to do so, all the possible contribution to the X-ray luminosity must be isolated and removed. BKF gives a relation that can be used to estimate the integrated LMXB contribution to the X-ray emission of an ETG. This relation was empirically derived from their study performing emission decomposition of a sample of nearby ETGs observed with Chandra. However, this relation is strictly valid only in the nearby universe, where it was derived. Fragos et al. (2013) showed how the luminosity of field LMXBs evolves with redshift and is a function of the galaxy stellar mass and of the age of the parent stellar population. We therefore used the formulation of Fragos et al. (2013) to estimate the LMXB contribution to the luminosity in our galaxies. We note that their formulation is only valid for native field LMXBs. For LMXBs formed dynamically in globular clusters, this age correction will not apply, so the Fragos et al. (2013) correction may over estimate the X-ray fading of a given galaxy. We keep this possibility in mind when examining our correlation (see Section 4). We note that, the age correction is small enough to not offset the distribution of points significantly.
To subtract the LMXB contribution from the total X-ray luminosity (LX), we used the count rates in the 0.5-7 keV band from the C-COSMOS X-ray catalog and converted them into luminosities in the 0.3-8 keV rest frame band using a power law model with a slope of =1.8, consistent with the typical spectrum of LMXBs, and Galactic NH. For these parameters, the conversion factor used from Chandra count rates to fluxes is 1.2410-11 counts-1 . From these X-ray luminosities, we then subtracted the contribution of the LMXBs using the following relation in the 0.3-8 keV band
| (2) |
reported by Fragos et al. (2013). The contribution of the LMXB ranges from 1% for bright galaxies to 70% for faint galaxies.
The X-ray luminosity can also be contaminated by high mass X-ray binaries (HMXBs), in particular in young X-ray ETGs. To determine HMXBs contribution, we use the relation between the HMXBs luminosity and the star formation rate reported by Mineo, Gilfanov & Sunyaev (2012), which has been derived for star-forming galaxies and will therefore return an upper limit on this population luminosity. The typical SFR of the X-ray ETGs is 0.1 M⊙/yr, which implies a full band X-ray luminosity of 1038erg s-1for HMXBs. This value is two orders of magnitude (or more) smaller than the typical luminosity of the X-ray ETGs reported here, so we conclude that HMXBs do not affect the measured X-ray luminosity.
Once the LMXB contribution is removed and the contribution of HMXBs assessed to be negligible, we converted the remaining count rates into a luminosity using a thermal model (APEC in Sherpa, Freeman et al. 2001), adopting different temperatures depending on the total X-ray luminosity of the source, plus Galactic NH. We used kT=0.7, 1 and 2 keV for X-ray luminosities of lg(L41, 41–42 and erg s-1, respectively, according to BKF and Dai et al. (2007). The X-ray luminosity was K-corrected using the calc_kcorr tool in Sherpa adopting the above spectral models. The final rest frame X-ray luminosity computed and reported in Table 1 and in the following Figures is in the 0.3-8 keV band. This luminosity, besides the emission from hot gaseous halos, may include a contribution from AGN emission.
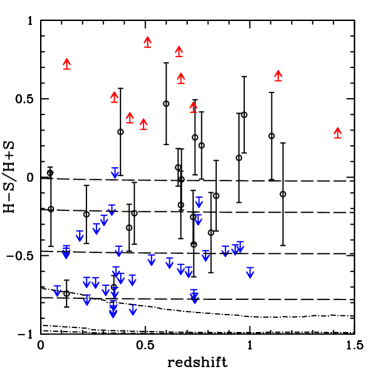
X-ray spectral analysis could help in separating the hot gas from the AGN contribution. The low number of counts of these sources (around 30 counts in the full band) prevents us to perform single source spectral analysis. Therefore, we computed the hardness ratio, defined as HR=, where H and S are the number of net counts in the hard and soft band respectively, to study the spectral shape of the sources. The 69 X-ray ETGs are all detected in the C-COSMOS 0.5-7 keV band: 22 sources are detect in both soft, hard and full bands; 34 sources in soft and full band; 10 sources in hard and full band; 3 sources are detected only in the full band. The HR versus redshift for the X-ray ETGs is plotted in Figure 6. Upper limits, for those sources which are only detected in the soft and full band, are reported as downwards arrows, lower limit for sources detected in the hard and full band only are reported as upwards errors. Curves representing a model of power law with =1, 1.4, 2 and 3 (from top to bottom) absorbed by Galactic NH have been used. In the same plot, curves obtained from an APEC model with the same temperatures used to compute the X-ray luminosity above (kT=0.7, 1, 2 keV from bottom to top) are represented as dash-dotted line. The last set of curves are all clustered at HR-0.7 and lower. The power law better represents the nuclear emission while the APEC model the hot gas emission.
All the sources with no detection in the hard band (the HR upper limit) are consistent with thermal or very steep power-law models, resembling the thermal model. Their 2-10 keV luminosity upper limits are consistent with the LMXB emission computed using the Fragos et al. (2013) relation as above in the hard band. The sources with no detection in the soft band have an harder spectrum, representable by a flat power-law resembling a steep power-law spectrum plus additional obscuration (NNH,Gal). Sources detected in both bands have HRs in the range -0.5 to 0.5 and theirs spectrum could be represented by a combination of both models.
In order to determine whether the X-ray emission in the 69 X-ray ETGs is extended or it is dominated by a nuclear point like source, we also analyzed the spatial distribution of the X-ray counts in each source. This analysis can be done only for sources with enough counts in a single observation and with redshift z0.5 in order to avoid resolution problems (at higher redshifts, if the source is not perfectly on axis it is hard to resolve an extended source). Detailed simulations, using the CIAO software Chart333http://cxc.harvard.edu/chart/runchart.html and MARX444http://cxc.harvard.edu/chart/threads/marx/, allow us to determine the minimum number counts needed at different off-axis angle to recognize when a source is point like or extended. Given the limit of 6 counts needed in a single observation and that many sources in our sample have a low count statistics, this analysis could be done only for 27 sources out of 69. Using the CIAO tool dmellipse, we compared the spatial distribution of the counts with the shape of the Chandra point spread function (PSF). We produced a PSF image at the same position on the detector of each analyzed source using Chart and MARX. Using this information we derive that 14 of 27 analyzed sources have a size comparable to the one of the PSF at their position (sizesource 2sizePSF). The remaining 13 sources resulted to be extended (sizesource 2sizePSF).
Overall, the hot gas and AGN contributions to the X-ray emission of the X-ray ETGs are hard to disentangle and all the above analysis will be subject of the discussion in Section 4.
We have also matched the X-ray ETGs with the catalog of X-ray groups in the COSMOS field (Giodini et al. 2010) and we find that 14 sources lie within 6′′ from the center of the group they belong to, meaning they most probably are the central galaxies of these groups. Given the large number of structures (groups and clusters) in the COSMOS field (see Scoville et al. 2013), we kept the matching radius small to find only central galaxies.
Table 1 summarizes the properties of the X-ray ETGs used in this work: C-COSMOS identifier, spectroscopic redshift when available or photometric, optical spectral type, 0.5-7 keV count rates and errors from the C-COSMOS catalog, the rest frame LX,LMXB, the remaining rest frame X-ray luminosity after LMXB contribution subtraction, HR, extension of X-ray emission, LK and the error derived from the fading, M⋆, age, group relevance and radio emission flag.
| CID | redshift | spec. type | Count ratesa (cts/s) | Count rates erra (cts/s) | L | L | HR | extension | LK | LK err | M⋆ | Age | Group Flag | Radio Flag |
|---|---|---|---|---|---|---|---|---|---|---|---|---|---|---|
| 0.5-7 keV | 0.5-7 keV | 0.3-8 keV | 0.3-8 keV | in L⊙ | in M⊙ | Gyr | ||||||||
| 73 | 0.045 | ALG | 2.99e-03 | 1.1e-4 | 38.72 | 40.91 | 0.03 | 1 | 10.87 | 0.02 | 9.85 | 1e+10 | 1 | |
| 91 | 0.657 | NLAGN | 4.52e-04 | 5.5e-5 | 40.3 | 43 | 0.06 | 0 | 11.12 | 0.09 | 10.52 | 2e+09 | ||
| 123 | 0.6p | 2.19e-04 | 6.3e-5 | 39.99 | 42.57 | 0.47 | 0 | 10.70 | 0.09 | 10.06 | 2e+09 | |||
| 196 | 0.738 | NL | 3.98e-04 | 1.00e-4 | 40.84 | 43.1 | 0.25 | 0 | 11.81 | 0.09 | 11.16 | 2e+09 | 1 | |
| 384 | 0.448 | NL | 3.18e-04 | 6.3e-5 | 39.91 | 42.34 | -0.23 | 1 | 10.61 | 0.10 | 10.06 | 2e+09 | ||
| 633 | 0.350 | ALG | 1.31e-03 | 1.2e-4 | 40.33 | 42.66 | -0.70 | 1 | 11.70 | 0.10 | 11.30 | 7e+09 | 1 | |
| 634 | 0.124 | ALG | 1.10e-03 | 1.1e-4 | 40.17 | 41.4 | -0.74 | 6 | 12.01 | 0.04 | 11.30 | 1e+10 | 1 | 1 |
| 651 | 0.423 | ALG | 3.93e-04 | 5.5e-5 | 40.04 | 42.36 | -0.32 | 2 | 11.29 | 0.10 | 11.05 | 8e+09 | 1 | |
| 685 | 0.839 | NL | 1.97e-04 | 4.2e-5 | 40.34 | 42.97 | -0.12 | 0 | 11.46 | 0.10 | 10.84 | 3e+09 | ||
| 750 | 0.769p | 1.94e-04 | 4.2e-5 | 40.45 | 42.85 | 0.20 | 0 | 11.39 | 0.09 | 10.70 | 2e+09 | |||
| 765 | 0.814 | ALG | 2.11e-04 | 4.7e-5 | 39.74 | 42.96 | -0.35 | 0 | 11.04 | 0.10 | 10.68 | 6e+09 | ||
| 996 | 0.670 | ALG | 3.44e-04 | 7.1e-5 | 40.11 | 42.91 | -0.18 | 0 | 11.50 | 0.09 | 11.13 | 8e+09 | ||
| 1059 | 0.049 | ALG | 2.39e-04 | 5.6e-5 | 38.9 | 39.92 | -0.20 | 1 | 10.29 | 0.02 | 10.05 | 1e+10 | ||
| 1087 | 0.673 | NL | 2.48e-04 | 4.5e-5 | 40.32 | 42.77 | -0.01 | 0 | 11.25 | 0.09 | 10.64 | 2e+09 | ||
| 1117 | 0.948p | 1.67e-04 | 4.7e-5 | 40.46 | 43.07 | 0.12 | 0 | 11.46 | 0.09 | 10.71 | 2e+09 | |||
| 1176 | 0.973p | 1.60e-04 | 4.1e-5 | 40.59 | 43.09 | 0.40 | 0 | 11.60 | 0.09 | 10.91 | 2e+09 | |||
| 1188 | 1.158 | NL | 1.15e-04 | 3.7e-5 | 39.84 | 43.22 | -0.11 | 0 | 11.74 | 0.09 | 10.22 | 2e+09 | ||
| 1189 | 0.732 | NL | 2.25e-04 | 4.5e-5 | 40.49 | 42.84 | -0.43 | 0 | 11.82 | 0.09 | 11.46 | 7e+09 | 1 | |
| 1217 | 1.104p | 1.23e-04 | 3.7e-5 | 40.45 | 43.17 | 0.26 | 0 | 11.56 | 0.10 | 10.77 | 2e+09 | |||
| 1289 | 0.219 | ALG | 3.18e-04 | 5.3e-5 | 40.33 | 41.42 | -0.24 | 3 | 11.72 | 0.08 | 11.40 | 9e+09 | 1 | |
| 1310 | 0.729 | ALG | 2.56e-04 | 4.3e-5 | 40.63 | 42.9 | -0.25 | 0 | 11.85 | 0.09 | 11.51 | 6e+09 | 1 | |
| 1495 | 0.382p | 1.29e-04 | 3.8e-5 | 40.24 | 41.82 | 0.29 | 1 | 11.58 | 0.09 | 11.30 | 8e+09 | |||
| 13 | 0.187 | NLAGN | 1.94e-04 | 5.5e-5 | 39.92 | 41.04 | -0.34 | 2 | 11.26 | 0.09 | 11.05 | 1e+10 | 1 | |
| 133 | 0.220 | SF gal | 2.77e-04 | 7.0e-5 | 40.19 | 41.36 | -0.64 | 1 | 11.68 | 0.09 | 11.25 | 8e+09 | 1 | |
| 288 | 0.346 | ALG | 4.55e-04 | 6.8e-5 | 40.51 | 42.17 | -0.83 | 3 | 11.97 | 0.10 | 11.55 | 8e+09 | 1 | 1 |
| 364 | 0.438 | ALG | 2.71e-04 | 4.0e-5 | 40.46 | 42.23 | -0.62 | 1 | 11.76 | 0.10 | 11.50 | 8e+09 | 1 | 1 |
| 680 | 0.954 | NL | 2.01e-04 | 6.2e-5 | 41.27 | 43.16 | -0.41 | 0 | 11.96 | 0.09 | 11.17 | 1e+09 | 1 | 1 |
| 690 | 0.670p | 3.75e-04 | 8.7e-5 | 40.56 | 42.94 | -0.56 | 0 | 11.89 | 0.09 | 11.57 | 7e+09 | 1 | 1 | |
| 783 | 0.122 | ALG | 1.20e-04 | 3.6e-5 | 39.65 | 40.42 | -0.45 | 3 | 11.31 | 0.05 | 10.75 | 1e+10 | ||
| 827 | 0.354 | ALG | 1.85e-04 | 4.1e-5 | 40.49 | 41.81 | -0.70 | 2 | 11.77 | 0.09 | 11.55 | 8e+09 | 1 | |
| 898 | 0.347 | ALG | 3.39e-04 | 5.6e-5 | 40.31 | 42.06 | -0.82 | 2 | 11.53 | 0.09 | 11.10 | 5e+09 | 1 | 1 |
| 930 | 0.930 | NL | 1.27e-04 | 3.5e-5 | 40.76 | 42.93 | -0.43 | 0 | 11.73 | 0.09 | 11.01 | 2e+09 | ||
| 983 | 0.221 | ALG | 2.34e-04 | 6.1e-5 | 40.29 | 41.29 | -0.75 | 0 | 11.81 | 0.09 | 11.40 | 1e+10 | 1 | |
| 993 | 0.348 | SF gal | 2.31e-04 | 5.3e-5 | 40.43 | 41.89 | -0.79 | 0 | 11.71 | 0.09 | 11.47 | 8e+09 | ||
| 1241 | 0.737p | 1.93e-04 | 3.9e-5 | 40.18 | 42.79 | -0.74 | 0 | 11.50 | 0.10 | 11.15 | 7e+09 | 1 | ||
| 1243 | 0.732 | NL | 2.37e-04 | 4.5e-5 | 40.29 | 42.87 | -0.72 | 0 | 11.24 | 0.09 | 10.55 | 2e+09 | ||
| 1292 | 0.530 | ALG | 1.42e-04 | 3.8e-5 | 40.33 | 42.23 | -0.50 | 0 | 11.63 | 0.09 | 11.35 | 8e+09 | 1 | 1 |
| 1301 | 0.757 | NL | 1.25e-04 | 3.8e-5 | 40.25 | 42.63 | -0.13 | 0 | 11.14 | 0.09 | 10.57 | 2e+09 | ||
| 1364 | 0.311 | SF gal | 1.47e-04 | 4.6e-5 | 40.27 | 41.51 | -0.69 | 4 | 11.61 | 0.10 | 11.24 | 7e+09 | 1 | |
| 1401 | 0.707 | ALG | 1.05e-04 | 3.5e-5 | 39.61 | 42.46 | -0.57 | 0 | 11.31 | 0.09 | 10.58 | 7e+09 | ||
| 1478 | 0.616p | 1.60e-04 | 3.9e-5 | 39.73 | 42.47 | -0.52 | 0 | 10.61 | 0.09 | 9.95 | 2e+09 | |||
| 1500 | 0.079 | ALG | 1.62e-04 | 4.1e-5 | 39.77 | 40.09 | -0.69 | 4 | 11.23 | 0.02 | 10.84 | 9e+09 | 1 | |
| 1521 | 0.360 | NL | 8.30e-05 | 4.05e-5 | 39.8 | 41.49 | -0.57 | 2 | 11.14 | 0.09 | 10.84 | 8e+09 | ||
| 1541 | 0.789 | SF gal | 1.33e-04 | 4.6e-5 | 40.18 | 42.71 | -0.47 | 0 | 11.52 | 0.09 | 11.12 | 6e+09 | ||
| 1583 | 0.383p | 6.68e-04 | 1.52e-4 | 39.68 | 42.47 | -0.61 | 0 | 11.07 | 0.09 | 10.72 | 8e+09 | |||
| 1811 | 0.123 | ALG | 1.23e-04 | 4.5e-5 | 39.83 | 40.42 | -0.44 | 10 | 11.46 | 0.05 | 10.97 | 1e+10 | 1 | |
| 1871 | 0.267 | SF gal | 1.88e-04 | 6.0e-5 | 40.11 | 41.41 | -0.30 | 2 | 11.55 | 0.09 | 11.21 | 1e+10 | 1 | |
| 2122 | 0.340 | NLAGN | 5.40e-05 | 4.29e-5 | 40.06 | 41.19 | -0.18 | 0 | 11.46 | 0.09 | 11.12 | 8e+09 | ||
| 2633 | 0.441 | NL | 2.21e-04 | 3.9e-5 | 40.39 | 42.15 | -0.81 | 1 | 11.27 | 0.09 | 10.89 | 3e+09 | 1 | |
| 2797 | 0.262 | ALG | 1.52e-04 | 3.9e-5 | 39.61 | 41.32 | -0.64 | 4 | 10.70 | 0.09 | 10.43 | 5e+09 | ||
| 2822 | 1.001 | ALG | 1.42e-04 | 4.4e-5 | 40.9 | 43.1 | -0.58 | 0 | 11.81 | 0.09 | 11.28 | 2e+09 | ||
| 2876 | 0.355 | NL | 7.40e-05 | 5.72e-5 | 40.14 | 41.42 | 0.06 | 0 | 11.47 | 0.09 | 11.18 | 8e+09 | ||
| 3060 | 0.753 | NLAGN | 8.60e-05 | 3.94e-5 | 40.32 | 42.47 | -0.24 | 0 | 11.22 | 0.09 | 10.57 | 2e+09 | ||
| 3247 | 0.883 | NL | 1.39e-04 | 4.3e-5 | 40.55 | 42.9 | -0.44 | 0 | 11.49 | 0.10 | 10.87 | 2e+09 | ||
| 3564 | 0.303p | 9.00e-05 | 4.75e-5 | 39.49 | 41.27 | -0.24 | 2 | 10.80 | 0.10 | 10.55 | 8e+09 | |||
| 3665 | 0.374 | ALG | 7.50e-05 | 4.91e-5 | 40.48 | 41.48 | -0.44 | 1 | 11.93 | 0.10 | 11.53 | 8e+09 | 1 | |
| 368 | 0.511 | NLAGN | 2.55e-04 | 4.6e-5 | 40.27 | 42.44 | 0.83 | 0 | 10.95 | 0.09 | 10.34 | 2e+09 | 1 | |
| 514 | 0.125 | ALG | 3.41e-04 | 7.6e-5 | 39.82 | 40.88 | 0.69 | 2 | 11.49 | 0.05 | 10.94 | 1e+10 | ||
| 929 | 0.671 | SF gal | 1.13e-04 | 3.6e-5 | 39.98 | 42.42 | 0.60 | 0 | 10.97 | 0.09 | 10.36 | 2e+09 | ||
| 1016 | 0.661 | NL | 2.33e-04 | 5.7e-5 | 40.05 | 42.73 | 0.77 | 0 | 11.36 | 0.09 | 10.99 | 6e+09 | ||
| 1803 | 0.352p | 7.80e-05 | 4.07e-5 | 40.37 | 41.41 | 0.48 | 0 | 11.25 | 0.09 | 10.87 | 3e+09 | |||
| 1807 | 0.426p | 8.7e-05 | 4.3e-5 | 38.93 | 41.88 | 0.35 | 0 | 10.72 | 0.10 | 9.03 | 2e+09 | |||
| 2113 | 0.730 | ALG | 6.20e-05 | 3.49e-5 | 40.38 | 42.28 | 0.41 | 0 | 11.43 | 0.09 | 10.75 | 2e+09 | ||
| 2471 | 0.492 | NL | 8.60e-05 | 4.06e-5 | 40.49 | 42.13 | 0.31 | 1 | 11.45 | 0.10 | 11.00 | 3e+09 | ||
| 2692 | 1.136p | 8.30e-05 | 3.04e-5 | 40.25 | 43.05 | 0.61 | 0 | 11.22 | 0.09 | 10.57 | 2e+09 | |||
| 3270 | 1.420p | 9.50e-05 | 4.08e-5 | 40.91 | 43.48 | 0.25 | 0 | 11.71 | 0.06 | 11.22 | 2e+09 | |||
| 803 | 0.379p | 7.30e-05 | 4.21e-5 | 39.98 | 41.52 | 0.00 | 0 | 11.00 | 0.10 | 10.24 | 2e+09 | |||
| 1630 | 0.887 | NL | 1.54e-04 | 7.2e-5 | 40.49 | 42.94 | 0.00 | 0 | 11.29 | 0.10 | 10.75 | 2e+09 | ||
| 3029 | 0.389 | SF gal | 1.25e-04 | 5.0e-5 | 40.46 | 41.82 | 0.00 | 0 | 11.38 | 0.09 | 10.84 | 2e+09 |
a: The count rates and error in the 0.5-7 keV band. b: LX,lmxb is the X-ray luminosity computed using Fragos et al. (2013) relation. c: LX is the remaining X-ray luminosity after subtracting the LMXB contribution to the total and it is computed using a thermal model as in Section 3.1. p: Photometric redshift.

4 The local relation and its high redshift version
In Figure 7, the X-ray ETGs are plotted together with the local sample. In order to compare the K-band luminosity of the X-ray ETGs with those of the local sample, we have taken into account the evolution of the stellar population (i.e., the fading effect). We computed the correction factor for ages in the range 2 to 10 Gyr at different redshifts starting from an elliptical galaxy template produced using a Chabrier (2003) initial mass function with an instantaneous burst of star formation. At a given zobs, younger galaxies have larger fading correction than older ones. For all the sources, given the uncertainties on the age, we report the possible range of K-band luminosities corrected for fading as an error bar on the x-axis. The K-band luminosity plotted in Figure 7 and reported in Table 1 is the value at the center of this range. As discussed in Section 3.2, the LMXB contribution was subtracted from the total X-ray luminosity, and the remaining luminosity should now represent the gas component plus some contribution from the nuclear point source, if any. The “typical” error bar on the X-ray luminosity corresponds to 25% of the X-ray luminosity (0.1dex).
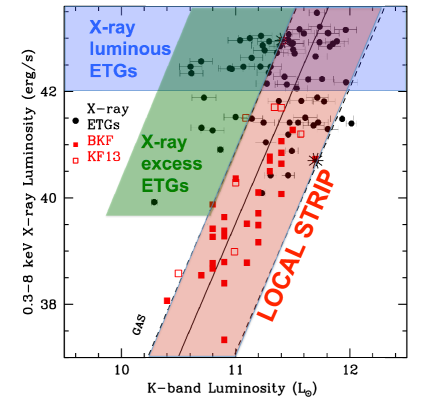
BKF found a relation with best fit slope of , considering ETGs in the local sample with 0.3–8 keV luminosities of the hot gas erg s-1, and excluding central dominant (cD) galaxies. Including in the local sample a few more ETGs reaching erg s-1, and one ETG (M87) with erg s-1, KF13 found a steeper relation, with best fit slope of (with M87), or (without M87). Both samples of BKF and KF13 are shown in Figure 7, with different symbols (solid and open red squares). In Figure 7, for reference, we have plotted two lines (dashed black lines), parallel to the local relation of KF13, indicating the most extreme ranges (to the left and right) of the relation at bright X-ray (passing through M87) and bright K-band (passing through NGC1316) luminosities. We will refer to this in the text as the “local strip” (red shaded area).
The first remarkable evidence from Figure 7 is that most of COSMOS X-ray ETGs lie along the local relation, and seem to confirm and extend its validity to values larger than observed locally. This finding suggests that the main factors regulating of local ETGs (e.g., gravitational attraction, heating from supernovae and AGN feedback) were already the main factors at , and created a state for the gas that is long-lasting, since it corresponds to relations that are consistent at and at . For example, the solid line in Fig. 7 can be considered as a fiducial “virial relation” for the hot gas coronae of the local universe (KF13): this local relation is consistent with a tighter and relation (see KF13 for more details). Figure 7 shows that, at least for the most massive X-ray ETGs, the gas is bound by the dark matter potential, at a temperature close to , and in an overall equilibrium state where similar average gas properties are kept on a secular timescale, and evidently heating (from supernovae and massive black hole accretion feedback) and radiative cooling balance.
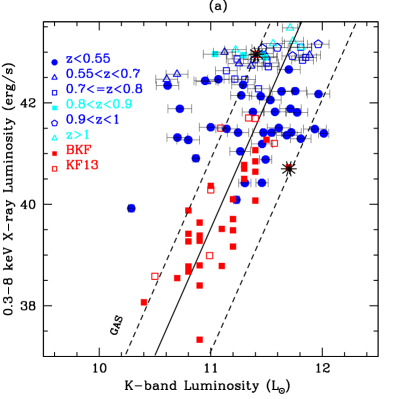
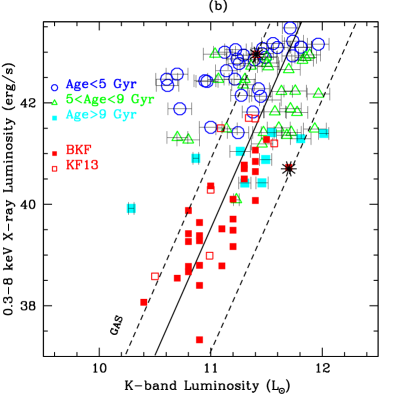
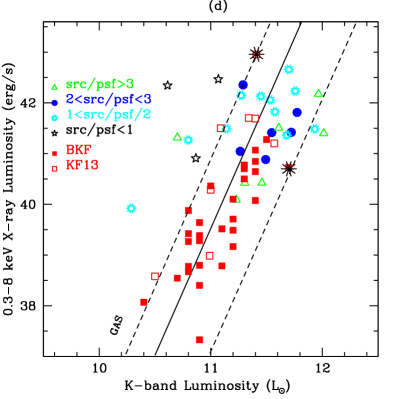
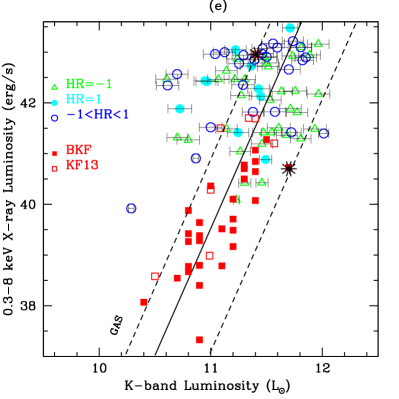
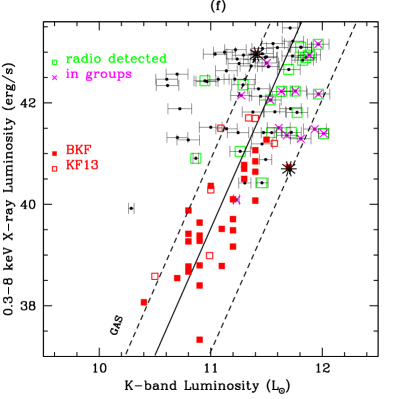
The panels in Figure 9 highlight seven properties of the X-ray ETGs: redshift (a), age (b), spectroscopic classification (c), X-ray extension (d), HR (e), radio detection (see Section 4.1) and group occupancy (f). The redshift bins in Fig. 9 (a) have been selected in order to have equal comoving volume in each redshift bin.
The majority of COSMOS X-ray ETGs with erg s-1 are less distant (all except one have ; Fig. 9 (a)), with (Fig. 9 (e)), many are extended in the X-rays (Fig. 9 (d)) and optically classified as ALG (Fig. 9 (c)). Based also on their moderate values, the X-ray emission can be entirely due to hot ISM. With respect to the more distant and X-ray more luminous X-ray ETGs, they populate the region around the relation more uniformly, with roughly the same number of objects to the left and to the right of it. Overall, these X-ray ETGs follow nicely the local , just adding an enhanced scatter to it. We also note that all those in groups are within the local strip (Fig. 9 (f))
Three further points emerge from comparing the distribution of the ETGs from the local sample and COSMOS X-ray ETGs: (1) There is a large number (43 sources) of X-ray ETGs with erg s-1, a range of values that is not so frequent in ETGs of the local universe, if cases of AGN contamination are excluded (e.g., O’Sullivan et al. 2001). (2) There is a substantial group of X-ray ETGs lying to the left of the strip, due to an excess of for their with respect to what found locally. Most (but not all) of these X-ray ETGs have also erg s-1. (3) There are no ETGs to the top right of the local strip at erg s-1 because their LK would be higher than the typical K-band luminosity of the ETGs in the COSMOS sample. As shown in Figure 7, we define the X-ray ETGs in the first group as X-ray luminous ETGs and in the second group as X-ray excess ETGs. Below we discuss possible origins for both groups.
4.1 The X-ray luminous ETGs
The X-ray emission of the X-ray luminous ETGs with (in the blue shaded area of Figure 7) can be explained by three possibilities: (a) these galaxies are central dominant ETGs in groups or clusters; (b) the emission includes a major contribution from an AGN; (c) these galaxies are experiencing a specially bright phase for the hot gas, due to an evolutionary effect (indeed, most of these sources are at ; Fig. 9 (a)).
In the local universe, hot gas coronae in galaxies that are isolated or in hot gas-poor environments have luminosity values erg s-1, as shown by observational evidences (e.g., O’Sullivan et al. 2001, BKF) and by numerical simulations (e.g., Pellegrini & Ciotti 1998, Mathews & Brighenti 2003). Luminosities erg s-1 for hot gas coronae, instead, are typical of cD ETGs in groups or clusters (Helsdon et al. 2001, Matsushita 2001, Nagino & Matsushita 2009), where the conditions for gas retention, or even accretion from outside the galaxies, are favorable; the X-ray emission could be also contaminated by the group/cluster emission. In Fig. 9, the representative case of a cD galaxy is used (M87, black starred symbol on top left) in the local sample. Central galaxies thus show exceptional ratios, since they couple an optical luminosity typical of a bright555For example M87 is not the K-brightest ETG in Virgo: its log=11.4, while two other giant ETGs in Virgo have log=11.50 (NGC4472) and log=11.48 (NGC4649). ETG to X-ray luminosities that can reach erg s-1 (Helsdon et al. 2001). Such high values cannot be reproduced by models for isolated ETGs (e.g., Brighenti & Mathews 1998, Pellegrini & Ciotti 1998).
A few facts lend support to the idea of the presence of some central ETGs among the X-ray luminous ETGs. First, 40% X-ray luminous ETGs have , indicative of dominant soft X-ray emission from a thermal plasma (Fig. 6, Sect. 3.1, Fig. 9 (e)). Second, in Fig. 9 (a) number of X-ray luminous ETGs are found around the position of M87, slightly to the left of the local relation, and could be M87-like counterparts. Finally, for a number of cases (8 sources), we have found that our X-ray luminous ETGs lie at the center of groups (Fig. 9 (f)). The number of C-COSMOS X-ray sources (from the identification catalog of Civano et al. 2012) lying within 6′′ from the center of a group is instead only 25 of 841 X-ray sources up to z=1.4 (the limit in redshift of the Giodini et al. 2010 catalog), which makes the number of ETGs at the center of groups very significant. Further constraints on this idea could come from the extension of the X-ray sources: the extension could be studied just for few (8) cases of the X-ray luminous ETGs, that are also the most distant galaxies (Fig. 9 (a)); in two cases sizesource/size2, two sources are point-like, and the remaining 4 have 1sizesource/size2 (Fig. 9 (d)). If there are M87-like hot haloes of central ETGs among the X-ray luminous ETGs, since many X-ray luminous ETGs seem to stay close to the local virial relation out to the largest in our sample, then already at a redshift there were haloes that have reached an equilibrium similar to that seen locally.
Support for an AGN origin of the high is given by the “hard” HR value for seven of the X-ray luminous ETGs: of the 10 X-ray ETGs with HR=1, 7 are X-ray luminous (Fig. 9 (e)). Even in many of the other softer X-ray luminous ETGs (those with ) there could be some AGN contamination, from an AGN of moderate luminosity ( erg s-1, Ho 2008). Some AGN contamination can be present even in the hypothesized central ETGs among the X-ray luminous ETGs discussed above. A hint for nuclear activity is also found using radio emission. Of the 19 X-ray ETGs (27% of the total sample) with a counterpart in the Very Large Array 1.4 GHz COSMOS radio catalog (Schinnerer et al. 2010), 12 are X-ray luminous (Fig. 9 (f)). This percentage is larger than what found when matching the COSMOS ETGs with comparable K band luminosities to our sample with the VLA-COSMOS catalog which returns only a 3% of matches.
The third hypothesis for the origin of the X-ray luminous ETGs is that of an evolutionary effect. Gas-dynamical numerical models for the study of the hot gas behavior during the ETGs’ lifetime, that take into account the evolution of the stellar population and the effects of AGN feedback, show that the gas coronal luminosity on average should have been just mildly larger in the past, due to the combined effects of a stellar mass loss rate that was larger, and larger duty-cycle of activity (Ciotti et al. 2010). Models without feedback predict that the gas was much more X-ray luminous in the past (up to erg s-1 for isolated ETGs, Ciotti et al. 1991), and for a prolonged time (a few Gyr), with the accumulation of large amounts of cooled gas mass; the introduction of feedback from accretion on the massive black hole (radiative plus mechanical, triggered by a high mass accretion rate ) produces recurrent cycles (Ciotti et al. 2010). During each cycle the hot ISM accumulates and its luminosity slowly increases, reaching suddenly values even larger than erg s-1 for a brief time (a few yr), when the AGN turns on. After having removed the gas from its surroundings with its feedback action, the AGN fades, the hot gas emission decreases, and a new cycle starts. Outside nuclear outbursts, the gas shows a mild secular decline in , of a factor of a few; also the gas temperature remains roughly constant (Pellegrini et al. 2012).
Some X-ray luminous ETGs could then be experiencing the consequences of an accretion episode at high mass accretion rate, with a brightening of the nucleus, and the increase of the hot ISM luminosity due to various feedback effects (as described in Ciotti et al. 2010). The optical classification of the X-ray luminous ETGs is a mixed bag, not revealing the clear presence of an active source. ETGs dominated by the brief and very luminous AGN phase are not included in the X-ray ETG sample, by construction, but the flare of the hot gas emission lasts longer than that of the nucleus, and could be at the origin of a few X-ray luminous ETGs (with their due to mostly to hot gas). A number of the X-ray luminous ETGs could have such an origin: the duty-cycle of the nuclear (bolometric) activity is in the range 0.006-0.048 since , thus we expect a duty-cycle just larger for the hot gas “activity” (above a level of erg s-1; Pellegrini et al. 2012). Therefore, just a few such cases in a sample of ETGs at are expected. Indeed, considering all the X-ray luminous ETGs and the COSMOS ETGs at bright K-band luminosities ( L⊙) and z0.8, we find a duty cycle of 0.02 consistent with what expected above. The expected range of the duty-cycle given above refers to an isolated ETG of L⊙ formed at and with a stellar mass of 2.9; these numbers become larger for later formation epochs, and more massive ETGs, or in dense environments (where the gas retention is larger).
Recently, for galaxies in the X-ray AEGIS survey at 0.3, the extended emission of the hot ISM in 96 active and a large sample of non-active galaxies was characterized with a stacking analysis, to study possible effects of feedback from AGN on the diffuse interstellar gas (Chatterjee et al. 2013). By comparing the average stacked X-ray surface brightness profiles of the two classes of active and non-active objects, disturbances were found in the profile of AGN host galaxies, qualitatively similar to the predictions of the feedback models described above (Pellegrini et al. 2012). Thus feedback could cause an evolution for the hot gas as predicted in these models, and it remains a possibility that it is at the origin of a small fraction of the X-ray luminous ETGs of Fig. 7.
In conclusion, the high of X-ray luminous ETGs could be the mixed result of (in order of decreasing importance) the presence of many M87-like ETGs, which are rare within 32 Mpc, but have been found in a large number in the large volume surveyed by COSMOS (the comoving volume within z is 150 Gpc3); contamination from AGNs, dominating or not the total ; evolution in the X-ray properties of ETGs.
We note that the number of X-ray luminous ETGs ( erg s-1) remains constant when looking at similar volumes showing no evolution in the source number: there are 11 sources at z0.55, 8 in the redshift range 0.55-0.7 and 11 in the range 0.7-0.8. This lack of evolution is different from that found for the growth of X-ray selected AGN (Lehmer et al. 2007). However, we should keep in mind that this sample is small, and for many of its objects the X-ray luminosity could be contaminated by low luminosity AGNs, or effects of age/interactions. Moving to higher redshift, the survey start to lose sensitivity so we cannot perform a substantial comparison (see Fig. 1). The same happens when considering lower X-ray luminosities.
4.2 X-ray ETGs to the left of the local strip: an age effect?
We now turn to consider the other major evidence provided by Fig. 7 mentioned above: most X-ray ETGs overlap with the local strip, except for a substantial group of X-ray ETGs located to the left of the strip, that have an excess of for their ; we call the X-ray ETGs in this group X-ray excess ETGs. These include 6 X-ray ETGs with , plus those 15 X-ray luminous ETGs occupying the leftmost positions away from the strip.
A few X-ray excess ETGs are found close to M87, and could be galaxies similar to it and for these the same solutions suggested in the previous section can apply. However, the of the X-ray excess ETGs are lower than that of M87, thus it is not likely that most of them are cD galaxies. As shown in Figure 9 (f), none of them reside in the central part of a group. Central galaxies in the local universe have log (Helsdon et al. 2001); taking the ratio of M87 as representative, this means log (in fact M87 is already one of least luminous central galaxies in the optical).
The optical classification of X-ray excess ETGs is mixed (Fig. 9 (c)), but with just three ALG. Their HR values are also mixed (Fig. 9 (e)): there are 4 HR=1 cases, suggesting these could be AGN-dominated, from their hardness ratio; there are 5 HR=-1 cases, and so likely dominated by soft gaseous emission; while the remaining 7 have intermediate HRs.
Figure 9 (b) shows clearly that most X-ray excess ETGs are distinguished by having ages in the lowest “age-bin” considered in this work ( Gyr). However, there are many X-ray ETGs with similarly low age and lying closer to the “virial” relation; as described in the previous Section, the hot gas luminosity (and temperature) is expected to evolve slowly on average going to the past. A few of the youngest X-ray excess ETGs, though, could be living in an epoch when the duty-cycle of activity was larger, and have been X-ray detected thanks to the huge increase of the hot gas (and nuclear) luminosity taking place during a nuclear outburst. Note that the X-ray excess ETGs lie on the lower--side of the strip, and, due to downsizing in galaxy formation (Cowie et al. 1996, Thomas et al. 2005), could be experiencing the same hot gas evolution of the higher--side with some delay.
Another possibility, emerging from the number of X-ray excess ETGs with a younger age, is that they could be young remnants of major mergers; during mergers the X-ray emission can reach values of erg s-1, depending on the progenitors’ mass, lasting for Gyr (Cox et al. 2006). As for example, the X-ray luminosity of the hot halo in the merging galaxy NGC 6240 is 10 times higher than the X-ray luminosity expected from its stellar mass (Nardini et al. 2013), probably due to a superwind originated by a recent, nuclear starburst or more likely to star formation enhanced by the merger. The large number of narrow line objects among the X-ray excess ETGs (7 sources, Fig. 9 (e)) could be indeed a signature of nuclear star formation. Moreover, if the merger is recent, an increased number of Ultra Luminous X-ray sources (ULXs) could be present in the galaxy, as seen for example in the Antennae and Cartwheel galaxies (Fabbiano, Zezas & Murray 2001; Wolter & Trinchieri 2004). The expected number of ULXs in ETGs, from local studies, is of the order of 1 ULX per 1011 M⊙ galaxy mass, thus we expect to see in our X-ray ETGs, contributing up to 1039 erg/s in X-ray luminosity (Gilfanov 2004, Swartz et al. 2004). In case of a recent merging event, it is possible to have a larger number, up to 1 ULX per 1010 M⊙, thus 100 ULXs contributing to the overall X-ray luminosity with more than erg s-1. The X-ray excess ETGs would be similar to, but more evolved than, NGC6240 in the local universe. A qualitative analysis of the Hubble ACS (filter FW814) images of the 68 X-ray ETGs shows that 35% have a companion which could be interacting or merging, while 60% are isolated (see Fig. 15). Of the X-ray excess ETGs to the left of the local strip, 25% could be interacting or merging. The high X-ray luminosity could be partially explained by this merging/interaction effects which could boost it even by a factor of ten.
More evolved merger remnants show instead a deficit of with respect to what is typical of ETGs with similar . A Chandra survey of interacting galaxies showed that the X-ray luminosity peaks Myr before nuclear coalescence, and then drops, so that Gyr after coalescence, the merger remnants are X-ray fainter than typical massive, evolved ETGs (Brassington et al. 2007; as first noted by Fabbiano & Schweizer 1995). Evolved merger remnants could account for the X-ray under-luminosity of the 2 X-ray ETGs to the right of the local strip, none of which has a young age; for example, NGC1316 (the local ETG with the highest in Fig. 7, black starred symbol) is a nearby merger remnant, and is under-X-ray-luminous with respect to the local relation.
In conclusion, the excess- of X-ray excess ETGs is likely linked to AGN-contamination, or evolution, since most X-ray excess ETGs are particularly young. Thus, they could be still living in an earlier phase of hot gas flow evolution, and represent the rare X-ray brightest peaks reached during the cycles of activity, or could be interacting or merging objects.
5 The local and high redshift relations
The KF13 investigation revealed an intriguing smaller scatter in the relation with respect to the one, such that the could be used to infer total mass values knowing the X-ray luminosity produced by the hot gas. Provided that the X-ray ETGs are the progenitors of local sample ETGs, and given that many seem to lie on the same local relation, one could try to derive the total mass for them, assuming they also follow the local relation.
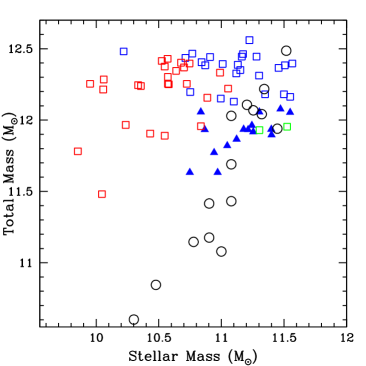
The values derived using KF13 relation are shown in Fig. 10, for local and X-ray ETGs galaxies and are compared with their stellar masses. When dividing X-ray ETGs according to their location with respect to the local strip, the sources outside the strip (red squares) on average deviate from the trend shown by local ETGs, while the X-ray ETGs inside the strip (blue triangles and squares) seem consistent. This behavior reflects the features of the plot, where a deviation with respect to the local relation is shown by a group of X-ray excess ETGs (i.e., on the low- side). The excess- translates in an “overestimate” of , and indeed in Fig. 10 the low- X-ray ETGs have an excess of for their . When dividing the sources in the local strip between high X-ray luminosity ( erg s-1, blue squares) and low X-ray luminosity ( erg s-1, blue triangles), it is clear that more ETGs in the first group deviate from the local relation than those in the second group. For an ideal use of the relation, one should definitely disentangle whether is from AGN or large hot haloes (the relation works for hot haloes).
Another possibility is that has been underestimated for the low- X-ray ETGs although their mass is consistent with the overall distribution of ETGs in the COSMOS field. Finally, one could also note that the local relation is tight for 7 ETGs only, with L L⋆.
6 Summary
We have built a sample of 69 ETGs at , all X-ray detected in the 0.5–10 keV band in the C-COSMOS survey. This sample, by selection, is representative of the population of red, passive ETGs detected in the COSMOS survey (Moresco et al. 2013), with which they share consistent distributions of stellar age, color and sSFR (Fig. 3, 4 and 5). The X-ray ETGs have stellar masses greater than (Fig. 3), thus include the most massive end of COSMOS ETGs at all K-band luminosities. Their optical to infrared SEDs and spectra show no sign of strong contamination from nuclear AGNs. By imposing an X-ray luminosity cut of erg s-1, we excluded the cases of X-ray emission dominated by bright unobscured and obscured AGN.
In all cases, to obtain as close as possible an estimate of the X-ray luminosity of hot gaseous halos, we have subtracted the LMXBs contribution to the X-ray luminosity, following the scaling relations derived in the local universe (BKF), augmented by a prescription that keeps into account the evolution of the LMXB population (Fragos et al. 2013). Faint nuclear emission is harder to isolate, but we can use the spectral shape of the X-ray emission as a guide, by looking at the Chandra hardness ratios (HR). All the X-ray ETGs not detected in the hard band and those with HR0 could have emission dominated by the gas component. The X-ray luminosity of sources with positive HR (Fig. 6) could still be contaminated by a nuclear component, possibly a low luminosity AGN.
The sample of X-ray detected ETGs at z 0 is large enough for a direct comparison with the local sample of 38 ETGs from BKF and KF13. We note that previous works (Lehmer et al. 2007, 2012; Danielson et al. 2012), which mapped the evolution of the ratio L(0.5-2 keV)/ over z=0.1–1.2, used mostly X-ray stacking analysis of optically selected ETGs in the Chandra Deep Fields.
We find that, after having taken into account the different z range covered, the optical properties (as stellar mass, , colors, ages) of the X-ray ETGs are similar to those of the local sample, except for the presence of 17 sources brighter than the -brightest ETG of the local sample (with ), which can be explained by the larger volume surveyed in COSMOS.
With the exception of a few X-ray over-luminous objects, which may harbor hidden AGN, the scatter plot of the COSMOS X-ray ETGs with erg s-1 and z0.55 is largely consistent with that of the local sample (Fig. 7 and 9). These X-ray ETGs typically have the oldest stellar ages in the sample and absorption line optical spectra (ALG); their X-ray emission tends to be soft and spatially extended, as it would be expected from hot gaseous halos.
Using stellar age as a discriminant, we find that all the X-ray ETGs with age 5 Gyr follow reasonably well the locus in the scatter diagram defined by the local sample (local strip), showing that the hot halos are similar to those observed in the local universe. This result is consistent with the predictions of evolutionary gas-dynamical models including stellar mass losses, supernova heating, and AGN feedback (Pellegrini et al. 2012). In these models, outside very short nuclear outbursts, the hot gas luminosity secularly decreases mildly, and the average emission weighted temperature remains roughly constant. Thus, one expects little variation in the relation, as observed. For these galaxies, we conclude that total masses could be derived using the KF13 local sample virial relation (Fig. 10).
Younger stellar age galaxies typically are found at higher redshift (z 0.9) and they tend to have erg s-1 and be over-luminous in X-rays for their , when compared to the local sample and older stellar age galaxies. As suggested by their radio detection or hard HR, several of these X-ray luminous ETGs may harbor hidden AGNs. Given the young stellar age of these galaxies, the high X-ray luminosity could be reconnected with merging phenomena, which would enhance the X-ray luminosity of the halo (Cox et al. 2006) and also produce a population of ULXs (as e.g., in the Antennae; Fabbiano, Zezas & Murray 2001, Wolter & Trinchieri 2004), not modeled by LMXB stellar populations. Nuclear accretion could also be responsible for awakening an AGN during merging (Cox et al. 2006). The HST images of several of these galaxies show indeed close companions (Fig. 15).
We also notice a group of intermediate age z 0.55 galaxies (5-7 Gyr) that follows the local strip. Some of these galaxies are at the center of galaxy groups or clusters (as M87), where the condition of gas retention or accretion from outside galaxies are favorable, enhancing their X-ray luminosity, which could also be contaminated by the presence of hot gas in the group. An evolutionary effect could explain the large X-ray luminosity of these ETGs: a SMBH accretion episode could have turned on the AGN and illuminated the gas by feedback effects but, while the AGN phase is short, the flare of the hot gas emission can last longer (Ciotti et al. 2010).
To better constrain evolutionary models, it would be useful to derive a firm estimate of the duty-cycle from the observations, with larger samples and more secure estimates of the hot gas properties and of the environmental conditions. Although this sample of X-ray selected ETGs is already 25% larger with respect to previous samples at high redshifts, the Chandra COSMOS Legacy Survey, a 2.8 Ms X-ray Visionary Project approved to survey the whole COSMOS field with Chandra at the same C-COSMOS depth, will provide an even larger sample of X-ray ETGs at both faint and bright X-ray luminosity to improve the current statistic. Moreover, X-ray stacking analysis of the currently undetected COSMOS ETGs could probe the lower X-ray luminosity end of the population.


References
- Bongiorno et al. (2010) Bongiorno, A., Mignoli, M., Zamorani, G., et al. 2010, A&A, 510, A56
- Boroson et al. (2011) Boroson, B., Kim, D.-W., & Fabbiano, G. 2011, ApJ, 729, 12
- Brassington et al. (2007) Brassington, N. J., Ponman, T. J., & Read, A. M. 2007, MNRAS, 377, 1439
- Brighenti & Mathews (1998) Brighenti, F., & Mathews, W. G. 1998, ApJ, 495, 239
- Bruzual & Charlot (2003) Bruzual, G., & Charlot, S. 2003, MNRAS, 344, 1000
- Canizares et al. (1987) Canizares, C. R., Fabbiano, G., & Trinchieri, G. 1987, ApJ, 312, 503
- Chabrier (2003) Chabrier, G. 2003, PASP, 115, 763
- Chatterjee et al. (2013) Chatterjee, S., Newman, J. A., Jeltema, T., et al. 2013, arXiv:1310.0836
- Ciotti et al. (1991) Ciotti, L., D’Ercole, A., Pellegrini, S., & Renzini, A. 1991, ApJ, 376, 380
- Ciotti et al. (2010) Ciotti, L., Ostriker, J. P., & Proga, D. 2010, ApJ, 717, 708
- Civano et al. (2012) Civano, F., Elvis, M., Brusa, M., et al. 2012, ApJS, 201, 30
- Cowie et al. (1996) Cowie, L. L., Songaila, A., Hu, E. M., & Cohen, J. G. 1996, AJ, 112, 839
- Cox et al. (2006) Cox, T. J., Di Matteo, T., Hernquist, L., et al. 2006, ApJ, 643, 692
- Dai et al. (2007) Dai, X., Kochanek, C. S., & Morgan, N. D. 2007, ApJ, 658, 917
- Danielson et al. (2012) Danielson, A. L. R., Lehmer, B. D., Alexander, D. M., et al. 2012, MNRAS, 422, 494
- David et al. (1991) David, L. P., Forman, W., & Jones, C. 1991, ApJ, 369, 121
- Elvis et al. (2009) Elvis, M., Civano, F., Vignali, C., et al. 2009, ApJS, 184, 158
- Fabbiano (2006) Fabbiano, G. 2006, ARA&A, 44, 323
- Fabbiano (1989) Fabbiano, G. 1989, ARA&A, 27, 87
- Fabbiano & Schweizer (1995) Fabbiano, G., & Schweizer, F. 1995, ApJ, 447, 572
- Fabbiano et al. (2001) Fabbiano, G., Zezas, A., & Murray, S. S. 2001, ApJ, 554, 1035
- Forman et al. (1985) Forman, W., Jones, C., & Tucker, W. 1985, ApJ, 293, 102
- Fragos et al. (2013) Fragos, T., Lehmer, B. D., Naoz, S., Zezas, A., & Basu-Zych, A. 2013, ApJ, 776, L31
- Freeman et al. (2001) Freeman, P., Doe, S., & Siemiginowska, A. 2001, Proc. SPIE, 4477, 76
- Garmire et al. (2003) Garmire, G. P., Bautz, M. W., Ford, P. G., Nousek, J. A., & Ricker, G. R., Jr. 2003, Proc. SPIE, 4851, 28
- Gilfanov (2004) Gilfanov, M. 2004, MNRAS, 349, 146
- Giodini et al. (2010) Giodini, S., Smolčić, V., Finoguenov, A., et al. 2010, ApJ, 714, 218
- Helsdon et al. (2001) Helsdon, S. F., Ponman, T. J., O’Sullivan, E., & Forbes, D. A. 2001, MNRAS, 325, 693
- Ho (2008) Ho, L. C. 2008, ARA&A, 46, 475
- Ilbert et al. (2009) Ilbert, O., Capak, P., Salvato, M., et al. 2009, ApJ, 690, 1236
- Ilbert et al. (2010) Ilbert, O., Salvato, M., Le Floc’h, E., et al. 2010, ApJ, 709, 644
- Jones et al. (2014) Jones, T. M., Kriek, M., van Dokkum, P. G., et al. 2014, ApJ, 783, 25
- Kalberla et al. (2005) Kalberla, P. M. W., Burton, W. B., Hartmann, D., et al. 2005, A&A, 440, 775
- Kim & Fabbiano (2013) Kim, D.-W., & Fabbiano, G. 2013, ApJ, 776, 116
- Kim & Fabbiano (2004) Kim, D.-W., & Fabbiano, G. 2004, ApJ, 611, 846
- Kim & Pellegrini (2012) Kim, D.-W., & Pellegrini, S. 2012, Astrophysics and Space Science Library, 378
- Leauthaud et al. (2007) Leauthaud, A., Massey, R., Kneib, J.-P., et al. 2007, ApJS, 172, 219
- Lehmer et al. (2007) Lehmer, B. D., Brandt, W. N., Alexander, D. M., et al. 2007, ApJ, 657, 681
- Lehmer et al. (2012) Lehmer, B. D., Xue, Y. Q., Brandt, W. N., et al. 2012, ApJ, 752, 46
- Lusso et al. (2012) Lusso, E., Comastri, A., Simmons, B. D., et al. 2012, MNRAS, 425, 623
- Lusso et al. (2011) Lusso, E., Comastri, A., Vignali, C., et al. 2011, A&A, 534, A110
- Lusso et al. (2013) Lusso, E., Hennawi, J. F., Comastri, A., et al. 2013, ApJ, 777, 86
- Mathews & Brighenti (2003) Mathews, W. G., & Brighenti, F. 2003, ARA&A, 41, 191
- Matsushita (2001) Matsushita, K. 2001, ApJ, 547, 693
- Mineo et al. (2012) Mineo, S., Gilfanov, M., & Sunyaev, R. 2012, MNRAS, 419, 2095
- Moresco et al. (2013) Moresco, M., Pozzetti, L., Cimatti, A., et al. 2013, A&A, 558, A61
- Moster et al. (2013) Moster, B. P., Naab, T., & White, S. D. M. 2013, MNRAS, 428, 3121
- Nagino & Matsushita (2009) Nagino, R., & Matsushita, K. 2009, A&A, 501, 157
- Nardini et al. (2013) Nardini, E., Wang, J., Fabbiano, G., et al. 2013, ApJ, 765, 141
- O’Sullivan et al. (2001) O’Sullivan, E., Forbes, D. A., & Ponman, T. J. 2001, MNRAS, 328, 461
- O’Sullivan et al. (2003) O’Sullivan, E., Ponman, T. J., & Collins, R. S. 2003, MNRAS, 340, 1375
- Pellegrini & Ciotti (1998) Pellegrini, S., & Ciotti, L. 1998, A&A, 333, 433
- Pellegrini et al. (2012) Pellegrini, S., Ciotti, L., & Ostriker, J. P. 2012, ApJ, 744, 21
- Polletta et al. (2007) Polletta, M., Tajer, M., Maraschi, L., et al. 2007, ApJ, 663, 81
- Ptak et al. (2007) Ptak, A., Mobasher, B., Hornschemeier, A., Bauer, F., & Norman, C. 2007, ApJ, 667, 826
- Puccetti et al. (2009) Puccetti, S., Vignali, C., Cappelluti, N., et al. 2009, ApJS, 185, 586
- Salvato et al. (2011) Salvato, M., Ilbert, O., Hasinger, G., et al. 2011, ApJ, 742, 61
- Schinnerer et al. (2010) Schinnerer, E., Sargent, M. T., Bondi, M., et al. 2010, ApJS, 188, 384
- Scoville et al. (2007) Scoville, N., Abraham, R. G., Aussel, H., et al. 2007, ApJS, 172, 38
- Swartz et al. (2004) Swartz, D. A., Ghosh, K. K., Tennant, A. F., & Wu, K. 2004, ApJS, 154, 519
- Thomas et al. (2005) Thomas, D., Maraston, C., Bender, R., & Mendes de Oliveira, C. 2005, ApJ, 621, 673
- Trinchieri & Fabbiano (1985) Trinchieri, G., & Fabbiano, G. 1985, ApJ, 296, 447
- Tzanavaris & Georgantopoulos (2008) Tzanavaris, P., & Georgantopoulos, I. 2008, A&A, 480, 663
- White & Sarazin (1991) White, R. E., III, & Sarazin, C. L. 1991, ApJ, 367, 476
- Wolter & Trinchieri (2004) Wolter, A., & Trinchieri, G. 2004, A&A, 426, 787