The NIST compilation of ionization potentials revisited (I): From He-like to Xe-like ions
Gabriel Gil1,2 and Augusto Gonzalez11Institute of Cybernetics, Mathematics and Physics, Havana, Cuba
2CNR Institute of Nanosciences S3, Modena, Italy
Abstract
The National Institute of Standards and Technology (NIST) database on ionization potentials for neutral atoms and ions is examined. For each isoelectronic sequence, we construct a regularized perturbative series that exactly matches the large- and regions. Comparison of the NIST data with this series allows the identification of problematic values in the reported data.
pacs:
32.30.-r, 32.10.Hq, 31.15.-p
Physics is indeed a mature science. Large amounts of data, of very different kinds, have been accumulated along decades. Sometimes, a fresh look at these compilations, on the basis of simple -physically meaningful- models, leads to a qualitative understanding of the data.
In previous papers PRA1 ; PRA2 , on the basis of the scaling characteristic of Thomas-Fermi theory TF , we have shown that both the NIST data on ionization potentials of atomic ions NIST , and the correlation energies of atomic ions can be accomodated along single universal curves.
In the present work, we go a step further and develop a simple model allowing the identification of problematic isolated reported values for the ionization potentials in a particular isoelectronic sequence. Because of the fact that the compilation is very often used for different purposes, indications of which data could be wrong and should be re-examined is of great importance. For instance, as commented in Refs. [Sansonetti, ] and [Nandy, ], accurate description of the spectra is useful in order to model some dynamical features of stellar sources, and also to interpret astronomical data.
Our model for the ionization potential is a smooth interpolation that matches both the large- (heavy ion) and the (anion) regions.RPT We call it the “regularized perturbation theory” (RPT). We have used similar approaches in order to compute the energy of relatively large quantum dots,qdot atomic ions in a harmonic trap,htrap_a neutral atoms in traps,htrap_b and Rydberg-like impurity levels in a quantum well.qwell
The RPT series for the ionization potential of an -electron atomic ion with nuclear charge is written as (atomic units are used everywhere):RPT ; ourMPLB
(1)
Coefficients and are obtained from the large- limit.RPT comes from the leading term (free electrons in the nuclear field), whereas is computed in the next-to-leading approximation, where Coulomb repulsion between electrons is perturbatively treated. Relativistic corrections should be included because the NIST data span the range of nuclear charges up to very heavy ions, i.e. . Detailed expressions for and , with explicit relativistic corrections, can be found in Ref. [RPT, ].
The next two terms of the series have the functional form suggested by higher-order perturbation theory on the Coulomb repulsion. However, in order to determine them, we shall follow a different strategy. We force expression (1) to match the expected value and the slope at .RPT In this sense, it is a “regularized perturbative series”. These conditions are written as follows:
(2)
is the electron affinity of the neutral atom with electrons.RSC The slope , on the other hand, is computed in terms of and , the latter is a characteristic radius of the -electron system, which we estimate as the covalent radius.ourMPLB Note that . The expression of the slope makes use of the fact that, at , the outer electron interacts with a neutral core. Thus, the interaction is short-ranged and the wave function at large distances is solely determined by the binding energy, i.e. . We use this function in order to perturbatively compute the residual Coulomb interaction of the outer electron with the core, when is slightly displaced from . The explicit expression for was derived earlier in Ref. [ourMPLB, ].
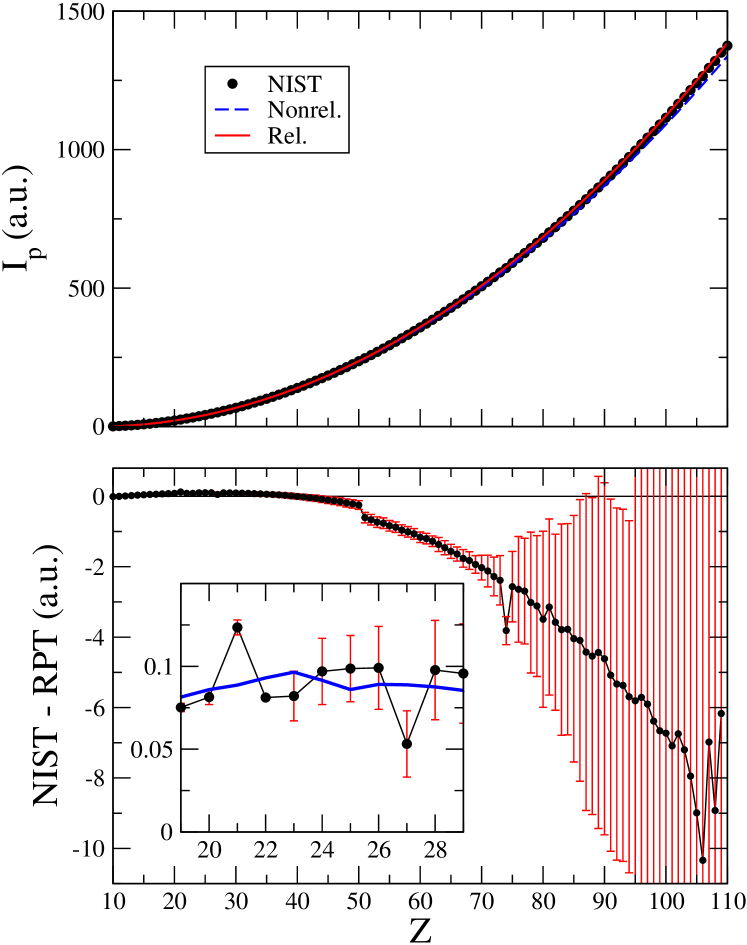
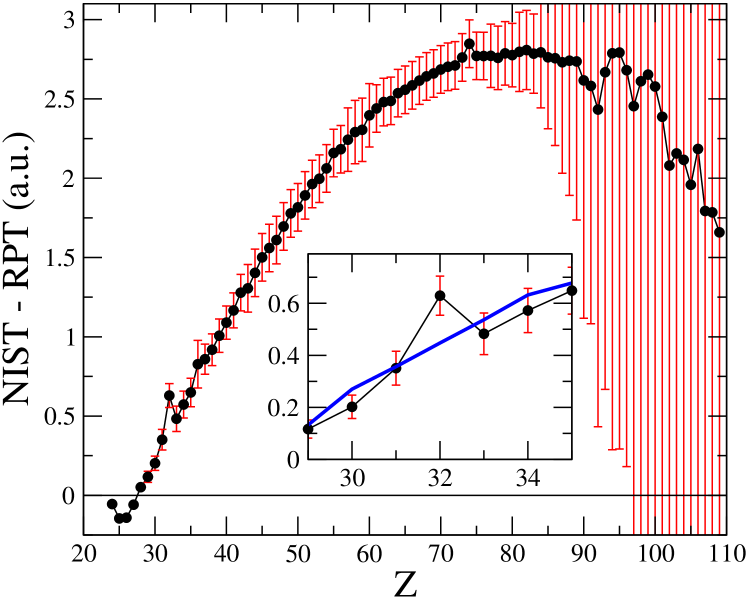
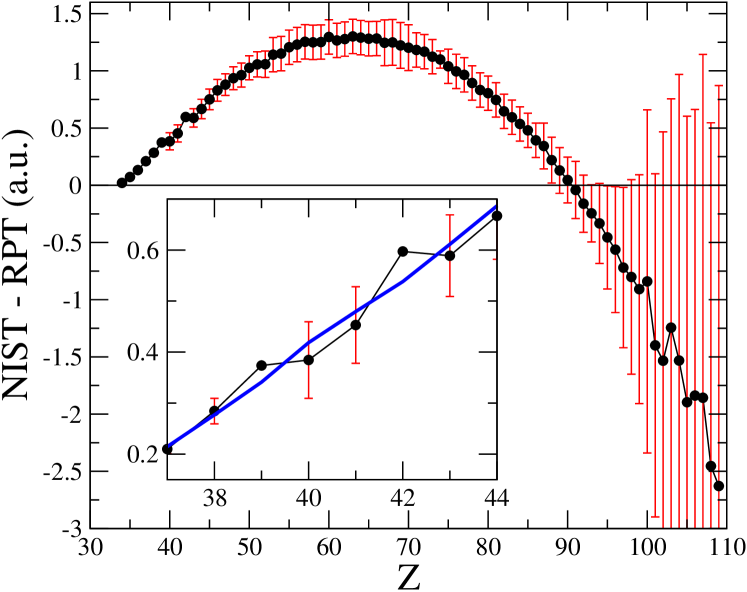
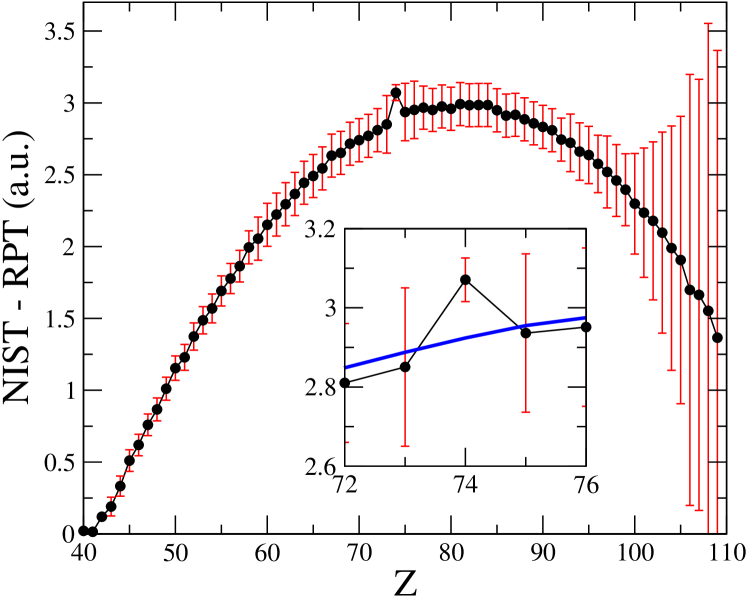
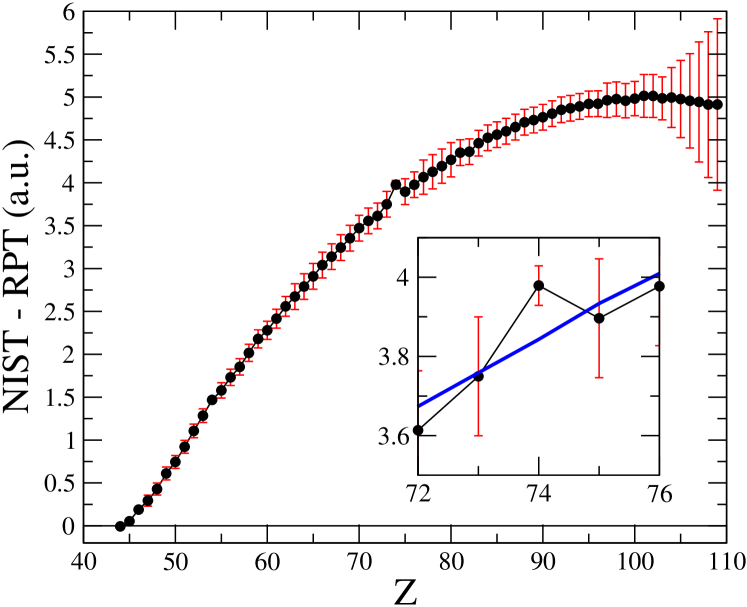
Once the coefficients in Eq. (1) are determined, our RPT series provides an interpolation for intermediate values of . We show in Fig. 1, in quality of example, the series for Ne-like ions () along with the corresponding NIST data.
Some comments should be added to this figure. First, NIST reported values are experimental points only when is very close to . For larger , data come from calculations or interpolations. Thus, we expect relatively high errors in this regime. Relative deviations of the RPT from NIST data are only a few percents in the intermediate- region, which is a common feature of interpolants.qdot ; htrap_a ; htrap_b ; qwell
Second, the dependence of on is smooth. In the upper panel, it is difficult to distinguish a problematic point, even if we change the scale. An abrupt change in could only be related to a rearrange of the occupied electronic levels. This may take place at specific values of , also reported in the NIST compilation. Thus, in spite of the fact that our RPT series lacks of spectroscopic precision, every jump or deviation in NIST-RPT, not coinciding with a spectrum rearrangement point, can be taken as a signature of possible errors. Problematic points are identified by comparison with a smoothed curve, which we construct by means of a 5-points running average.
Figure 1: (Color online) Ne-like ions (). Upper panel: Ionization potentials taken from the NIST compilation along with our nonrelativistic (discontinuous, blue) and relativistically corrected (continuous, red) RPT predictions versus atomic number. Curves are smooth at any scale. Lower panel: The difference between NIST reported values and the relativistic RPT series versus atomic number. Reported error bars are shown. Inconsistencies at , 22, 27, 74, and the abrupt jump at are noticed. A 5-points running average curve (blue line) is used to identify problematic points, as shown in the inset. We point out also a great dispersion of the data for .
The remarkable deviations at ,W-ions1 and the abrupt jump at ,Dirac-Fock1 just to mention a few examples common to many of the isoelectronic sequences, are clear indications of deficiencies in the computed data reported by NIST. The dispersion of the data for very heavy ions should also motivate a reconsideration of the Dirac-Fock calculations.Dirac-Fock1
In the appendices, we examine isoelectronic sequences (five rows of the Mendeleev Table), from He-like to Xe-like ions. In this range, only the sequences which do not have a stable singly charged anion are excluded. Heavier ions, from La-like to Ac-like, are to be analyzed in a subsequent paper NISTrev2 .
We hope that the present analysis will be helpful in order to improve the reference data.
Acknowledgements.
The authors are grateful to the Caribbean Network for Quantum Mechanics, Particles and Fields (ICTP) for support. G.G. also acknowledge financial support from the European Community’s FP7 through the Marie Curie ITN-INDEX.
Appendix A The He-like sequence ()
RPT coefficients:
Conditions at :
(3)
The slope was computed from and . Here, and in the analysis below, data for and are taken from Ref. RSC, .
Figure 2: (Color online) The He-like systems (). The difference between NIST values and the relativistic RPT versus atomic number. Error bars are very small and can not be seen in the scale of the figure. No inconsistencies were detected.
Discussion:
Let us comment on some features of the He-like case. In the range , the difference between our RPT series and the reported values is very well behaved. In the intermediate region, the maximum relative error is around .
When , NIST-RPT rises. NIST ionization potentials in the range come mainly from ab intio QED calculations by Artemyev et al., HeQED which include finite nuclear-size effects. Our perturbative treatment of relativity cannot reproduce their results for very large .
Appendix B Second row elements
B.1 The Be-like sequence ()
RPT coefficients:
Conditions at :
(4)
The slope was computed from and .
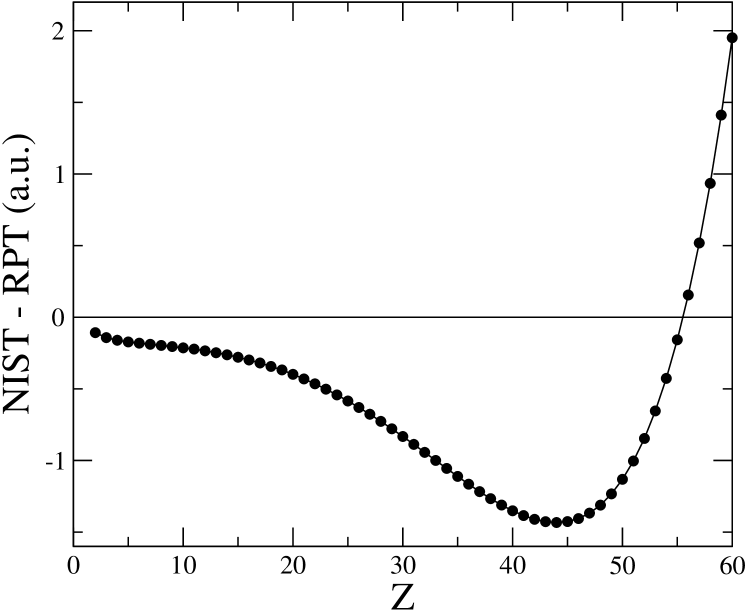
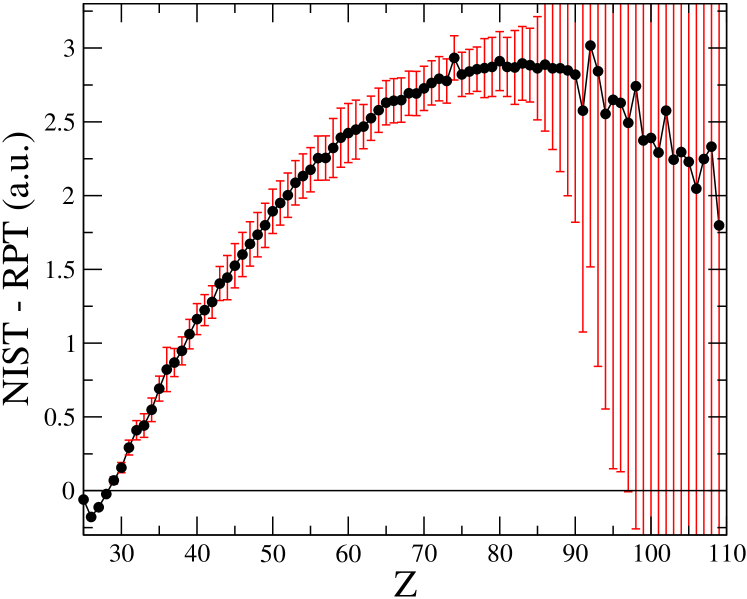
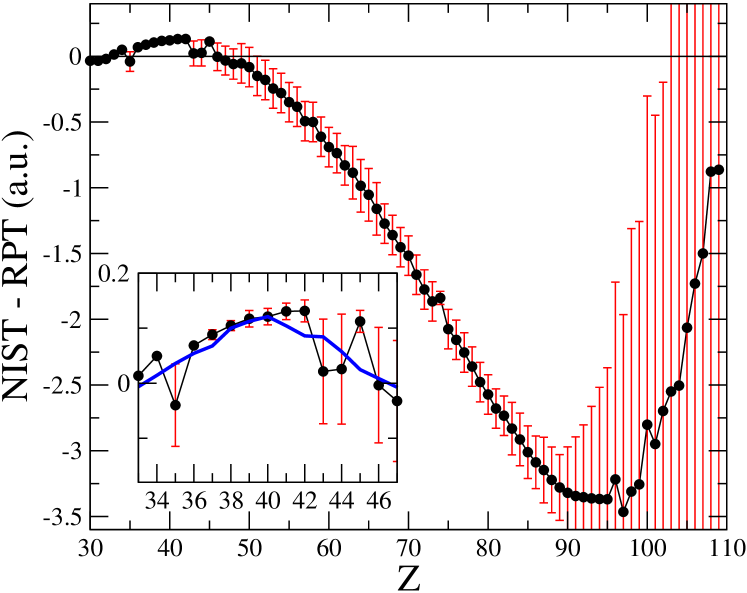
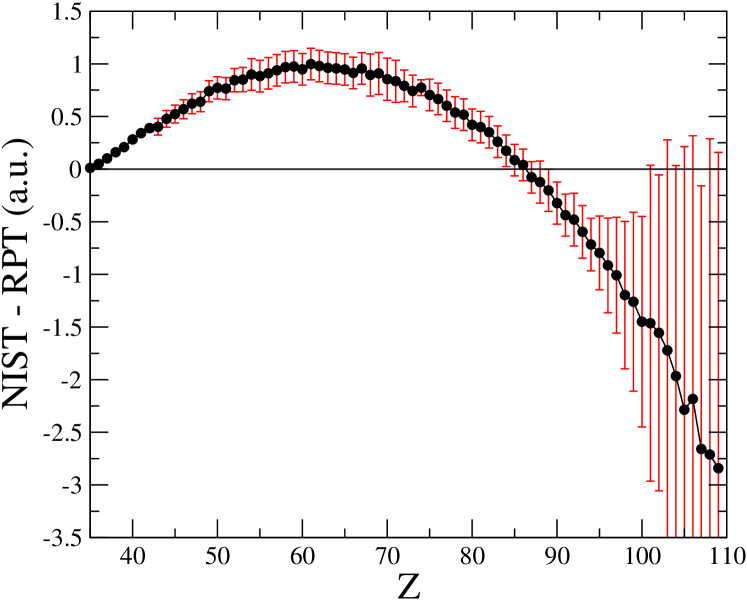
Figure 3: (Color online) The Be-like isoelectronic sequence (). The abrupt jump at can be, however, accomodated within error bars.
Discussion:
The comparison between NIST and RPT values for the Be-like sequence shows an abrupt jump of a.u. at (see Fig. 3). These are numbers based on Dirac-Fock calculations of computed by different groups. When , numbers come from Ref. [Interpol_N42-50, ], whereas for almost all reported numbers come from Rodrigues et al. Dirac-Fock1 . We notice that, in Ref. [Interpol_N42-50, ], a formula like Eq. (1) is used as a fit to correct the computed values.
The observed jump is consistent with the natural dispersion of points, as suggested by the reported error bars. Thus, no inconsistency is detected.
B.2 The C-like sequence ()
RPT coefficients:
Conditions at :
(5)
The slope was computed from and .
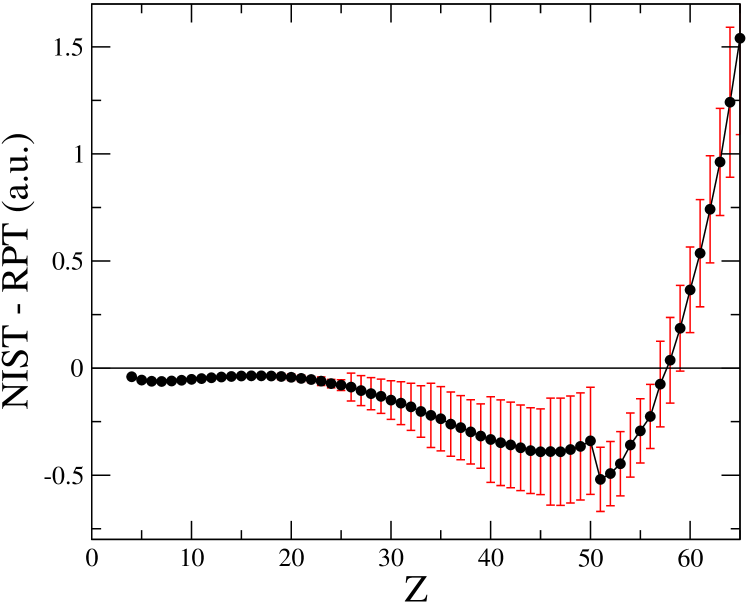
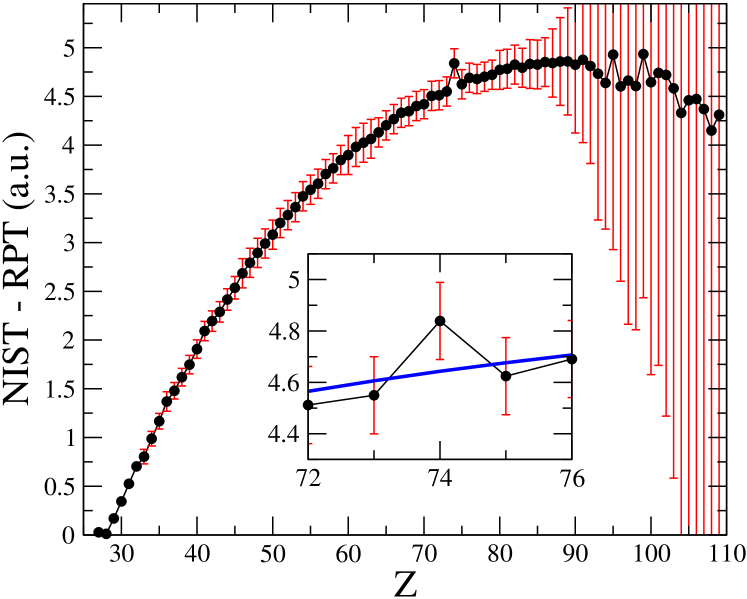
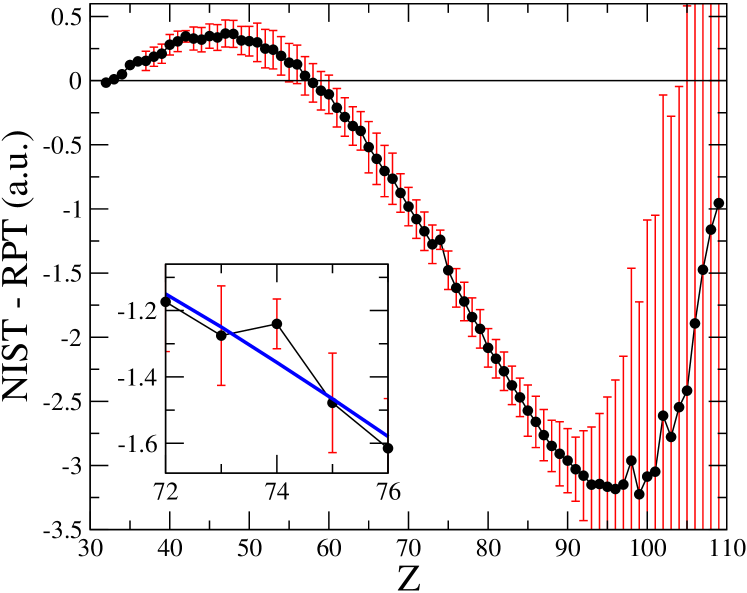
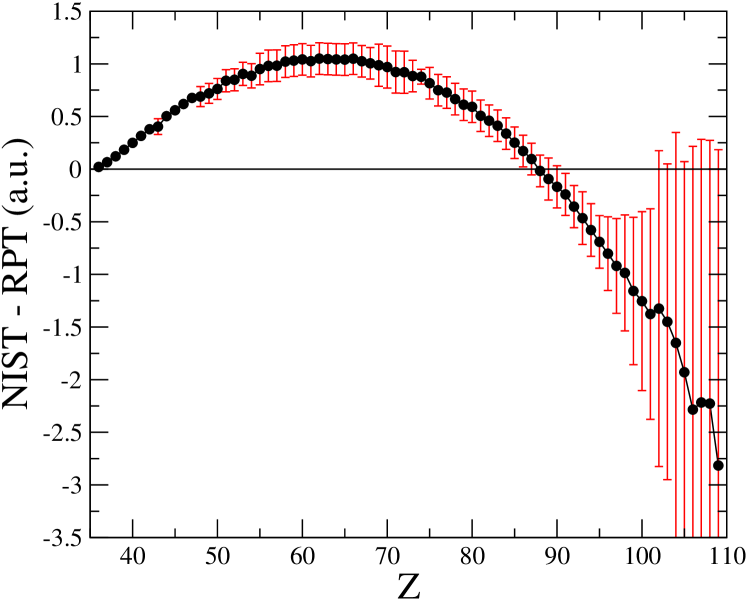
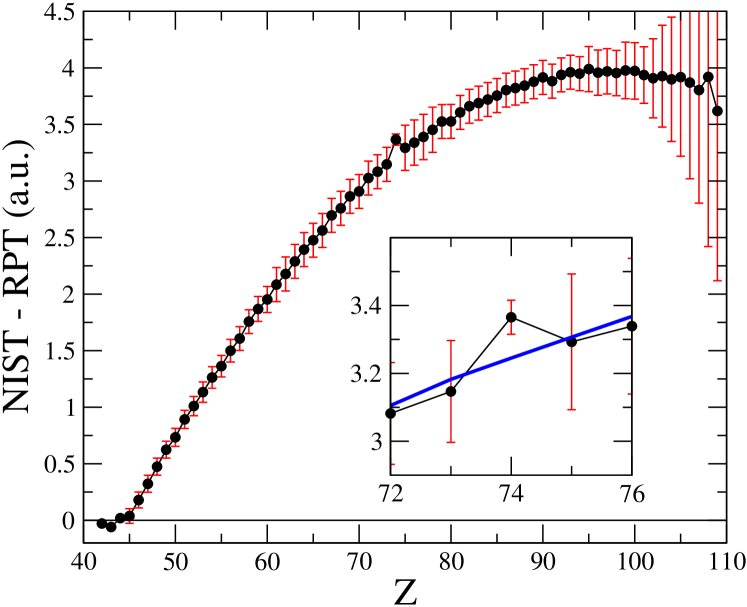
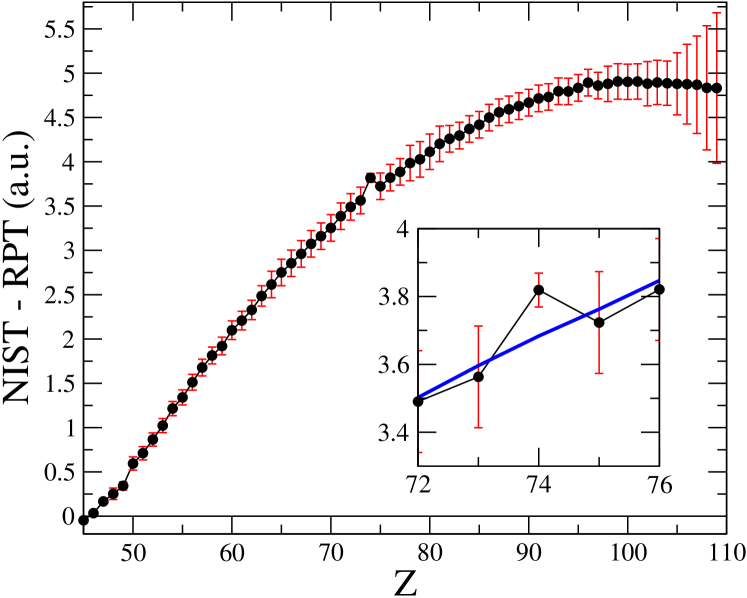
Figure 4: (Color online) The C-like systems (). An inconsistency at and an abrupt jump at ) are noticed.
Discussion:
Analysis of Fig. 4 (C-like sequence) also shows an abrupt jump of nearly a.u. at . As in the Be-like case, this jump is associated to changes in the calculation methodology.
However, the jump exactly equals the reported error bars. Thus, we recommend revision of this data.
In addition, an apparent deviation in the ionization potential is noticed at . This number, corresponding to a tungsten heavy ion (W+68), was collected by NIST compilers Kramida and Reader with the help of a semi-empirical approach W-ions1 . Comparison with the average curve suggests that the reported value for W+68 is overestimated in 1.577 a.u.
B.3 The N-like sequence ()
RPT coefficients:
Conditions at :
(6)
The slope was computed from and .
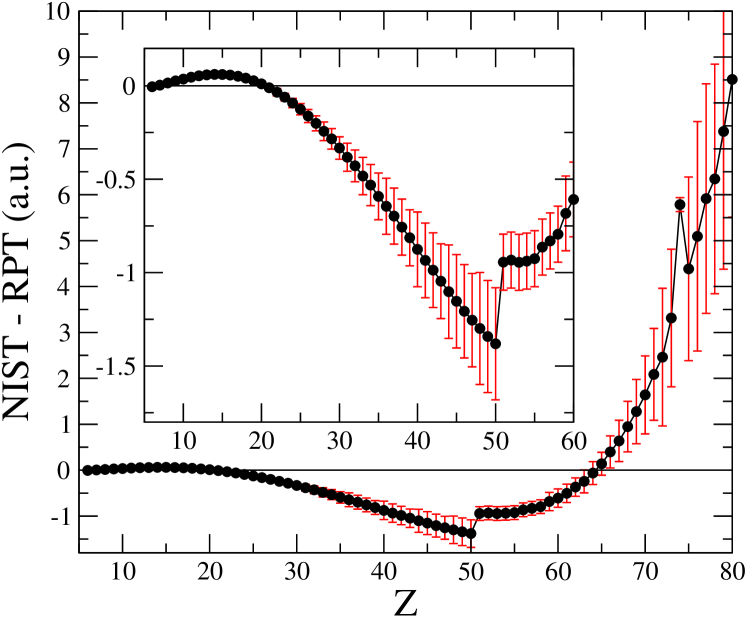
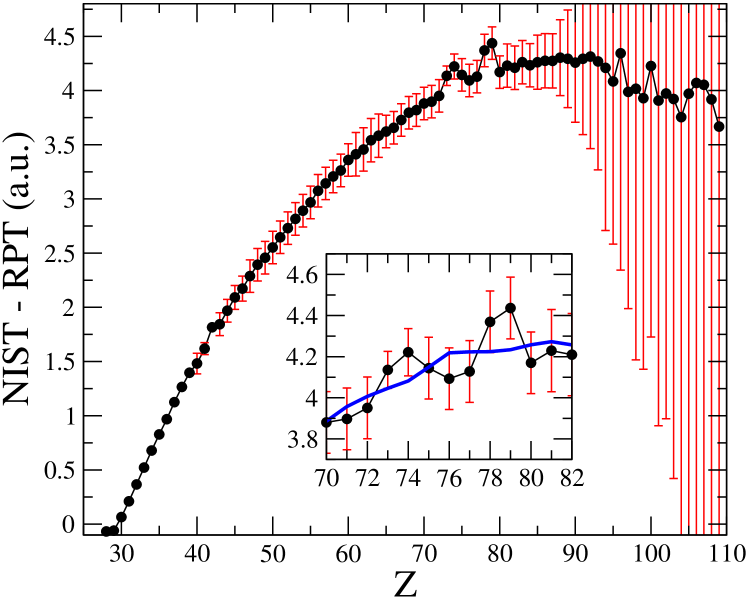
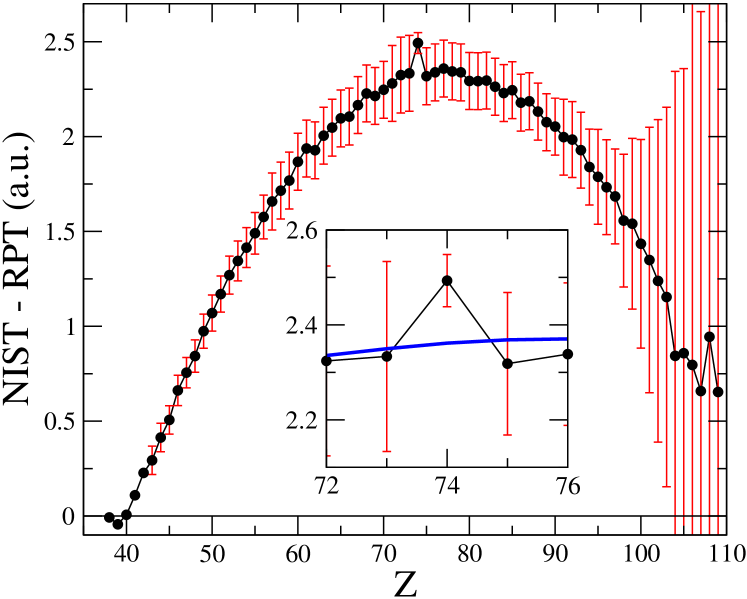
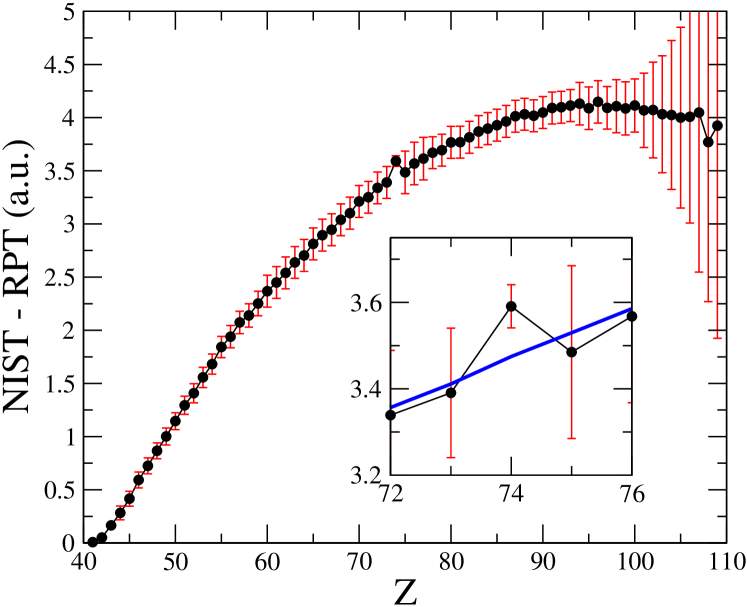
Figure 5: (Color online) The N-like ions (). Deviations at and 74, and a strong dispersion of points in the region are noticed. However, the latter is consistent with the relatively high error bars.
Discussion:
The N-like sequence (Fig. 5) presents noticeable jumps at and, once more, at .
The ionization potential for was taken from the paper by Sugar and Corliss.Sugar According to our procedure, an overestimation of 0.051 a.u. is noticed.
The case is again taken from Ref. [W-ions1, ]. It seems to be an inconsistent point, underestimated by a.u.
Data for come from the Dirac-Fock calculations by Biémont et al. Interpol_N42-50 The reported large uncertainties in the data, of around a.u., are consistent with the observed deviations.
Besides, the great dispersion for , questions the consistency of Dirac-Fock calculations by Rodrigues et al.Dirac-Fock1 for highly charged ions. Notice, however, that deviations are within error bars, which are remarkably high (from to a.u.) for .
B.4 The F-like sequence ()
RPT coefficients:
Conditions at :
(7)
The slope was computed from and .
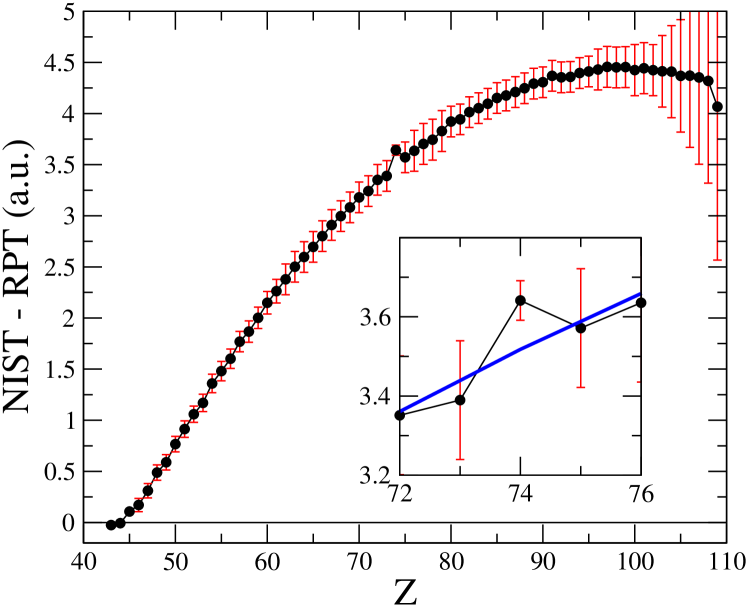
Figure 6: (Color online) The F-like sequence (). There are remarkable inconsistencies at and 74. The jump at is within error bars.
Discussion:
In the F-like sequence (Fig. 6), high deviations are noticed for and 74. for comes from Ref. [Sugar, ], the very same paper by Sugar and Corliss cited in the N-like case. According to our Fig., it seems to be overestimated in 0.183 a.u.
On the other hand, belongs to the case of tungsten ions (W+65), and the value is, once more, taken from Ref. [W-ions1, ]. In this case, an underestimation of 1.071 a.u. is apparent.
Finally, the observed jump at is consistent with the reported error bars, and there is also a great dispersion of the data for , coming again from the Dirac-Fock calculations of Ref. [Dirac-Fock1, ]. It is also worth mentioning the large error bars accompanying the data for .
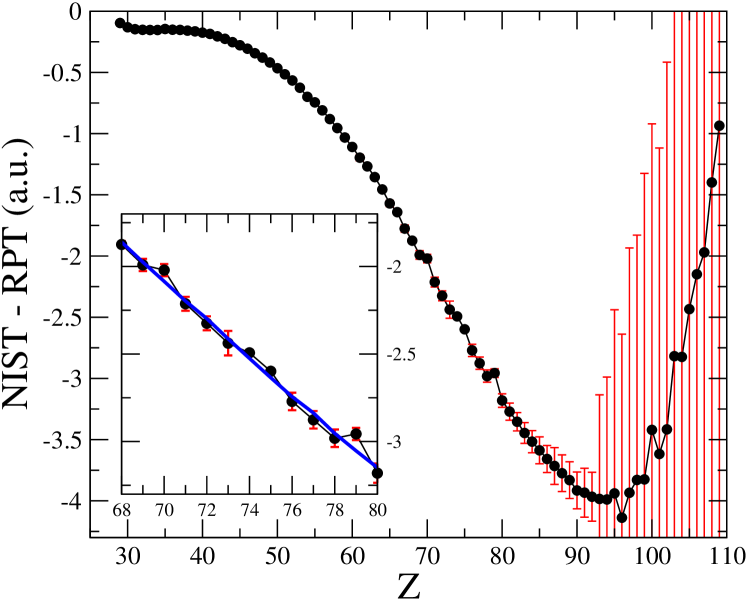
B.5 The Ne-like sequence ()
RPT coefficients:
Conditions at :
(8)
The slope was computed from and .
Discussion:
In the Ne-like sequence (Fig. 1), deviations at , 22, and 27 are noticed. Points are related to Ref. [Sugar, ]. We suggest correcting these values in -0.034, +0.012 and +0.036 a.u., respectively.
The case, W-ions1 is also clearly inconsistent. The ionization potential seems to be underestimated in 1.077 a.u.
The previously discussed abrupt jump at , should be revised by the NIST team because the jump is greater than the data uncertainty.
Finally, the great dispersion of points for , related to the Dirac-Fock calculations in Ref. Dirac-Fock1, , are within uncertainty bars.
Appendix C Third row elements
C.1 The Mg-like sequence ()
RPT coefficients:
Conditions at :
(9)
The slope was computed from and .
Figure 7: (Color online) Mg-like systems (). Inconsistencies at , 24, 25, 27 and 28, and a jump at are apparent.
Discussion:
The Mg-like sequence (Fig. 7) of ions shows clear deviations at , 24, 25, 27 and 28.Sugar The figure suggests corrections of -0.015, -0.013, +0.026, -0.008 and -0.016 a.u. to these points, respectively.
The jump at was discussed above. It is clearly not consistent with error bars, thus we suggest revision of these data.
C.2 The Si-like sequence ()
RPT coefficients:
Figure 8: (Color online) The Si-like sequence (). Deviations at and Z=74 are remarkable.
Conditions at :
(10)
The slope was computed from and .
Discussion:
It seems that there is a group of four points, , out of the general trend. Thus, we use a 7-points running average (instead of 5-points) in order to create a smooth curve. We suggest using the top of the error bars as values for , and the bottom of the error bars for .
The point, on the other hand, should be corrected in -0.329 a.u.
C.3 The P-like sequence ()
RPT coefficients:
Conditions at :
(11)
The slope was computed from and .
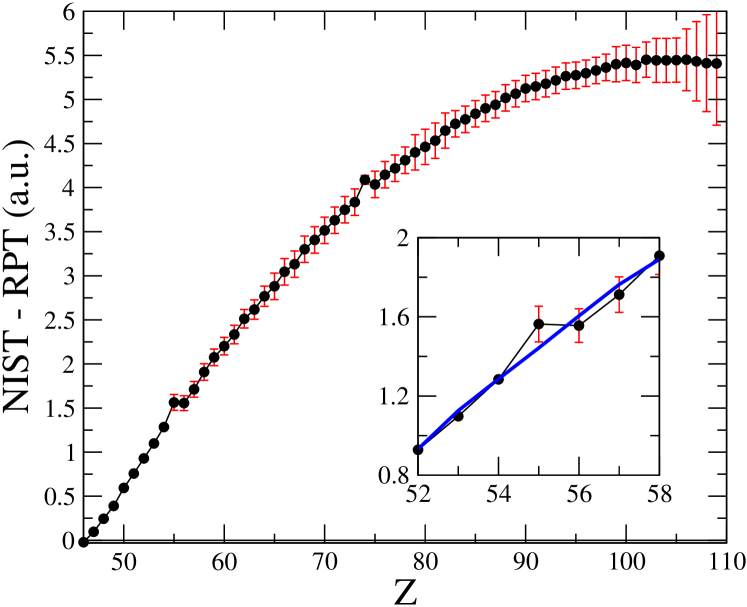
Figure 9: (Color online) The P-like systems (). A big jump at , and a noticeable deviation at are apparent.
Discussion:
We suggest a revision of the data near , and correcting the value in + 0.247 a.u.
C.4 The S-like sequence ()
RPT coefficients:
Figure 10: (Color online) The S-like ions (). The only detected inconsistency is the deviation at .
Conditions at :
(12)
The slope was computed from and .
Discussion:
Although error bars are relatively high in this case, we suggest a correction of + 0.249 a.u. to the value of .
C.5 The Cl-like sequence ()
RPT coefficients:
Conditions at :
(13)
The slope was computed from and .
Figure 11: (Color online) Cl-like systems (). The jump at , and the deviation at are noticeable.
Discussion:
Although error bars are relatively high in this case, we suggest a revision of the data near , which show a jump of 0.216 a.u., and using in the case the top value of the error bar.
C.6 The Ar-like sequence ()
Figure 12: (Color online) The Ar-like systems (). In this case, we distinguish only the deviation at .W-ions1
RPT coefficients:
Conditions at :
(14)
The slope was computed from and .
Discussion:
Although error bars are relatively high, we suggest using the top of the error bar as the value of .
Appendix D Four row elements
D.1 The Ca-like sequence ()
RPT coefficients:
Figure 13: (Color online) The Ca-like systems (). Only the point is distinguished.
Conditions at :
(15)
The slope was computed from and .
Discussion:
The Ca-like sequence is the first with a rearrangement of the electronic spectrum with the increase of . For the last two electrons occupy the 4s subshell, whereas for larger they move to the 3d orbital. The observed jump at is surely related to this fact.
On the other hand, we suggest using for at the bottom of its error bar.
D.2 The Sc-like sequence ()
RPT coefficients:
Figure 14: (Color online) The Sc-like systems (). Only the point is distinguished.
Conditions at :
(16)
The slope was computed from and .
Discussion:
Very similar to the Ca sequence. We suggest correcting at in -0.224 a.u.
D.3 The Ti-like sequence ()
RPT coefficients:
Conditions at :
(17)
The slope was computed from and .
Figure 15: (Color online) Ti-like systems (). Only the point is distinguished.
Discussion:
Very similar to the previous sequences. We suggest correcting at in -0.205 a.u.
D.4 The V-like sequence ()
RPT coefficients:
Figure 16: (Color online) The V-like ions (). No inconsistencies were detected.
Conditions at :
(18)
The slope was computed from and .
D.5 The Cr-like sequence ()
RPT coefficients:
Figure 17: (Color online) The Cr-like sequence (). An apparent deviation at
is detected.
Conditions at :
(19)
The slope was computed from and .
Discussion:
In the Cr-like sequence, we shall distinguish the problematic point at , coming from the paper by Sugar and Musgrove Sugar1 . is overestimated in 0.181 a.u.
D.6 The Mn-like sequence ()
RPT coefficients:
Figure 18: (Color online) The Mn-like systems (). No inconsistency is detected.
Conditions at :
(20)
The slope was computed from and .
D.7 The Co-like sequence ()
Figure 19: (Color online) The Co-like sequence (). The only detected inconsistency is at .
RPT coefficients:
Conditions at :
(21)
The slope was computed from and .
Discussion:
at is overestimated in 0.196 a.u.
D.8 The Ni-like sequence ()
RPT coefficients:
Conditions at :
(22)
The slope was computed from and .
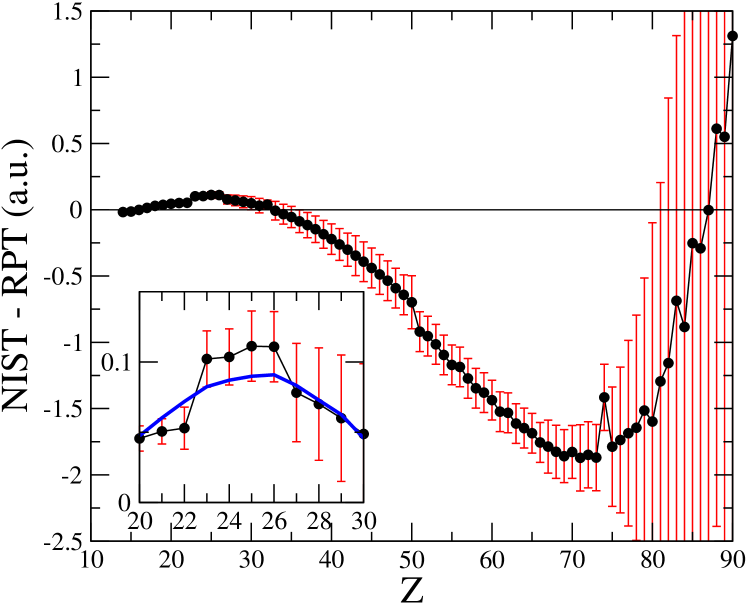
Figure 20: (Color online) The Ni-like systems (). Inconsistencies are detected at , 74, and 79.
Discussion:
The Ni-like ions (Fig. 20) shows deviations at , 74 and 79, the latter coming from the paper by Tragin et al.Tragin .
As suggested by the figure, at is overestimated in 0.071 a.u. Corrections of -0.141 and -0.203 a.u. should be added to the points at and 79, respectively.
D.9 The Cu-like sequence ()
RPT coefficients:
Conditions at :
(23)
The slope was computed from and .
Figure 21: (Color online) Cu-like systems (). Small deviations at and 79 are noticed.
Discussion:
In the Cu-like sequence (Fig. 21), slight deviations at and 79 are apparent. The data come from Ref. [Tragin, ]. Points seem to be overestimated in 0.064 and 0.097 a.u., respectively.
D.10 The Zn-like sequence ()
RPT coefficients:
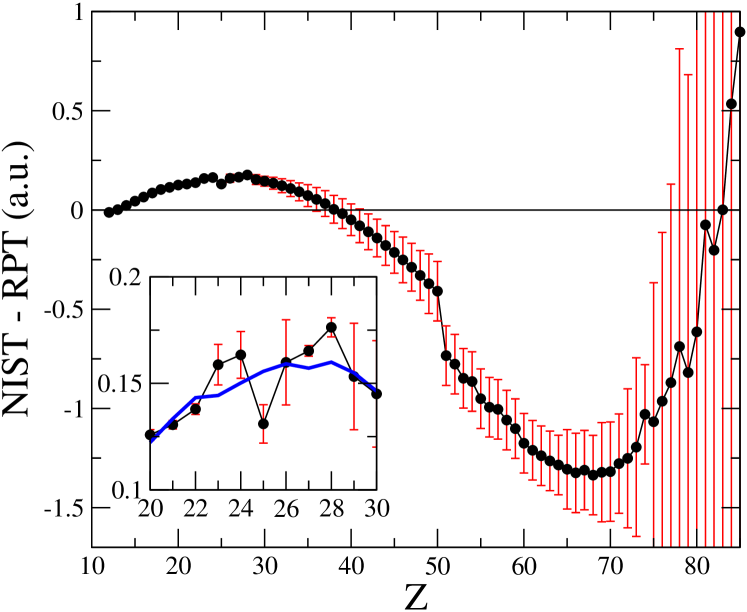
Figure 22: (Color online) The Zn-like systems (). Inconsistencies are noticed at , 42, 45 and 74.
Conditions at :
(24)
The slope was computed from and .
Discussion:
In Fig. 22 (the Zn-like sequence), the data for is taken from the Dirac-Fock calculation of Ref. [Dirac-Fock1, ], while the value for is due to Refs. [Sugar2, ] and [Litzen, ]. These potentials should be corrected in +0.076 and -0.045 a.u., respectively.
On the other hand, ionization potential was collected from the relativistic multireference many-body perturbation theory calculations of Vilkas et al. Vilkas . It seems to be overestimated in 0.087 a.u.
The ionization potential comes from Ref. [W-ions1, ], as before. It is 0.103 a.u. higher than the average curve.
D.11 The Ge-like sequence ()
RPT coefficients:
Conditions at :
(25)
Figure 23: (Color online) Ge-like ions (). Only the point is distinguished.
The slope was computed from and .
Discussion:
at is overestimated in 0.116 a.u.
D.12 The As-like sequence ()
RPT coefficients:
Conditions at :
(26)
The slope was computed from and .
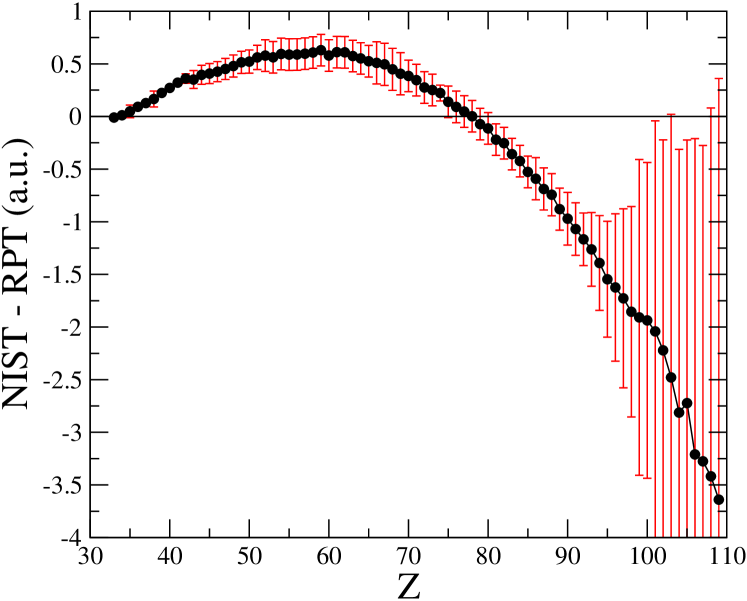
Figure 24: (Color online) The As-like systems (). No inconsistencies are detected.
D.13 The Se-like sequence ()
RPT coefficients:
Conditions at :
(27)
The slope was computed from and .
Figure 25: (Color online) The Se-like sequence (). Slight deviations at and 42 are apparent.
Discussion:
In Fig. 25 (the Se-like sequence), we detect inconsistencies at and 42. at seems to be overestimated in 0.033 a.u.
The number for in Mo+18 (i.e. , ) comes from Refs. [Khatoon, ] and [Sugar2, ]. It seems to be 0.059 a.u. higher than the average curve.
D.14 The Br-like sequence ()
RPT coefficients:
Figure 26: (Color online) Br-like systems (). A smooth curve. No inconsistencies are detected.
Conditions at :
(28)
The slope was computed from and .
D.15 The Kr-like sequence ()
Figure 27: (Color online) The Kr-like systems (). No inconsistencies are detected.
RPT coefficients:
Conditions at :
(29)
The slope was computed from and .
Appendix E Fifth row elements
E.1 The Sr-like sequence ()
Figure 28: (Color online) The Sr-like systems (). An apparent deviation at W-ions1 is shown.
RPT coefficients:
Conditions at :
(30)
The slope was computed from and .
Discussion:
at is overestimated in 0.132 a.u.
E.2 The Y-like sequence ()
RPT coefficients:
Conditions at :
(31)
The slope was computed from and .
Figure 29: (Color online) The Y-like systems (). The only detected inconsistency is at W-ions1 .
Discussion:
at should be corrected in -0.148 a.u.
E.3 The Zr-like sequence ()
RPT coefficients:
Figure 30: (Color online) The Zr-like sequence (). The point is distinguished.
Conditions at :
(32)
The slope was computed from and .
Discussion:
at shows an overestimation of 0.147 a.u.
E.4 The Nb-like sequence ()
RPT coefficients:
Figure 31: (Color online) The Nb-like systems (). The only detected inconsistency is the point.W-ions1
Conditions at :
(33)
The slope was computed from and .
Discussion:
at is overestimated in 0.116 a.u.
E.5 The Mo-like sequence ()
RPT coefficients:
Conditions at :
(34)
The slope was computed from and .
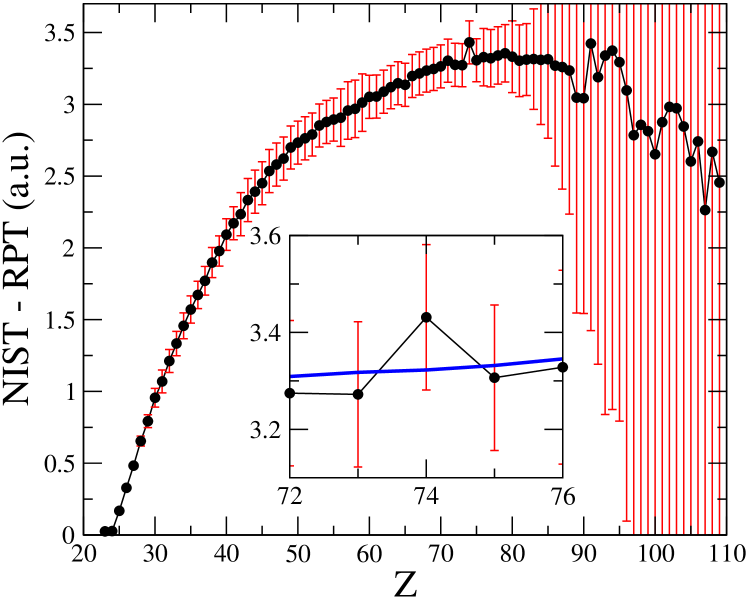
Figure 32: (Color online) The Mo-like ions (). The only inconsistent point is W-ions1 .
Discussion:
at should be corrected in -0.120 a.u.
E.6 The Tc-like sequence ()
RPT coefficients:
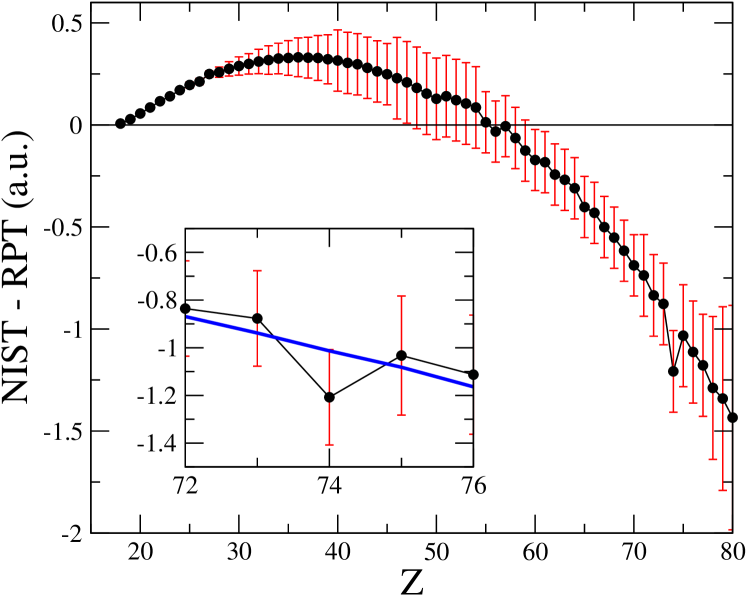
Figure 33: (Color online) The Tc-like ions (). Only the point is distinguished.W-ions1 .
Conditions at :
(35)
The slope was computed from and .
Discussion:
Notice that at is systematically overestimated (since the Ca sequence). This time in 0.123 a.u.
E.7 The Ru-like sequence ()
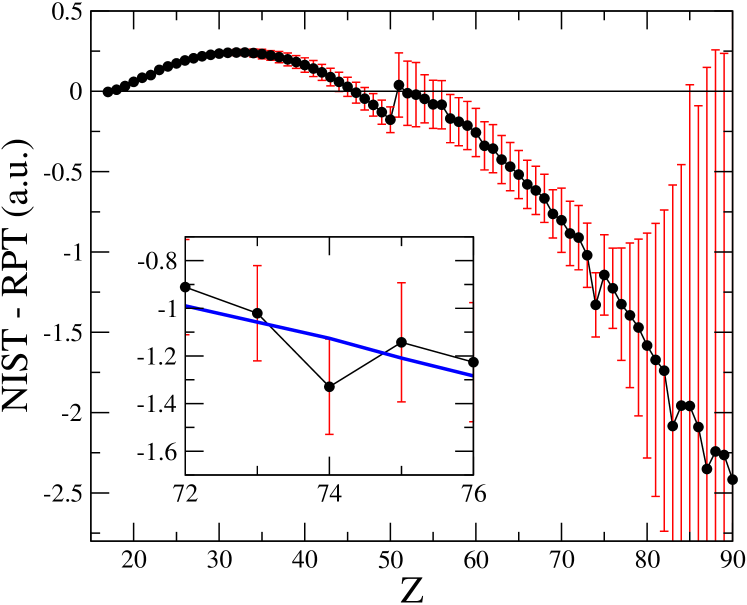
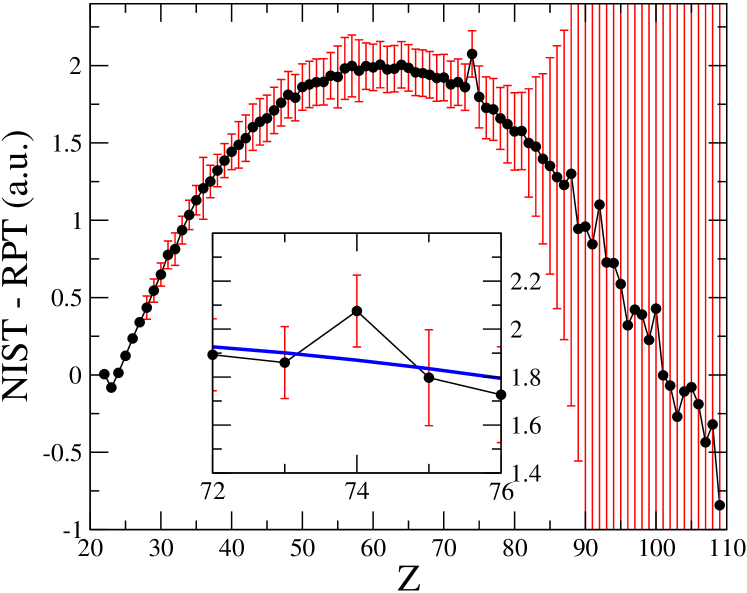
Figure 34: (Color online) The Ru-like systems (). An inconsistency at is apparent.
RPT coefficients:
Conditions at :
(36)
The slope was computed from and .
Discussion:
at is overestimated in 0.136 a.u.
E.8 The Rh-like sequence ()
Figure 35: (Color online) Rh-like systems (). There are apparent inconsistencies at Dirac-Fock1 and W-ions1 .
RPT coefficients:
Conditions at :
(37)
The slope was computed from and .
Discussion:
at is underestimated in 0.072 a.u., whereas the point is 0.136 a.u. higher than the average curve.
E.9 The Pd-like sequence ()
RPT coefficients:
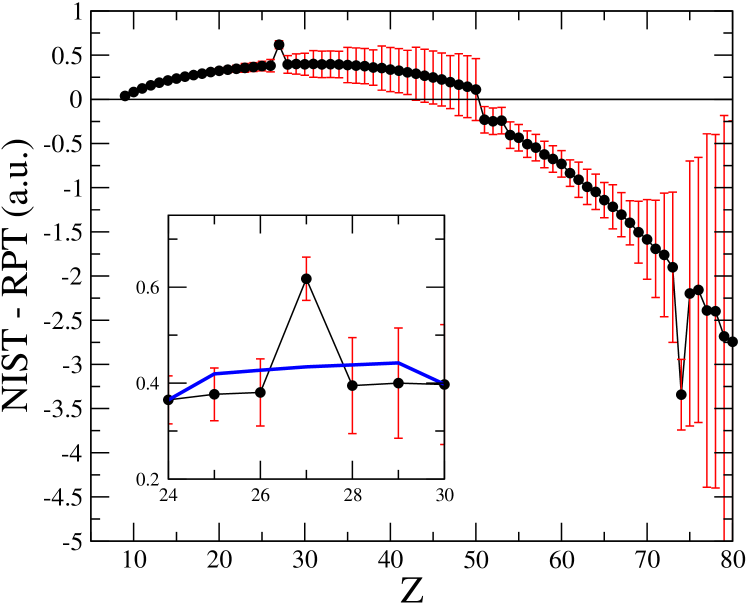
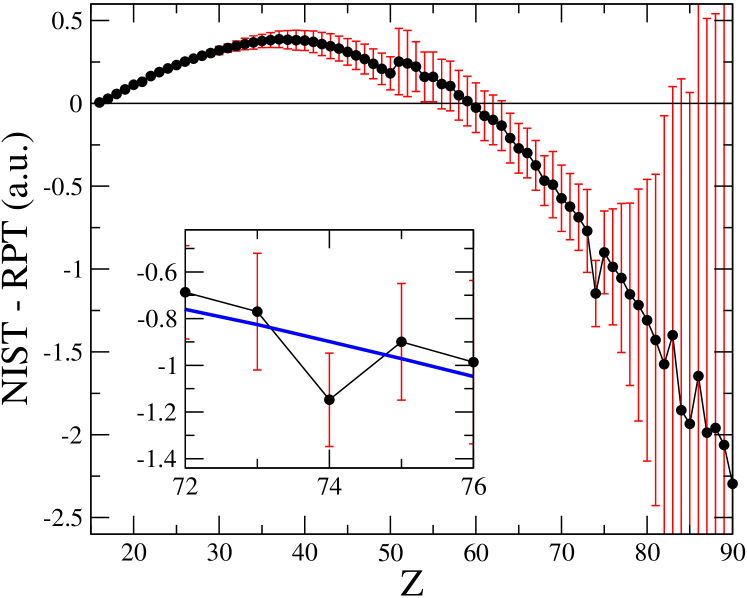
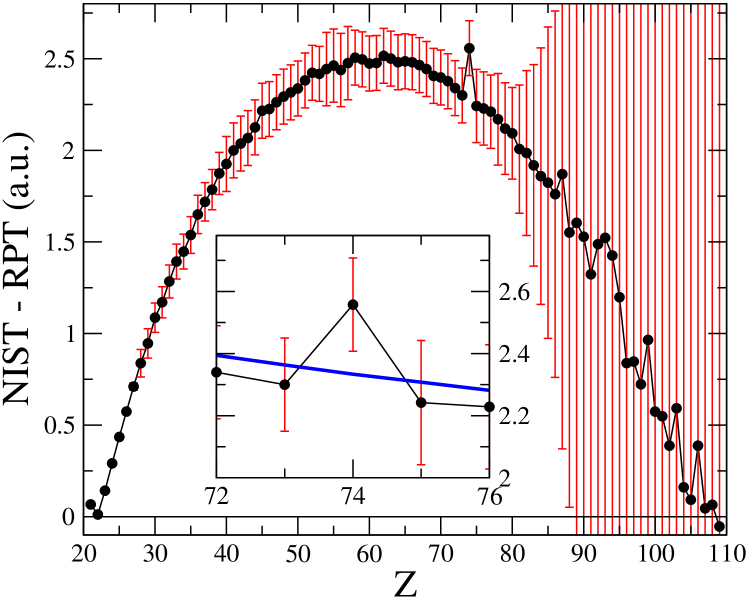
Figure 36: (Color online) The Pd-like sequence (). Inconsistencies at and 74 are noticed.
Conditions at :
(38)
The slope was computed from and .
Discussion:
In the Pd-like sequence (Fig. 36), in addition to , an apparent inconsistency at comes from the experimental work of Churilov et al.Churilov The and 74 points are, respectively, 0.120 and 0.118 a.u. above the average curve.
E.10 The Ag-like sequence ()
RPT coefficients:
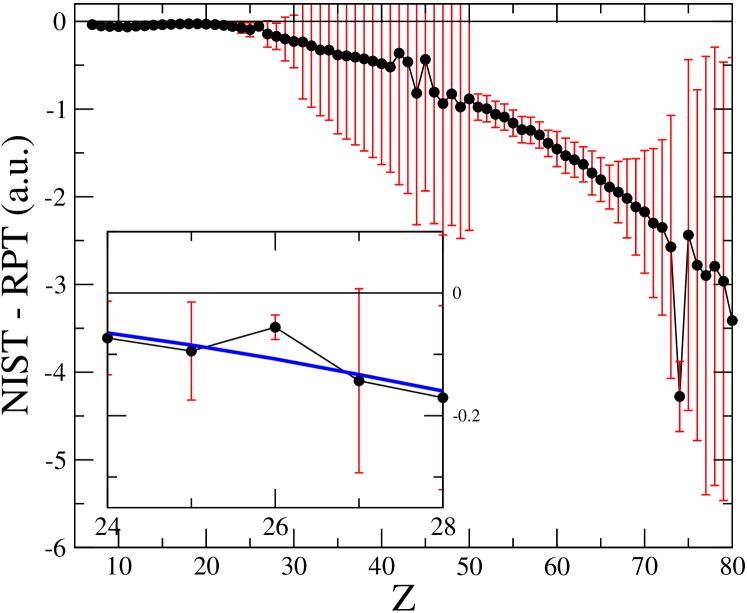
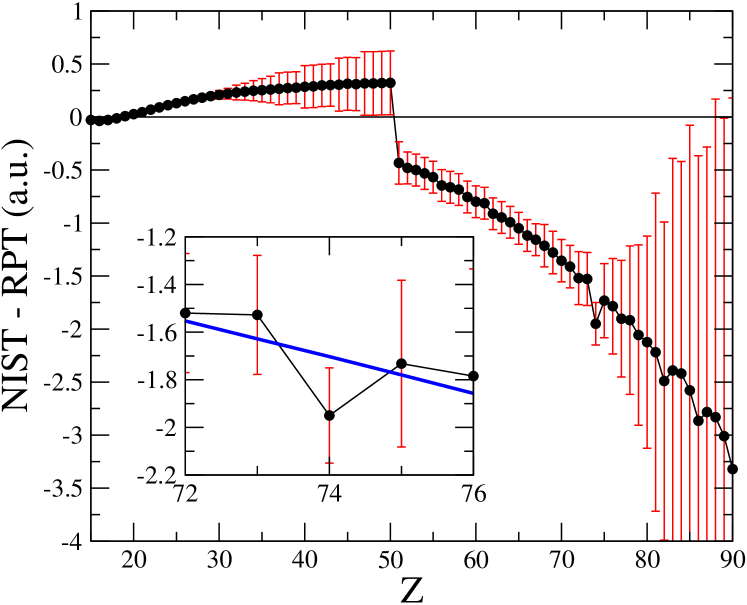
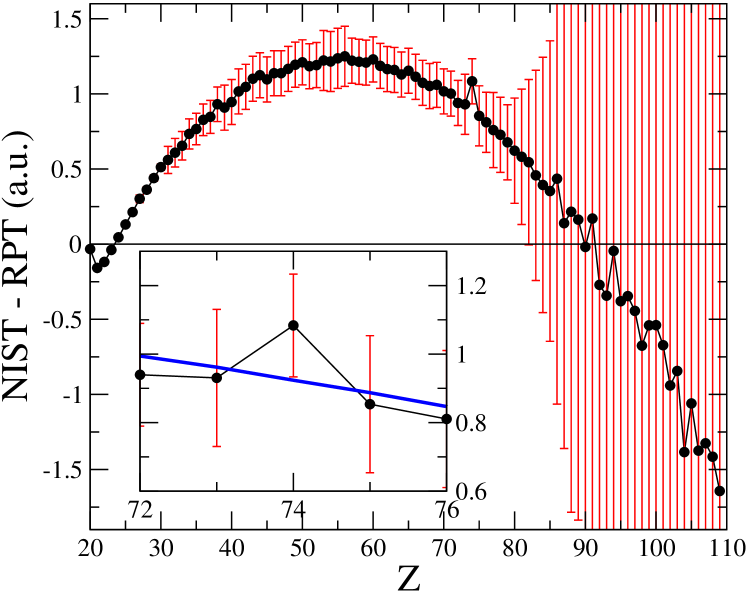
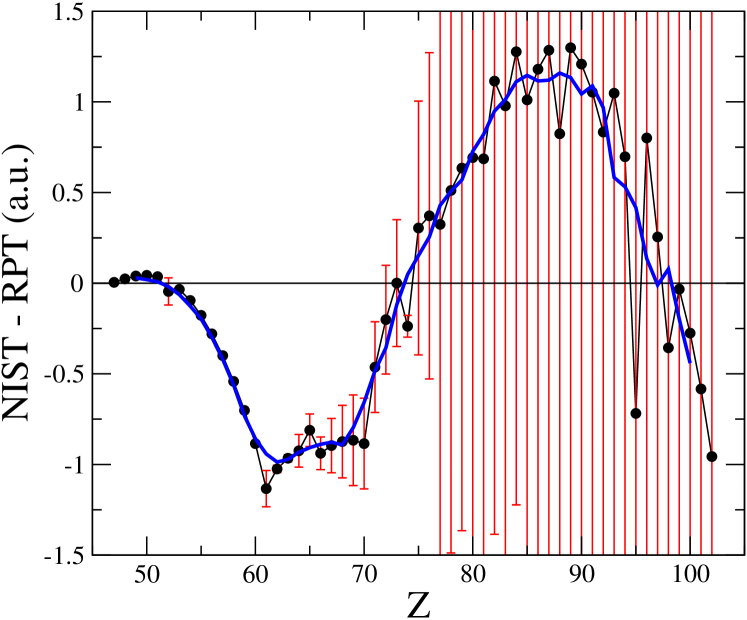
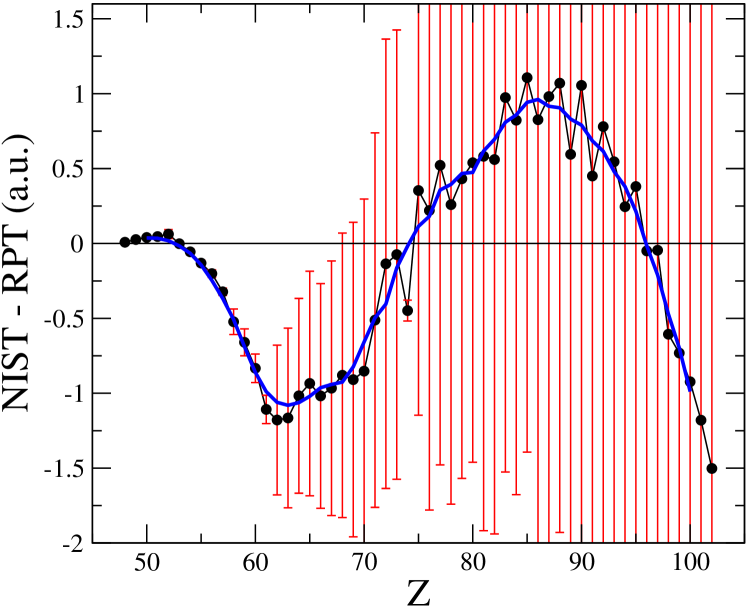
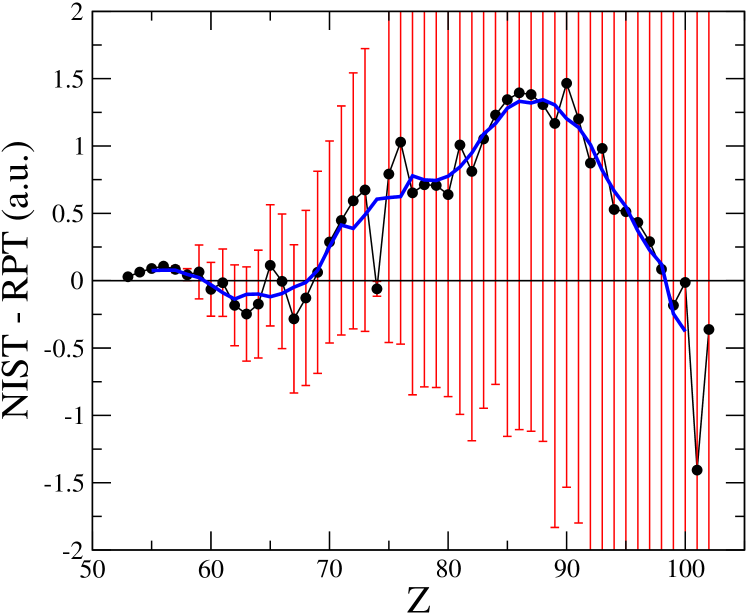
Figure 37: (Color online) The Ag-like systems (). The average curve is drawn (blue) in order to identify problematic points. Inconsistencies at and 74 are apparent. The ) point also distinghuishes in spite of its huge error bar.
Conditions at :
(39)
The slope was computed from and .
Discussion:
A qualitatively different picture appears in the Ag-like sequence, Fig. 37. The maximum of diminished, as compared with the Pd-like sequence, but the dispersion of points has significantly increased.
The problematic point at comes from Ref. [Dirac-Fock1, ]. It seems to be 0.191 a.u. below the average curve. at , on the other hand, is underestimated in 0.275 a.u.
Data for is the entire responsibility of Carlson et al.Carlson , who employ a simple spherical shell model in order to compute the ionization potentials. The indicated error bars are very high. The point, with a deviation of -1.134 a.u. should, however, be noticed.
E.11 The Cd-like sequence ()
RPT coefficients:
Conditions at :
(40)
The slope was computed from and .
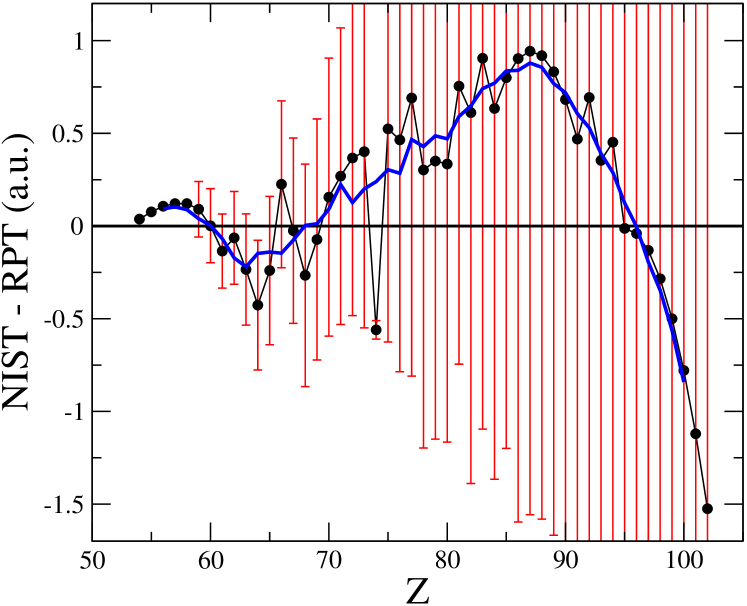
Figure 38: (Color online) The Cd-like systems (). The only inconsistent point is .
Discussion:
at is underestimated in 0.431 a.u.
E.12 The Sn-like sequence ()
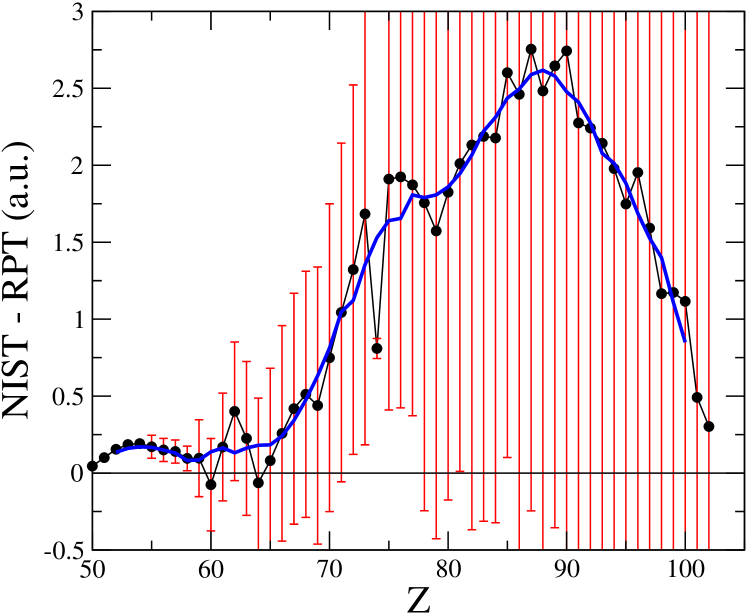
Figure 39: (Color online) The Sn-like systems (). A deviation at W-ions1 is apparent.
RPT coefficients:
Conditions at :
(41)
The slope was computed from and .
Discussion:
at shows a huge deviation of -0.720 a.u. We may notice also that, apparently, there are crossing points at and 64. Thus the group of points in should be below the axis. However, we do not have a precise way of estimating these potentials.
E.13 The Sb-like sequence ()
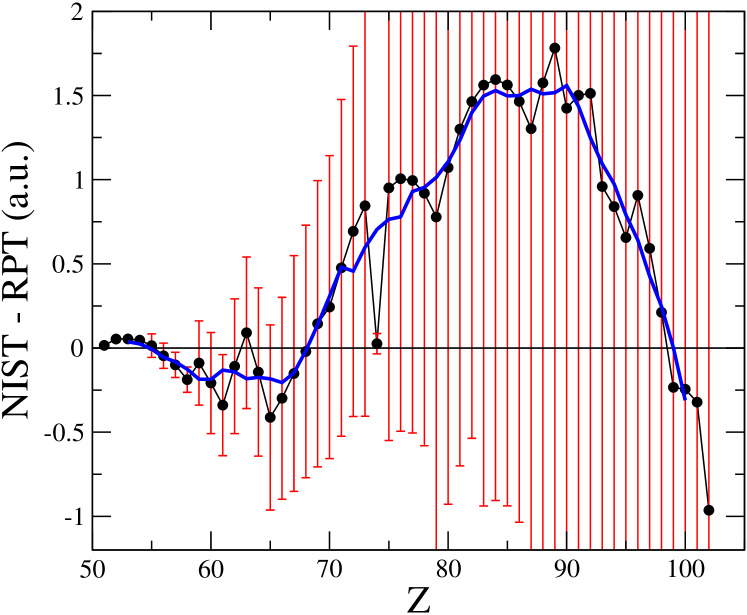
Figure 40: (Color online) The Sb-like sequence (). The W-ions1 point is distinguished.
RPT coefficients:
Conditions at :
(42)
The slope was computed from and .
Discussion:
at is underestimated in -0.678 a.u. We have stressed previously the problem of ions for Sn-like case. A similar comment applies here.
E.14 The Te-like sequence ()
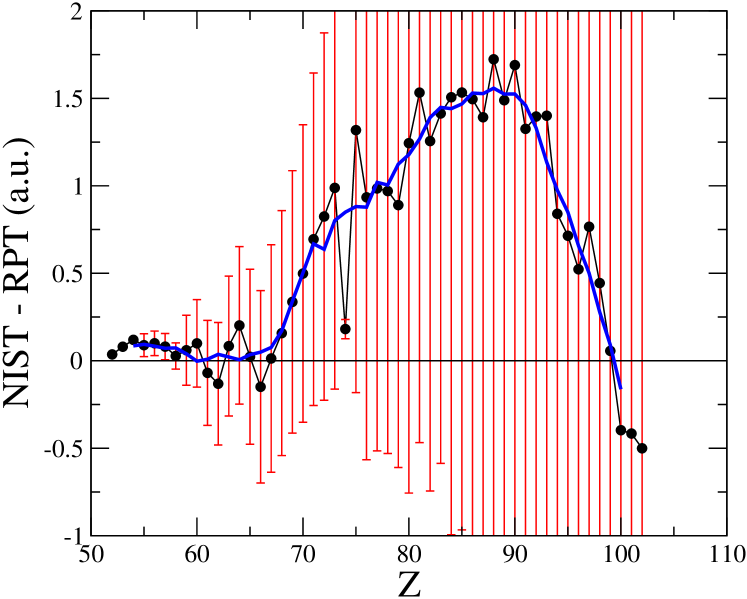
Figure 41: (Color online) The Te-like systems (). A marked deviation at W-ions1 is noticed.
RPT coefficients:
Conditions at :
(43)
The slope was computed from and .
Discussion:
at is 0.668 a.u. below the average curve.
E.15 The I-like sequence ()
RPT coefficients:
Figure 42: (Color online) The case of I-like systems (). An inconsistency is detected at .
Conditions at :
(44)
The slope was computed from and .
Discussion:
at is 0.668 a.u. below the average curve. Notice that underestimation of this point is systematical since the Ag sequence.
E.16 The Xe-like sequence ()
RPT coefficients:
Conditions at :
(45)
The slope was computed from and .
Figure 43: (Color online) The Xe-like systems (). Only the point shows a clear inconsistency.
Discussion:
at is underestimated in 0.799 a.u.
References
(1) R. Carcasses and A. Gonzalez, Phys. Rev. A 80, 024502 (2009).
(2) A. Odriazola, A. Gonzalez and E. Rasanen, Phys. Rev. A 90, 052510 (2014).
(4) A. Kramida, Yu. Ralchenko, J. Reader, and NIST ASD Team (2012). NIST Atomic Spectra Database (ver. 5.0), [Online]. Available: http://physics.nist.gov/asd [2013, March 4]. National Institute of Standards and Technology, Gaithersburg, MD.
(5) C.J. Sansonetti, G. Nave, J. Reader, F. Kerber, The Astrophysical Journal Supplement Series, 202, 15 (2012).
(6) D.K. Nandy and B.K. Sahoo, A&A 563, A25 (2014).
(7) G. Gil and A. Gonzalez, arXiv:1309.4392 (2013). Submitted.
(8) A. Matulis and F.M. Peeters, J. Phys.: Cond. Matter 6, 7751 (1994).
(9) A. Gonzalez, A. Perez, Int. J. Mod. Phys. B 12, 2129 (1998).
(10) A. Gonzalez, B. Partoens, A. Matulis, F.M. Peeters, Phys. Rev. B 59 (3), 1653 (1998).
(11) A. Gonzalez, I. Mikhailov, Int. J. Mod. Phys. B 11, 3469 (1997).
(12) G. Gil, A. Gonzalez, Mod. Phys. Lett. B 27, 1350178 (2013).
(13) Royal Society of Chemistry website http://www.rsc.org/periodic-table/. Data References: W.M. Haynes (ed.) CRC Handbook of Chemistry and Physics, CRC Press, Boca Raton, 2011; G.W.C. Kaye and T.H. Laby, Tables of Physical and Chemical Constants, Longman, Essex, 1995.
(14) A.E. Kramida, J. Reader, At. Data Nucl. Data Tables 92, 457 (2006).
(15) G.C. Rodrigues, P. Indelicato, J.P. Santos, P. Patté, F. Parente, At. Data Nucl. Data Tables 86, 117 (2004).
(16) G. Gil and A. Gonzalez, The NIST compilation of ionization potentials revisited (II): From La-like to Ac-like ions, in preparation.
(17) A.N. Artemyev, V.M. Shabaev, V.A. Yerokhin, G. Plunien, and G. Soff, Phys. Rev. A 71, 062104 (2005).
(18) E. Biémont, Y. Frémat, P. Quinet, At. Data Nucl. Data Tables 71, 117 (1999).
(19) J. Sugar, C. Corliss, J. Phys. Chem. Ref. Data 14, Suppl. 2, 1 (1985).
(20) J. Sugar and A. Musgrove, J. Phys. Chem. Ref. Data 22, 1213 (1993).
(21) N. Tragin, J.-P. Geindre, C. Chenais-Popovics, J.-C. Gauthier, J.-F. Wyart, E. Luc-Koenig, Phys. Rev. A 39, 2085 (1989).
(22) M.J. Vilkas, Y. Ishikawa, K. Hirao, Chem. Phys. Lett. 321, 243 (2000).
(23) S. Khatoon, M. S. Z. Chaghtai, and K. Rahimullah, Phys. Scr. 19, 22 (1979).
(24) J. Sugar and A. Musgrove, J. Phys. Chem. Ref. Data 17, 155 (1988).
(25) U. Litzén and J. Reader, Phys. Rev. A 36, 11 (1987).
(26) S.S. Churilov, Y.N. Joshi, and A.N. Ryabtsev, J. Phys. B 27, 5485 (1994).
(27) T.A. Carlson, C.W. Nestor Jr., N. Wasserman, J.D. Mcdowell, At. Data Nucl. Data Tables 2, 63 (1970).