Sheared stably stratified turbulence and large-scale waves in a lid driven cavity
Abstract
We investigated experimentally stably stratified turbulent flows in a lid driven cavity with a non-zero vertical mean temperature gradient in order to identify the parameters governing the mean and turbulent flows and to understand their effects on the momentum and heat transfer. We found that the mean velocity patterns (e.g., the form and the sizes of the large-scale circulations) depend strongly on the degree of the temperature stratification. In the case of strong stable stratification, the strong turbulence region is located in the vicinity of the main large-scale circulation. We detected the large-scale nonlinear oscillations in the case of strong stable stratification which can be interpreted as nonlinear internal gravity waves. The ratio of the main energy-containing frequencies of these waves in velocity and temperature fields in the nonlinear stage is about 2. The amplitude of the waves increases in the region of weak turbulence (near the bottom wall of the cavity), whereby the vertical mean temperature gradient increases.
pacs:
47.27.te, 47.27.-iI Introduction
A number of studies of turbulent transport in lid-driven cavity flow have been conducted in the past, because the lid-driven cavity is encountered in many practical engineering and industrial applications, and serves as a benchmark problem for numerical simulations. Detailed discussions of the state of the art of the different studies of isothermal and temperature stratified lid-driven turbulent cavity flows have been published in several reviews (see, e.g. Refs. SD00, ; KI08, ).
Fluid flow and heat transfer in rectangular cavities driven by buoyancy and shear have been studied numerically and experimentally in a number of publications (see, e.g., Refs. TD72, ; SK83, ; KSR84, ; KS84, ; KSA84, ; KSB84, ; KS85, ; KSN85, ; KP89, ; II89, ; MJ92, ; KS93, ; IHK93, ; MAV94, ; MV94, ; MV95, ; IH95, ; PK96, ; LC96, ; AR99, ; SMN02, ; OD04, ; LFG11, ). In particular, three-dimensional laminar lid-driven cavity flow have been studied experimentally and numerically (see Refs. KS85, ; KSN85, ; KS93, ), whereby the Taylor-Gortler like (TGL) longitudinal vortices, as well as other general flow structures, have been found. In the isothermal flow, both the number of vortex pairs and their average size increases as the Reynolds number increases in spite of the lateral confinement of the flow. Different effects in a mixed convection in a lid driven cavity have been investigated in the past (see, Refs. MJ92, ; MV94, ; PK96, ; LC96, ; SMN02, ; OD04, ). Excitation of an instability in a lid-driven flow was studied in Ref. II89, ; LFG11, numerically and experimentally. In addition, lid-driven flow in a cube filled with a tap water have been experimentally investigated in Ref. LFG11, to validate the numerical prediction of steady-oscillatory transition at lower than ever observed Reynolds number. The authors of Ref. LFG11, reported that their experimental observations agree with the numerical simulations that demonstrated the existence of the large amplitude oscillatory motions in a lid-driven cavity flow.
There are several studies on lid driven cavity flow with stable stratification. Results of comprehensive experimental studies of flow patterns and mixing in a stably-stratified, lid-driven water cavity flow were reported in Ref. KSN85, . These experiments were conducted in the range of Reynolds number from to and in the range of the bulk Richardson numbers from to . Stable stratification was controlled by varying temperatures of the upper and bottom walls of the cavity. The authors observed a strongly three dimensional flow with TGL vortices which was partially turbulent. Experiments revealed the existence of the primary and secondary circulation cells with alternating sign of vorticity.
Three-dimensional numerical simulation in a shallow driven cavity have been conducted for a stably stratified fluid heated from the top moving wall and cooled from below for a wide range of Rayleigh numbers and Richardson numbers (see Ref. MV95, ). It was found that an increase of the buoyancy force prevents the return flow from penetrating to the bottom of the cavity. The fluid is recirculated at the upper portion of the cavity, and the upper recirculation induces shear on the lower fluid layer and forms another weak recirculated flow region. Multicellular flow becomes evident when the Richardson number is larger than and may produce waves that propagate along the transverse direction. Strong secondary circulation, and separated flow are evident for the Richardson number is about . The rate of the heat transfer increases as the Richardson number decreases.
The two-dimensional and three-dimensional numerical simulations in a driven cavity have been conducted for a stably stratified fluid heated from the top moving wall over broad ranges of the parameters (see Refs. IHK93, ; IH95, ). It was found that when the Richardson number is very small, the gross flow characteristics are akin to the conventional driven-cavity flows, as addressed by earlier studies. In this case the isotherm surfaces maintain a fair degree of two-dimensionality. When the Richardson number increases, the primary and meridional flows are confined to the upper region of the cavity. In the middle and lower parts of the cavity, fluid tends to be stagnant, and heat transfer is mostly conductive.
There are only a few experimental studies on lid driven turbulent cavity flow with stable stratification. In particular, stably-stratified flows in a three-dimensional lid-driven cavity have been experimentally studied in order to examine the behavior of longitudinal Taylor-Gortler-like vortices (see Refs. KSR84, ; KS84, ; KSA84, ; KSB84, ; KI08, ). It was found that the Taylor-Gortler vortices appear in all situations and they are generated in the region of concave curvature of the flow above a surface of separation in the shear flow. In the stably stratified flow, the vortices appear to enhance the mixing as they convolute the interface. In the unstably stratified flow, where the forced and free convection effects are approximately in balance, the Taylor-Gortler vortices are still formed. However, there are a few Taylor-Gortler vortex pairs and their size is small. The Taylor-Gortler vortices arise in the region of the downstream secondary eddy and corner vortices along the end-walls. At higher Reynolds numbers the flow is unsteady in the region of the downstream secondary eddy and exhibits some turbulent properties.
Stably stratified sheared turbulent flows are of a great importance in atmospheric physics. Since Richardson (1920), it was generally believed that in stationary homogeneous atmospheric flows the velocity shear becomes incapable of maintaining turbulence when the Richardson number exceeds some critical value (see, e.g., Refs. CHA61, ; MY71, ; MIL86, ). The latter assertion, however, contradicts to atmospheric measurements, experimental evidence and numerical simulations (see, e.g., Refs. SF01, ; BAN02, ; PAR02, ; MO02, ; LA04, ; M14, ). Recently an insight into this long-standing problem has been gained through more rigorous analysis of the turbulent energetics involving additional budget equations for the turbulent potential energy and turbulent heat flux, and accounting for the energy exchange between turbulent kinetic energy and turbulent potential energy (see, Refs. ZKR07, ; ZKR08, ; ZKR09, ; ZKR13, ). This analysis opens new prospects toward developing consistent and practically useful turbulent closures for stably stratified sheared turbulent flows.
The main goal of this study is to investigate experimentally stably stratified turbulent flows in a lid driven cavity in order to identify the parameters governing the mean and turbulent flows and to understand their effects on the momentum and heat transfer. This paper is organized as follows. Section II describes the experimental set-up and instrumentation. The results of laboratory study of the stably stratified sheared turbulent flow and comparison with the theoretical predictions are described in Section III. Finally, conclusions are drawn in Section IV.
II Experimental set-up
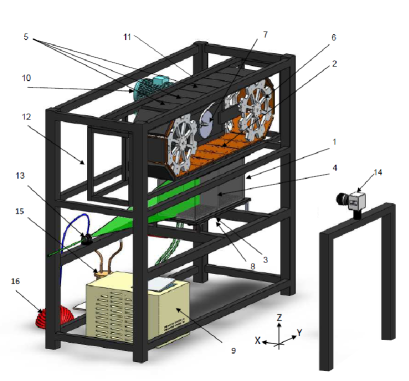
The experiments have been carried out in a lid-driven turbulent cavity flow generated by a moving wall in rectangular cavity filled with air (see Fig. 1). An internal partition which is parallel to the -plane is inserted in the cavity in order to vary the aspect ratio of the cavity. Here we introduce the following system of coordinates: is the vertical axis, the -axis is a direction of a long wall and the -plane is parallel to a square side wall of the cavity. A top wall of the cavity moves in a -axis direction and generates a shear flow in the cavity. The experiments have been conducted in the cavity with the dimensions cm3. Heated top wall and cooled bottom wall of the cavity impose a temperature gradient in the flow which causes temperature stratification of the air inside the cavity.
The top moving wall of the chamber consists of identical rectangular plate heating elements with a width of cm which are connected by hinges to the two adjustment heating elements. Twenty connected heating elements form a closed conveyer belt which is driven by two rotating gear-wheels with hinges. At each moment 6 moving heating elements are located in the plane and form the moving top wall of the cavity. Each heating element comprises the aluminum plate with the attached electrical heater and a temperature probe and is insulated with a textolite cap. The heaters and the temperature probes are electrically connected to a power supply unit and to the measuring device through a set of sliding rings. A bottom stationary cold wall of the cavity is manufactured from aluminum and serves as a top wall of a tank filled with water which circulates through a chiller with a controlled temperature.
All moving parts of the experimental set-up including an electrical motor and a gear-box are attached to a rigid steel frame in order to minimize vibrations of the cavity that is connected to the moving wall with a soft flexible sealing. Perspex walls are attached to the frame and enclose the moving conveyer belt consisting of heating elements in order to reduce heat transfer from the heating elements. The experiments have been conducted at different velocities of the top wall and aspect ratios of the cavity, and at different temperature differences between the top and the bottom walls of the cavity. This experimental set-up allows us to produce sheared temperature stratified turbulence.
The turbulent velocity field have been measured using a digital Particle Image Velocimetry (PIV) system (see, e.g., Refs. AD91, ; W00, ; RWK07, ) with LaVision Flow Master III. A double-pulsed Nd-YAG laser (Continuum Surelite mJ) is used for light sheet formation. Light sheet optics comprise spherical and cylindrical Galilei telescopes with tuneable divergence and adjustable focus length. We employ a progressive-scan 12 Bit digital CCD camera (pixels with a size m m each) with dual frame technique for cross-correlation processing of captured images. The tracer used for PIV measurements is incense smoke with sub-micron particles (with the material density g/cm3), which is produced by high temperature sublimation of solid incense particles. Velocity measurements were conducted in two perpendicular cross-sections in the cavity, cross-section (frontal view) and cross-section (side view).
We have determined the mean and the r.m.s. velocities, two-point correlation functions and an integral scale of turbulence from the measured velocity fields. Series of 520 pairs of images, acquired with a frequency of 1 Hz, have been stored for calculating velocity maps and for ensemble and spatial averaging of turbulence characteristics. The center of the measurement region coincides with the center of the chamber. We have measured velocity in the probed cross-section mm2 with a spatial resolution of pixels. This corresponds to a spatial resolution 142 m / pixel. This probed region has been analyzed with interrogation windows of or pixels, respectively.
In every interrogation window a velocity vector have been determined from which velocity maps comprising or vectors are constructed. The mean and r.m.s. velocities for every point of a velocity map (1024 or 4096 points) have been calculated by averaging over 520 independent maps. Space averaging was used for determining the mean energy in several regions in the flow and calculating the mean characteristic velocities in these regions for different stratifications. The two-point correlation functions of the velocity field have been calculated for every point of the velocity map inside the main vortex (with vectors) by averaging over 520 independent velocity maps, and then they will be averaged over all points. An integral scale of turbulence has been determined from the two-point correlation functions of the velocity field.
The temperature field has been measured with a temperature probe equipped with twelve E-thermocouples (with the diameter of 0.13 mm and the sensitivity of V/K) attached to a vertical rod with a diameter 4 mm. The spacing between thermocouples along the rod is 22 mm. Each thermocouple is inserted into a 1 mm diameter and 45 mm long case. A tip of a thermocouple protrudes at the length of 15 mm out of the case. The mean temperature is measured for 10 rod positions with 25 mm intervals in the horizontal direction, i.e., at 120 locations in a flow. The exact position of each thermocouple is measured using images captured with the optical system employed in PIV measurements. A sequence of temperature readings (each reading is averaged over 50 instantaneous measurements which are obtained in 20 ms) for every thermocouple at every rod position is recorded and processed using the developed software based on LabVIEW 7.0. The measurements from 12 thermocouples are obtained every 0.8 s. Similar experimental technique and data processing procedure were used previously in the experimental study of different aspects of turbulent convection, stably stratified turbulent flows (see Refs. BEKR11, ; EEKR06, ; EKR13, ) and in Refs. BEE04, ; EE04, ; EEKR06C, ; EEKR06A, ; EKR10, for investigating a phenomenon of turbulent thermal diffusion (see Refs. EKR96, ; EKR97, ).
III Experimental results and comparison with the theoretical predictions
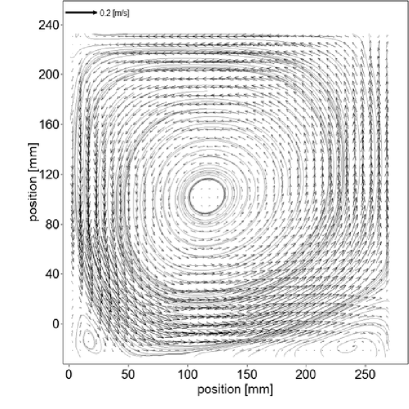
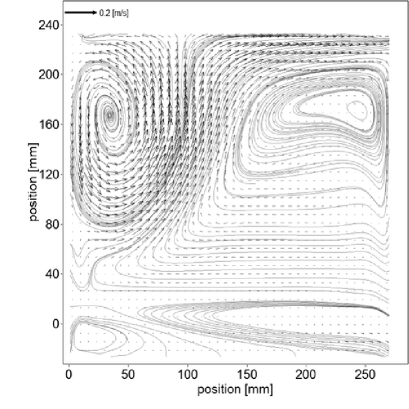
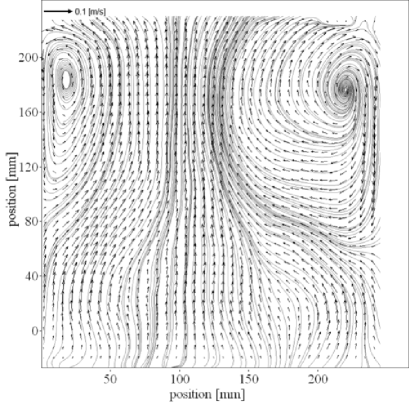
We start the analysis of the experimental results with the mean flow patterns obtained in the experiments conducted at different values of the temperature difference between the top and bottom walls. A set of mean velocity fields obtained in the central plane is shown in Figs. 2 and 3. The portion of flow depicted in these figures is far from the lid. These experiments demonstrate strong modification of the mean flow patterns with an increasing temperature difference between the hot top wall and the cold bottom wall of the cavity whereby the top wall moves in the left direction.
Figures 2 and 3 demonstrate the major qualitative changes in the mean flow patterns as the bulk Richardson number, , encompasses a wide range. Here is the thermal expansion coefficient, cm/s is the lid velocity, cm is the vertical height of the cavity and is the gravitational acceleration. The primary mean circulation (the main vortex), shown in the upper panel of Fig. 2, occupies the entire cavity. Two weak secondary mean vortexes are observed at the lower corners of the cavity. The qualitative character of the mean flow for small (or is similar to the conventional lid driven cavity flow of a non-stratified fluid.
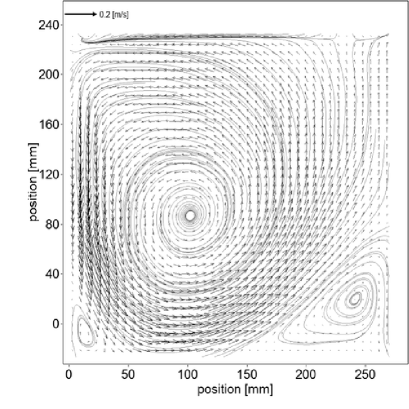
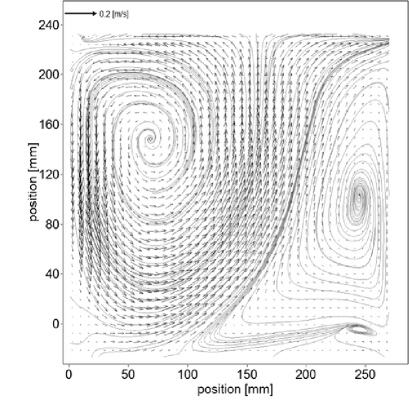
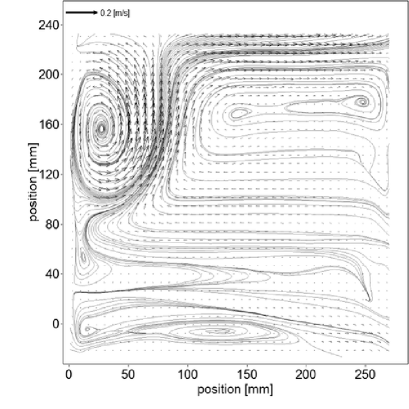
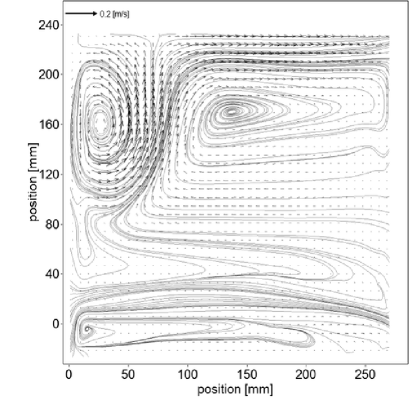
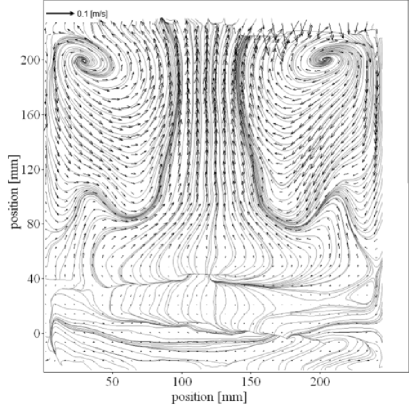
When (or is gradually increased, a change of the mean flow is observed already at a relatively low temperature difference [compare the middle panel of Fig. 2 that corresponds to K (or , with the bottom panel of Fig. 2 that is for K, ]. The position of the main vortex is shifted to the left, while the position of the right weak secondary vortex is shifted upwards and its size increases. At a further increase of the temperature difference between the top and bottom walls, K , the main vortex is pushed upwards, its size decreases, and the weak secondary mean flow is also strongly changed (see Fig. 3).
Strong effect of stratification on the flow pattern in the cavity can be also seen by inspecting mean velocity maps in cross-section (see Fig. 4) obtained for different temperature difference between the top and bottom walls. The mean velocity fields shown in Fig. 4 are measured in the cross-section close to the center of the main vortex. The frontal and side velocity maps demonstrate a complex three-dimensional flow in the lid-driven cavity which comprises the main vortex seen in frontal view, and several secondary vortices (seen in frontal and side views).
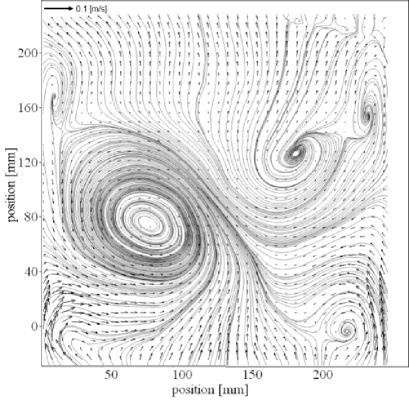
It must be noted that the mean flow energy in the central part of the cross-section is by at least one order of magnitude less than the mean flow energy in the front cross-section. There are several factors that can cause a slight asymmetry of the mean flow in plane, in particular for . One of the factors can be related with slight geometric imperfections of the experimental cell. Another possible reason is associated with the effect of excitation of the large-scale vorticity in a non-stratified turbulence with a large-scale shear (see Refs. EKR03, ; EKR07, ). Temperature stratification may mitigate this effect. The latter assertion is supported by the mean velocity maps in Fig. 4 (see lower panel, K) where the large-scale velocity pattern in plane is quite symmetric.
It is possible to distinguish between three regions in the mean flow for K or (see the upper panel of Fig. 3): a relatively strong mean flow in the upper part of the cavity including a main vortex in its left side, a mean sheared flow with a lesser mean velocity in its right side, and a very weak mean flow in the rest of the cavity. Therefore, when the strength of stable stratification increases and the bulk Richardson number, , increases up to 0.3, the main vortex tends to be confined to a small zone close to the sliding top lid and to the left wall of the cavity.
The stable stratification suppresses the vertical mean motions, and, therefore, the impact of the sliding top wall penetrates to the smaller depth into the fluid. As seen in Fig. 3, when is not small, the mean flow in the middle and lower parts of the cavity interior is weak, and much of the fluid remains almost stagnant. The lower panel of Fig. 3 demonstrates this trend. The mean flow is almost stagnant in the bulk of the cavity interior excluding the region close to the sliding top wall.
The mean flows obtained in our experiment are three-dimensional. However, inspection of the mean flow patterns in (Figs. 2 and 3) and planes (Fig. 4) reveals that the energy of the mean flow in plane is by at least one order of magnitude larger than the mean flow energy in plane. Therefore, the flow is not strongly three-dimensional with respect to the mean flow energy in these two planes. Moreover, inspection of the velocity maps in cross-section (see Fig. 4, panels for K and K) shows that the flow is nearly symmetric and homogeneous in the central part. We also observed that the measured velocity maps in cross-sections for different coordinate are quite close, and a slight difference was observed only at the distance of about 3.7 cm from the side walls. Therefore, we believe that the choice of the mid plane provides a good representation of the core flow in the cavity.
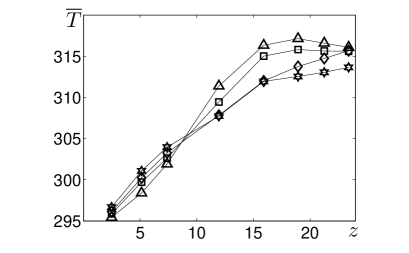
In Fig. 5 we show vertical temperature profiles measured in the central plane for several values of coordinate . Inspection of these temperature profiles reveals the existence of two distinctive parts in the temperature dependence on vertical coordinate z. Temperature varies strongly in the bottom stagnant part of the flow with a stable stratification. Vertical temperature gradient varies from 1.7 K/cm (at = 2.5 cm) under the main vortex to 1.15 K/cm (at = 14 cm and = 22 cm) under a sheared part of the flow (tail of the vortex). Vertical temperature gradient decreases sharply to 0.2 K/cm inside the sheared part of the flow. Remarkably, vertical temperature gradient changes sign inside the main vortex (see the plots in Fig. 5 for = 2.5 cm), i.e. stably stratified flow changes to the slightly unstably stratified flow.
To characterize the change in the mean flow pattern with the increase of the stratification, we show in Fig. 6 the maximum vertical size of the main (energy containing) large-scale circulation versus the temperature difference between the bottom and the top walls of the chamber obtained in the experiments. The length , the vertical size of the large-scale vortex, is determined directly from the measured mean flow energy values. The vertical coordinate of the bottom of the vortex was determined as a location in the flow where the mean flow energy is by a factor 10 smaller than the maximum mean flow energy. For example, = 14.6 cm for =44 K and = 12.9 cm for =54 K. Inspection of Fig. 6 shows that the maximum vertical size of large-scale circulation is nearly constant when K. On the other hand, when K, the maximum vertical size decreases with as .
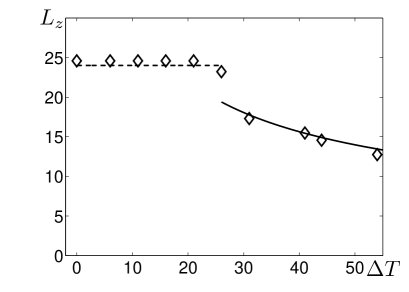
The point of maximum penetration corresponds to the region where the buoyancy force exerted by the lower denser fluid balances the net downward momentum flux of the fluid generated by the lid motion (see Ref. KSN85, ). Therefore, this scaling can be understood on the base of the budget equations for the mean velocity and temperature fields. Indeed, using the budget equation for the mean kinetic energy , we obtain that the change of the mean kinetic energy is of the order of the work of the buoyancy force, , where is the buoyancy parameter, is the mean temperature with the reference value , and is the change of the mean temperature over the size of the large-scale circulation . On the other hand, the budget equation for the squared mean temperature, , shows that the change of the mean temperature over the size of the large-scale circulation is of the order of the temperature difference between the bottom and the top walls of the chamber. This yields the following scaling:
| (1) |
There are two regions in the flow where the magnitude of turbulent kinetic energy differs significantly for all stratifications with K. Strong (weak) turbulence is observed in regions with strong (weak) mean flow. For instance, in the case with the largest stratification K obtained in our experiments, the turbulent kinetic energy in the strong turbulence region is by a factor 30 larger than that in the weak turbulence region. The strong turbulence is produced by the shear of large-scale vortex.
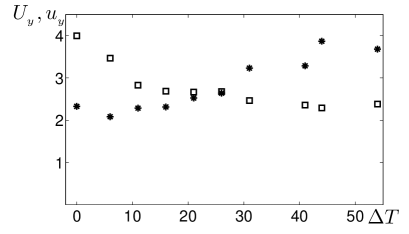
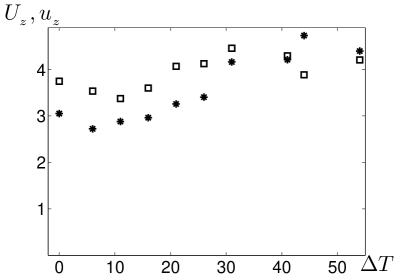
To characterize the velocity fields obtained in the experiments, in Figs. 7 and 8 we show the characteristic horizontal and vertical mean, , and turbulent, , r.m.s. velocities (measured in the region with a strong turbulence) versus the temperature difference between the bottom and the top walls of the chamber. Inspection of Fig. 7 shows when K, the horizontal mean velocity, , is larger than the turbulent velocity , while for K, . This tendency is related to the fact that for K, the size of the main (energy containing) large-scale circulation decreases with .
This implies that the size of the shear-produced turbulence region due to the main vortex decreases with increase of the stratification. In this region, the mean velocity is nearly constant. Substituting the vertical size of the turbulence region, , determined by Eq. (1) into the mean shear , we obtain
| (2) |
where we have taken into account that . Therefore, the value of shear increases with , and, consequently, the shear production rate increases with the increasing of the stratification, where is the turbulent viscosity and is the integral scale of turbulence in the vertical direction. Now let us estimate the turbulent kinetic energy, , using the budget equation for this quantity:
| (3) |
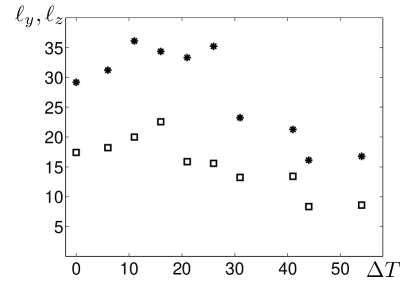
where is the turbulent r.m.s. velocity. Since the mean velocity is nearly constant for K, and [see Eq. (3)], the turbulent velocity increases with the increase of the stratification. Here we have taken into account that the integral scale of turbulence in vertical direction does not change strongly with the change of when K (see Fig. 9).
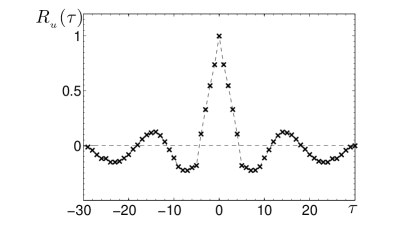
The internal gravity waves with the frequency can be excited in stably stratified flows. Here is the wave number, is the horizontal wave number and is the Brunt-Väisälä frequency (see, e.g. Refs. MY71, ; M14, ; ZKR09, ; M01, ; SS02, ; F88, ). In our experiments in the region of the cavity with a weak turbulence we observed the large-scale internal gravity waves with the period of about 22 seconds. In particular, in Fig. 10 we show the normalized one-point non-instantaneous correlation function of the large-scale temperature field determined for different versus the time , where , and is the sliding averaged temperature (with seconds window average), and is the 10 minutes average.
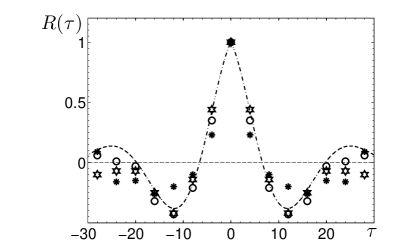
Inspection of Fig. 10 shows that the function has a form of the Lorentz function, with s and s-1, which corresponds to the period of the wave seconds. Note that the Fourier transform, , of the Lorentz function has the following form:
| (4) |
Such form of the correlation function indicates the presence of the large-scale waves with random phases. The memory or correlation time for these waves is about s. Therefore, in our analysis the temperature field is decomposed in three different parts: small-scale temperature fluctuations, the mean temperature field and the large-scale temperature field corresponding to the large-scale internal gravity waves.
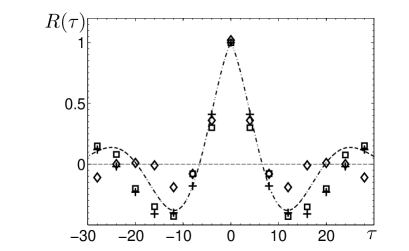
We also performed similar analysis for the vertical large-scale velocity field. In our analysis the velocity field is decomposed in three different parts: small-scale velocity fluctuations, the mean velocity field and the large-scale velocity field corresponding to the large-scale internal gravity waves. Internal gravity waves are characterized by , where is the sliding averaged vertical mean velocity (with 3 seconds window average), , and is the 8.7 minutes average. In Fig. 11 we show the normalized one-point non-instantaneous correlation function of the vertical large-scale velocity field determined for different versus the time .
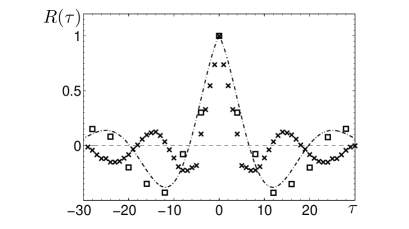
Comparison of the normalized one-point non-instantaneous correlation function, , of the vertical large-scale velocity field with that of the temperature field, (see Fig. 12) shows that for short time scales ( s) these correlation functions are different. This implies that for these time-scales the wave spectra of the large-scale velocity and temperature fields are different.
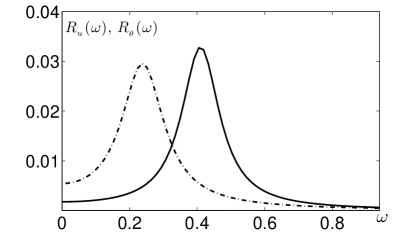
Indeed, in Fig. 13 we show the spectral functions, and , of the normalized one-point non-instantaneous correlation functions, and , of the vertical large-scale velocity and temperature fields. Figure 13 shows a single peak for each variable: the vertical large-scale velocity and the large-scale temperature field, with 2:1 frequency ratio for these fields. The reason for such behaviour may be a parametric nonlinear excitation and interaction of the wave temperature and velocity fields. This also can be an interaction of nonlinear internal gravity waves and the large-scale Tollmien-Schlichting waves in sheared turbulent flows (see Ref. EKR07, ). The observed features can be interpreted as a combination of standing and propagating waves which can be excited by the interaction of the mean flow and the walls of the cavity, or by wave-radiation stress mechanism pointed out in Refs. M01, and F88, .
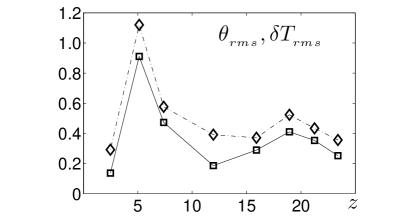
In Fig. 14 we show spatial vertical profiles of turbulent temperature fluctuations and of the function of the large-scale temperature field at the temperature difference K between the bottom and the top walls of the chamber obtained in the experiments, where . Inspection of Fig. 14 shows that the level of the intensities of turbulent temperature fluctuations are of the same order as the energy of the large-scale internal gravity waves. These turbulent fluctuations, , are larger in the lower part of the cavity where the mean temperature gradient is maximum. In the upper part of the cavity where the shear caused by the large-scale circulation is maximum, and the mean temperature gradient is decreased.
IV Conclusions
We study experimentally stably stratified turbulence and large-scale flows and waves in a lid driven cavity with a non-zero vertical mean temperature gradient. Geometrical properties of the large-scale vortex (e.g., its size and form) and the level of small-scale turbulence inside the vortex are controlled by the buoyancy (i.e., by the temperature stratification). The observed velocity fluctuations are produced by the shear of the large-scale vortex. At larger stratification obtained in our experiments, the strong turbulence region is located at the upper left part of the cavity where the large-scale vortex exists. In this region the Brunt-Väisälä frequency is small and increases in the direction outside the large-scale vortex. This is the reason of that the large-scale internal gravity waves are observed in the regions outside the large-scale vortex. We found these waves by analyzing the non-instantaneous correlation functions of the temperature and velocity fields. The observed large-scale waves are nonlinear because the frequency of the waves determined from the temperature field measurements is two times smaller than that obtained from the velocity field measurements. The measured intensity of the waves is of the order of the level of the temperature turbulent fluctuations.
Acknowledgements.
We thank A. Krein for his assistance in construction of the experimental set-up. This research was supported in part by the Israel Science Foundation governed by the Israeli Academy of Sciences (Grant 1037/11), and by the Russian Government Mega Grant (Grant 11.G34.31.0048).References
- (1) P. N. Shankar, M. D. Deshpande, “Fluid mechanics in the driven cavity,” Annu. Rev. Fluid Mech. 32, 93 (2000).
- (2) G. N. Ivey, K. B. Winters, J. R. Koseff, “Density stratification, turbulence, but how much mixing,” Annu. Rev. Fluid Mech. 40, 169 (2008).
- (3) K. Torrance, R. Davis, K. Eike, P. Gill, D. Gutman, A. Hsui, S. Lyons, H. Zien, “Cavity flows driven by buoyancy and shear,” J. Fluid Mech. 51, 221 (1972).
- (4) R. Schreiber, H. B. Keller, “Driven cavity flows by efficient numerical techniques,” J. Computat. Phys. 49, 310 (1983).
- (5) J. R. Koseff, R. L. Street, H. S. Rhee, “Flow visualization of a recirculating flow by rheoscopic liquid and liquid crystal techniques,” Experim. Fluids 2, 57 (1984).
- (6) J. R. Koseff, R. L. Street, “Visualization studies of a shear driven three dimensional recirculating flow,” J. Fluids Eng. 106, 21 (1984).
- (7) J. R. Koseff, R. L. Street, “On end wall effects in a lid driven cavity flow,” J. Fluids Eng. 106, 390 (1984).
- (8) J. R. Koseff, R. L. Street, “The Lid-Driven Cavity Flow: A Synthesis of Qualitative and Quantitative Observations,” Transact. ASM 106, 385 (1984).
- (9) J. R. Koseff, R. L. Street, J. Freitas, N. Findikakist, “Numerical simulation of three-dimensional flow in a cavity,” Int. J. Numerical Methods in Fluids 5, 561 (1985).
- (10) J. R. Koseff and R. L. Street, “Circulation structure in a stratified cavity flow,” ASCE J. Hydraulic Engineering 111, 334 (1985).
- (11) J. R. Koseff, A. K. Prasad, “Reynolds number and end-wall effects on a lid-driven cavity flow,” Phys. Fluids A 1, 208, (1989).
- (12) R. Iwatsu, K. Ishii, T. Kawamura, K. Kuwahara, J. M. Hyun, “Numerical simulation of three-dimensional flow structure in a driven cavity,” Fluid Dyn. Res. 5, 173 (1989).
- (13) M. K. Moallemi, K. S. Jang, “Prandtl number effects on laminar mixed convection heat transfer in a lid-driven cavity,” Int. J. Heat Mass Transfer 35, 1881 (1992).
- (14) J. R. Koseff, R. L. Street, Y. Zang, “A dynamic mixed subgrid-scale model and its application to turbulent recirculating flows,” Phys. Fluids A 5, 3186 (1993).
- (15) R. Iwatsu, J. M. Hyun, K. Kuwahara, “Mixed convection in a driven cavity with a stable vertical temperature gradient,” Int. J. Heat Mass Transfer 36, 1601 (1993).
- (16) R. B. Mansour, R. Viskanta, “Shear-opposed mixed-convection flow heat transfer in a narrow, vertical cavity,” Int. J. Heat Fluid Flow 15, 462 (1994).
- (17) A. A. Mohammad, R. Viskanta, “Flow structures and heat transfer in a lid-driven cavity filled with liquid gallium and heated from below,” Exper. Thermal Fluid Sci. 9, 309 (1994).
- (18) A. A. Mohammad, R. Viskanta, “Flow and heat transfer in a lid-driven cavity filled with a stably stratified fluid,” Appl. Math. Model 19, 465 (1995).
- (19) R. Iwatsu, J. M. Hyun, “Three-dimensional driven-cavity flows with a vertical temperature gradient,” Int. J. Heat Mass Transfer, 38, 3319 (1995).
- (20) A. K. Prasad, J. R. Koseff, “Combined forced and natural convection heat transfer in a deep lid driven cavity flow,” Int. J. Heat Fluid Flow 17, 460 (1996).
- (21) S. C. Lee, C. K. Chen, “Finite element solutions of laminar and turbulent mixed convection in a driven cavity,” Int. J. Numer. Methods Fluids 23, 47 (1996).
- (22) N. Alleborn, H. Raszillier, F. Durst, “Lid-driven cavity with heat and mass transport,” Int. J. Heat Mass Transfer 42, 833 (1999).
- (23) P. N. Shankar, V. V. Meleshko, E. I. Nikiforovich, “Slow mixed convection in rectangular containers,” J. Fluid Mech. 471, 203 (2002).
- (24) H. F. Oztop, I. Dagtekin, “Mixed convection in two-sided lid-driven differentially heated square cavity,” Int. J. Heat Mass Transfer 47, 1761 (2004).
- (25) A. Liberzon, Yu. Feldman, A. Yu. Gelfgat, “Experimental observation of the steady-oscillatory transition in a cubic lid-driven cavity,” Phys. Fluids 23, 084106, (2011).
- (26) S. Chandrasekhar, Hydrodynamic and Hydromagnetic Stability, (Dover Publications Inc., New York, 1961), Sect. 2.
- (27) A. S. Monin and A. M. Yaglom, Statistical Fluid Mechanics (MIT Press, Cambridge, Massachusetts, 1971), Vol. 1.
- (28) J. Miles, “Richardson criterion for the stability of stratified shear-flow,” Phys. Fluids 29, 3470 (1986).
- (29) E. J. Strang and H. J. S. Fernando, “Vertical mixing and transports through a stratified shear layer,” J. Phys. Oceanogr. 31, 2026 (2001).
- (30) R. M. Banta, R. K. Newsom, J. K. Lundquist, Y. L. Pichugina, R. L. Coulter and L. Mahrt, “Nocturnal low-level jet characteristics over Kansas during CASES-99,” Boundary-Layer Meteorol. 105, 221 (2002).
- (31) E. R. Pardyjak, P. Monti and H. J. S. Fernando, “Flux Richardson number measurements in stable atmospheric shear flows,” J. Fluid Mech. 459, 307 (2002).
- (32) P. Monti, H. J. S. Fernando, M. Princevac, W. C. Chan, T. A. Kowalewski and E. R. Pardyjak, “Observations of flow and turbulence in the nocturnal boundary layer over a slope,” J. Atmos. Sci. 59, 2513 (2002).
- (33) J. S. Lawrence, M. C. B. Ashley, A. Tokovinin and T. Travouillon, “Exceptional astronomical seeing conditions above Dome C in Antarctica,” Nature 431, 278 (2004).
- (34) L. Mahrt, “Stably stratified atmospheric boundary layers,” Annu. Rev. Fluid Mech. 46, 23 (2014).
- (35) S. S. Zilitinkevich, T. Elperin, N. Kleeorin and I. Rogachevskii, “Energy- and flux budget (EFB) turbulence closure model for stably stratified flows. Part I: Steady-state, homogeneous regimes,” Boundary-Layer Meteorol. 125, 167 (2007).
- (36) S. S. Zilitinkevich, T. Elperin, N. Kleeorin, I. Rogachevskii, I. Esau, T. Mauritsen and M. Miles, “Turbulence energetics in stably stratified geophysical flows: strong and weak mixing regimes,” Quart. J. Roy. Met. Soc. 134, 793 (2008).
- (37) S. S. Zilitinkevich, T. Elperin, N. Kleeorin, V. L’vov and I. Rogachevskii, “Energy- and flux-budget turbulence closure model for stably stratified flows. Part II: the role of internal gravity waves,” Boundary-Layer Meteorol. 133, 139 (2009).
- (38) S. S. Zilitinkevich, T. Elperin, N. Kleeorin, I. Rogachevskii, and I. Esau, “A hierarchy of energy- and flux-budget (EFB) turbulence closure models for stably stratified geophysical flows,” Boundary-Layer Meteorol. 146, 341 (2013).
- (39) R. J. Adrian, “Particle-imaging tecniques for experimental fluid mechanics,” Annu. Rev. Fluid Mech. 23, 261 (1991).
- (40) J. Westerweel, “Theoretical analysis of the measurement precision in particle image velocimetry,” Exper. Fluids 29, S3-12 (2000).
- (41) C. Raffel, C. Willert, S. Werely and J. Kompenhans, Particle Image Velocimetry, (Springer, Berlin-Heidelberg, 2007).
- (42) M. Bukai, A. Eidelman, T. Elperin, N. Kleeorin, I. Rogachevskii and I. Sapir-Katiraie, “Transition phenomena in unstably stratified turbulent flows,” Phys. Rev. E 83, 036302 (2011).
- (43) A. Eidelman, T. Elperin, N. Kleeorin, A. Markovich and I. Rogachevskii, “Hysteresis phenomenon in turbulent convection,” Experim. Fluids 40, 723 (2006).
- (44) A. Eidelman, T. Elperin, I. Gluzman, N. Kleeorin and I. Rogachevskii, “Experimental study of temperature fluctuations in forced stably stratified turbulent flows,” Phys. Fluids 25, 015111 (2013).
- (45) J. Buchholz, A. Eidelman, T. Elperin, G. Grünefeld, N. Kleeorin, A. Krein, I. Rogachevskii, “Experimental study of turbulent thermal diffusion in oscillating grids turbulence,” Experim. Fluids 36, 879 (2004).
- (46) A. Eidelman, T. Elperin, N. Kleeorin, A. Krein, I. Rogachevskii, J. Buchholz, G. Grünefeld, “Turbulent thermal diffusion of aerosols in geophysics and in laboratory experiments,” Nonl. Proc. Geophys. 11, 343 (2004).
- (47) A. Eidelman, T. Elperin, N. Kleeorin, I. Rogachevskii and I. Sapir-Katiraie, “Turbulent thermal diffusion in a multi-fan turbulence generator with the imposed mean temperature gradient,” Experim. Fluids 40, 744 (2006).
- (48) A. Eidelman, T. Elperin, N. Kleeorin, A. Markovich and I. Rogachevskii, “Experimental detection of turbulent thermal diffusion of aerosols in non-isothermal flows,” Nonl. Proc. Geophys. 13, 109 (2006).
- (49) A. Eidelman, T. Elperin, N. Kleeorin, B. Melnik and I. Rogachevskii, “Tangling clustering of inertial particles in stably stratified turbulence,” Phys. Rev. E 81, 056313 (2010).
- (50) T. Elperin, N. Kleeorin and I. Rogachevskii, “Turbulent thermal diffusion of small inertial particles,” Phys. Rev. Lett. 76, 224 (1996).
- (51) T. Elperin, N. Kleeorin and I. Rogachevskii, “Turbulent barodiffusion, turbulent thermal diffusion and large-scale instability in gases,” Phys. Rev. E 55, 2713 (1997).
- (52) T. Elperin, N. Kleeorin and I. Rogachevskii, “Generation of large-scale vorticity in a homogeneous turbulence with a mean velocity shear,” Phys. Rev. E 68, 016311 (2003).
- (53) T. Elperin, I. Golubev, N. Kleeorin and I. Rogachevskii, “Large-scale instability in a sheared turbulence: Formation of vortical structures,” Phys. Rev. E 76, 066310 (2007).
- (54) Yu. Z. Miropol’sky, Dynamics of Internal Gravity Waves in the Ocean. Series of Atmospheric and Oceanographic Sciences Library, v. 24 (Springer, Berlin, 2001).
- (55) C. Staquet, J. Sommeria, “Internal gravity waves: from instability to turbulence,” Annu. Rev. Fluid Mech. 34, 559 (2002).
- (56) J. J. Finnigan, “Kinetic energy transfer between internal gravity waves and turbulence,” J. Atmos. Sci. 45, 486 (1988).