Molecular ferroelectric contributions to anomalous hysteresis in hybrid perovskite solar cells
Abstract
We report a model describing the molecular orientation disorder in \ceCH3NH3PbI3, solving a classical Hamiltonian parametrised with electronic structure calculations, with the nature of the motions informed by ab-initio molecular dynamics. We investigate the temperature and static electric field dependence of the equilibrium ferroelectric (molecular) domain structure and resulting polarisability. A rich domain structure of twinned molecular dipoles is observed, strongly varying as a function of temperature and applied electric field. We propose that the internal electrical fields associated with microscopic polarisation domains contribute to hysteretic anomalies in the current–voltage response of hybrid organic-inorganic perovskite solar cells due to variations in electron-hole recombination in the bulk.
Solar cells based on hybrid organic-inorganic perovskites display unusual device physics, which is still in the process of being understood.1, 2, 3, 4, 5 One unusual aspect is the notable hysteresis in current–voltage curves, depending on rate of measurement and starting point within the curve.3 When the solar cell is held at short–circuit (in the dark or light), the photovoltaic performance decreases considerably. When the photovoltaic cell is operating at near open–circuit voltage, performance builds.
The highest apparent efficiencies are produced after tempering the solar cell in forward bias at .3 Similar behaviour is observed in both mesoporous and planar solar cell architectures and independent of the presence of a hole transport layer (e.g. Spiro‐MeOTAD). This effect is strongest in planar device architectures, as would be expected if it resulted from the electric field applied between the contacts. This behaviour occurs over time scales up to hundreds of seconds.
Perovskite (\ceABX3) structured materials tend to have a large dielectric constant due to the relative ease of polarising the cell structure. In particular, distortion of the edge-sharing \ceBX6 octahedra can produce an overall electric dipole between the A and B lattice sites. Inorganic perovskites are known to exhibit a range of ferroelectric and ferroelastic phase transitions.6 The hybrid perovskite analogues are formed by replacing the element at the icosahedral A site with an isovalent molecule. In this work we study the photovoltaic absorber methyl-ammonium lead iodide, \ceCH3NH3PbI3 (MAPI). Here \ceCH3NH3+ (MA) is a singly-charged closed-shell molecular cation. As compared to inorganic perovskites, the hybrid materials have a lower crystal symmetry and the possibility of dipolar cation interactions gives rise to strong low-frequency dielectric screening and the formation of polarised domain structures.5
Ferroelectric materials have been studied in the context of photovoltaic applications for over half a century.7 A number of effects have been attributed to the lack of centrosymmetry. The anomalous photovoltaic effect was first reported in samples of PbS8 in 1946 and was subsequently linked to the existence of a ferroelectric transition, resulting in large photovoltages (ca. 10 ).9 Similar effects have been reported for ferroelectric phases of SbSI, ZnS and CdTe.9, 10, 11 Additionally, oxide perovskites such as \ceBaTiO3 and \ceKNbO3 demonstrate a bulk photovoltaic effect.12 In these materials photocurrents can be generated in the absence of asymmetric electrical contacts, unlike standard photovoltaic cells.
In this Letter we report the implementation of a classical Monte-Carlo simulation of the domain behaviour arising from molecular rotation in hybrid perovskites. The model takes parameters from density functional theory (DFT) calculations, using both static lattice and molecular dynamic (MD) simulations. In this work we restrict ourselves to the two-dimensional case, and allow the dipoles to freely rotate (no cage strain is applied).
We propose that the MA ions in this material are highly rotationally mobile, the interaction between these ions forms ordered domains (which respond slowly to applied electric fields), which results in a structured local potential field. We speculate that the equilibrium (open–circuit) configuration is beneficial for solar cell operation by reducing charge carrier recombination through interpenetrating percolating pathways of (electric potential) valleys and ridges for holes and electrons. At short–circuit, the electric field resulting from the built-in voltage is sufficient to disrupt this structure, suppressing long-range order and resulting in more isolated domains. The existence of intricate dipole phase behaviour and the resultant structure in internal electric fields indicate that these photoferroic characteristics, atypical of standard photovoltaic materials, must be considered in device modelling.
Low-frequency dielectric behaviour. The dielectric response of \ceCH3NH3PbI3, and related hybrid perovskites, exhibits significant temperature and frequency dependence. At low temperatures there is a discontinuity associated with the first-order phase transition between the orthorhombic and tetragonal phases (ca. 160 K); at higher temperatures the orientation of MA becomes (partially) disordered. Work by Poglitsch and Weber in 1987 measured the complex dielectric response of methyl-ammonium lead halides (iodide, chloride, bromide) as a function of temperature between . 13 The effective dielectric constant at 300 K was measured to be 33 for \ceCH3NH3PbI3 at a frequency of 90 GHz. In 1992, Onoda-Yamamuro et al reported a value of ca. 58 at a frequency of 1 kHz.14 In contrast, the static dielectric constant, in the absence of molecular reorientation, is predicted to be 24.1 from electronic structure calculations (PBEsol + QSGW),15 which is in good agreement with the value of 23.3 determined from a fit of permittivity measurements over 100–300 K to the Kirkwood-Fröhlich equation.14 The unusual dielectric behaviour will make analysis of impedance measurements on photovoltaic cells challenging.
Ab initio molecular dynamics. An open question in these materials is the alignment and dynamics of the MA ion. Analysis of 2H and 14N NMR spectra confirmed that MA cation rotation is a rapid process at room temperature.16 X-ray diffraction has been used to characterise the low temperature orthorhombic ( symmetry), room temperature tetragonal ( symmetry) and above room temperature cubic ( symmetry) crystal structures of MAPI.13 The position of the MA molecules is usually described with partial occupancies that satisfy the space group symmetry,13, 17 e.g. in the cubic phase eight identical positions can be fitted around the standard () perovskite site, each occupied with equal probability.13 There is a distinct first-order orthorhombic-to-tetragonal phase transition, but the tetragonal-to-cubic transition is close to second-order with no change in pseudo-cubic cell volume.18 It should be noted that in hybrid perovskite thin-films, analysis of X-ray scattering data19 and electron microscopy20 has suggested the presence of a lower symmetry nanostructure, as well as the appearance of the cubic phase at room temperatures.
To provide atomistic insight, without the assumption or restriction of lattice symmetry beyond a periodic supercell (80 atom expansion of the pseudo-cubic perovskite structure21), we investigate the energetics and dynamics of MA in MAPI with ab-initio MD simulations based on the PBEsol exchange-correlation functional. We employ a timestep of , which is sufficient to describe even the C–H vibrations. The MD trajectory at 300 K contains large-scale fluctuation of the ions about their equilibrium positions, including rapid rotation of the methyl group and total rotation of the methyl-ammonium ion. (A video file of the trajectory is provided elsewhere.22) The hybrid perovskites are structurally soft materials; so far almost all published calculations and analysis have assumed perfect crystals, while these data indicate that such structures are not representative of the materials at room temperature. Further structural analysis is on-going.
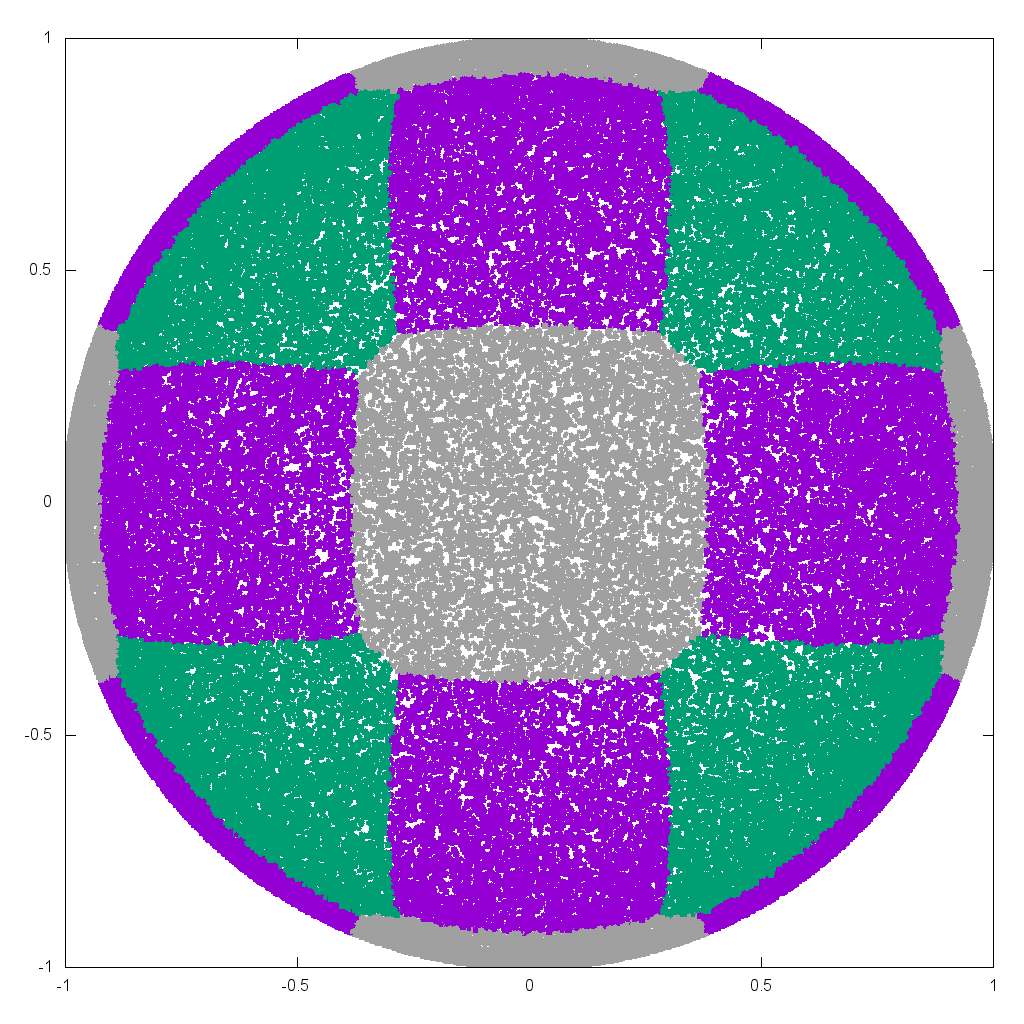
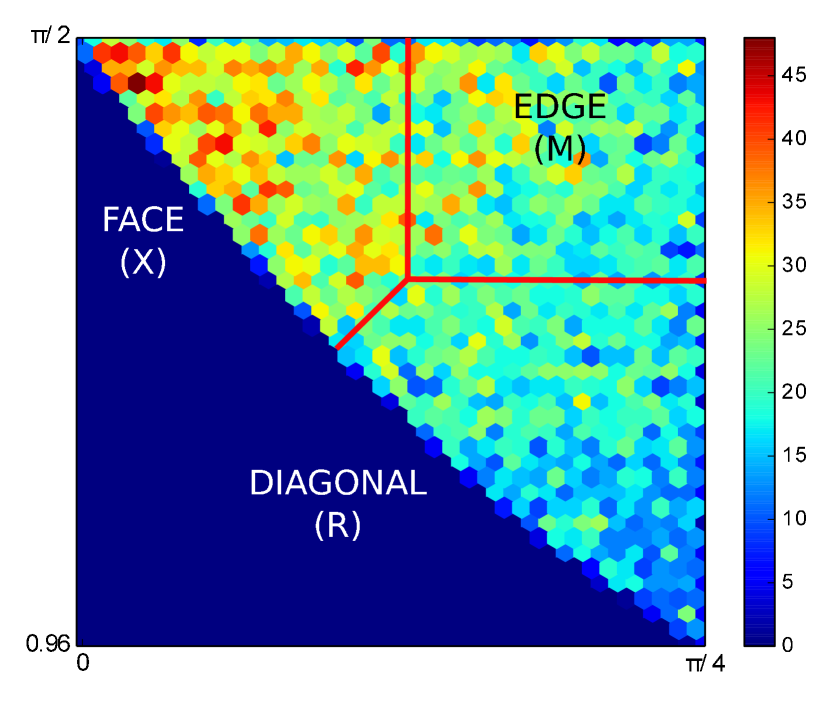
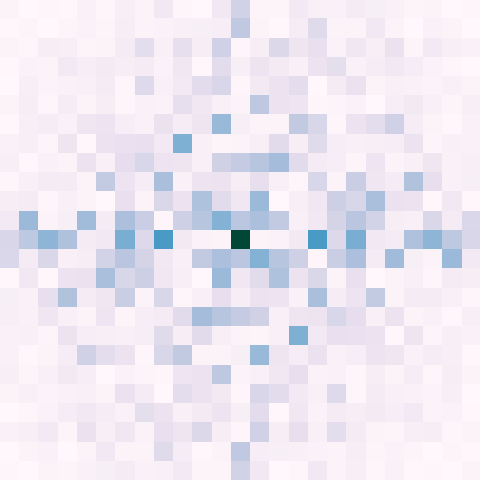
Due to the permanent molecular dipole of the methyl-ammonium ion,5 its ensemble average position and the dynamics of its movements are of interest in explaining the dielectric response and electrical behaviour of devices made from MAPI. Custom codes were written to analyse the MD trajectories, identifying the C–N bonds across the periodic boundaries and calculating this molecular alignment (of the eight MA ions) relative to the pseudo-cubic unit cell. The distribution of spherical coordinates over the MD ensemble enables us to make statements about the average distribution of molecular direction, relative to the crystallographic unit cell. Here the histogram is in binned in spherical angles, and hence the bins are not a constant solid angle. The symmetry of the ideal cubic perovskite phase leads to a 48–fold reduction of the phase space onto its reflection domain.
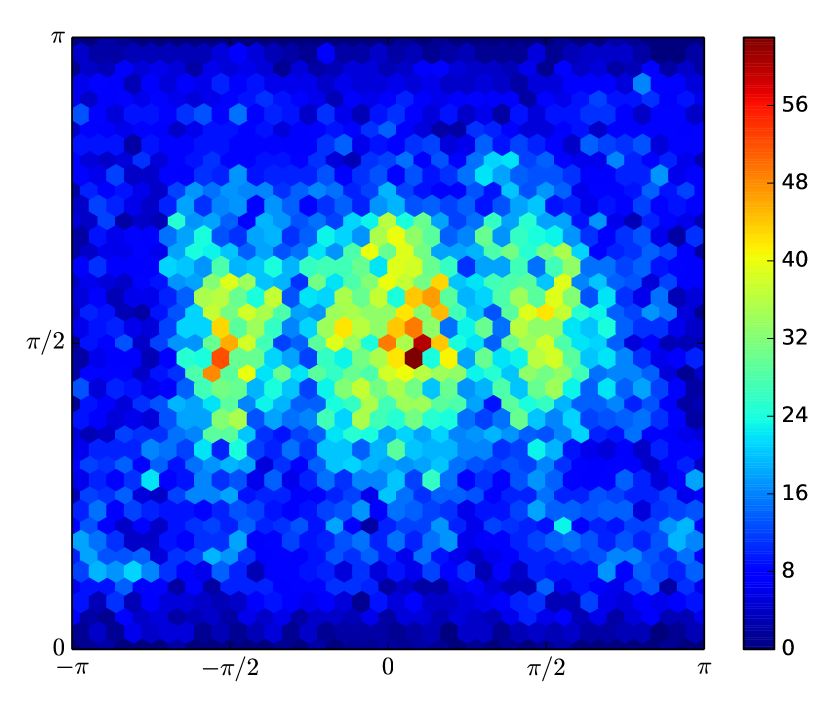
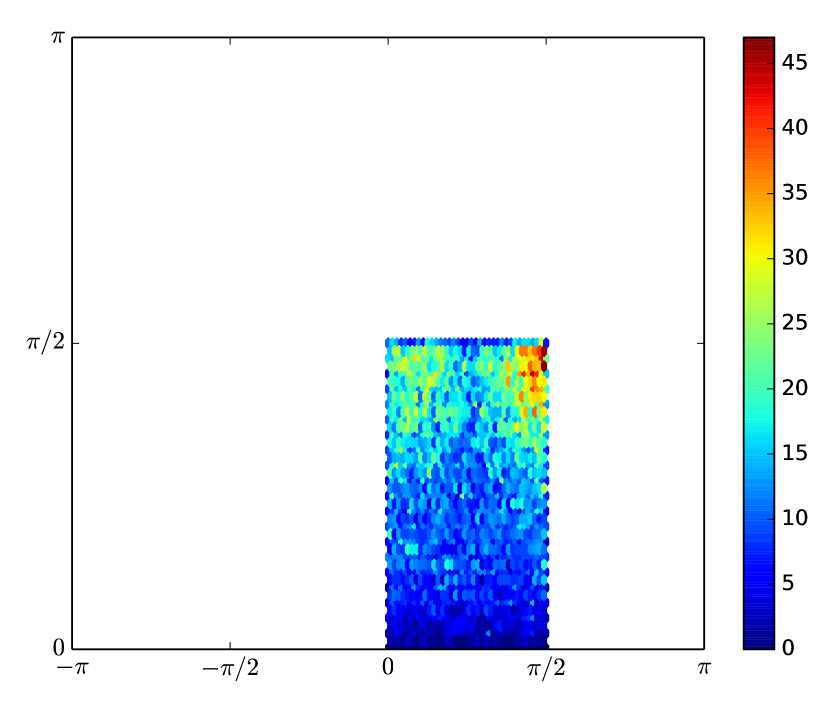
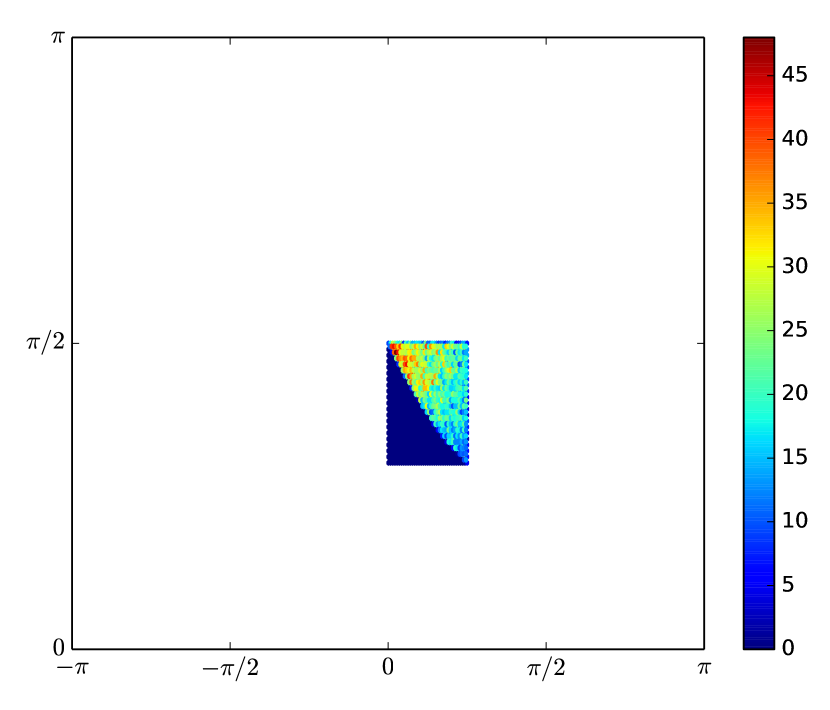
When we plot the data without considering the symmetry of the MA ion environment (Figure 1(a)), there is little that we can say other than a preference for the ion to align with the faces of the cube (). The limited simulation time leads to the evident incomplete coverage of spherical phase space. Therefore we reflect the data onto the first octant, and further exploit symmetry to reduce the internal coordinates to contain the domain between the unique [1,0,0] (X) faces, [1,1,0] (M) edges and [1,1,1] (R) diagonals (Figure 1(b)) to increase the signal to noise ratio by a factor of 48 (see Supplementary Material for more details). This reveals a high density of ensembles in a distribution around facial alignment, a lowered distribution around edge alignment, and an increased distribution in a disordered halo around diagonal alignment.
We can further quantify these distributions by binning the ensemble of symmetry reduced alignment vectors by whether they are nearest (in angle) to the face, edge or diagonal vectors. Doing so we find that the raw densities are face, edge and diagonally aligned (populations ). Due to the symmetry of these orientations (with 6, 12 and 8 fold degeneracy, respectively), and the boundaries between these domains, these populations are not directly comparable (the solid angles they cover are different). Therefore we weight these distributions with surface areas evaluated from a flat spherical distribution (calculated with a Monte-Carlo integration of points, using the same codes). These densities, which would be equal if there was no orientation preference, are face, edge and diagonal, aligned.
While ab-initio MD is a powerful approach, the two principle limitations due to computational expense are finite size effects (as the simulation is infinitely periodic on ) and short timescale ( are insufficient for diffusion processes). To access the time and length scales necessary to represent realistic non-equilibrium structures, and so directly comparable to experiment, we construct a classical model for molecular dipole interactions.
Polar molecules on a lattice. We start from the lattice dynamical theory of ferroelectricity (see P.W. Anderson24 and W. Cochran25, 26.) We limit ourself to assuming that the dominant soft phonon mode in the system is the free rotation of the molecular dipole within an extended perovskite cage structure.
The treatment of polarisation as an effect of rotational Brownian motion is analytically challenging27. Here we simulate these physics numerically by using a Monte-Carlo method to calculate the equilibrium configuration of the dipoles. The macroscopic response of the material is expected to be linked to very slow rearrangements of domain walls as a result of statistically rare cooperative rearrangements of the microscopic dipoles. Therefore we need to integrate a long way in simulation time to equilibrate the material.
We construct a model Hamiltonian for the dipoles (vectors ) by summing the interaction energy of the applied unshielded electrostatic field (), near-neighbour dipole-dipole interactions and local cage strain ()
| (1) | |||||
| (2) | |||||
| (3) |
Here the energies are calculated with numerically efficient dot products operating on Cartesian three-vectors. The unit vector is constructed along the vector between the dipoles under consideration, and are unit lattice vectors. The Monte-Carlo method progresses with a Metropolis algorithm. A random lattice position is chosen, and a random new direction for the cation molecular dipole. The energy change () is computed with unshielded () dipole-dipole interactions. Exothermic moves are automatically accepted; endothermic moves are accepted if where is a random variable on , is . For numerical efficiency we simulate on-lattice, with a cut-off for dipole-dipole interactions of three lattice units; this allows for attempted Monte-Carlo moves per second on standard hardware.
At equilibrium, we associate an electric displacement related to and the polarisation density by
| (4) |
The polarisation density can be calculated by a summation over the microscopic dipoles. refers to the static relative permittivity, rather than dielectric constant, as it is a function of temperature.
| (5) |
We can reconstruct the dipole potential felt at an arbitrary lattice site by summing the potential contribution from all other lattice sites
| (6) |
The main simulation variables are the strength of the interactions. Considering a point dipole-dipole interaction between unshielded methyl-ammonium dipoles (D)5 at the unit cell spacing of 6.29 , this energy is , which we take in this work as exactly T (T = 300). From here we take , allowing the dipoles to freely rotate without frustration.
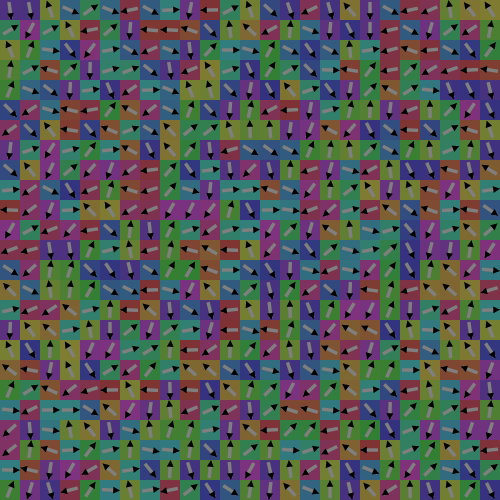
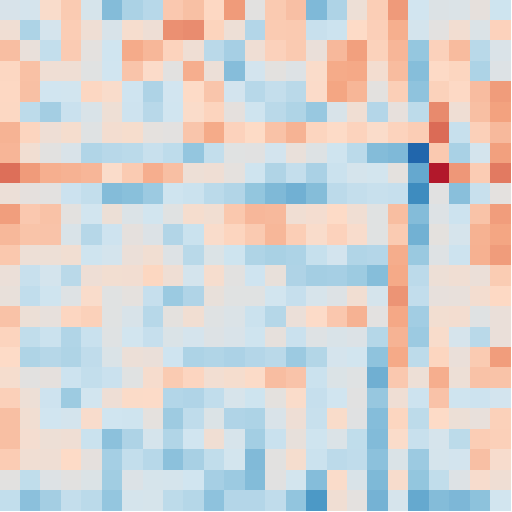
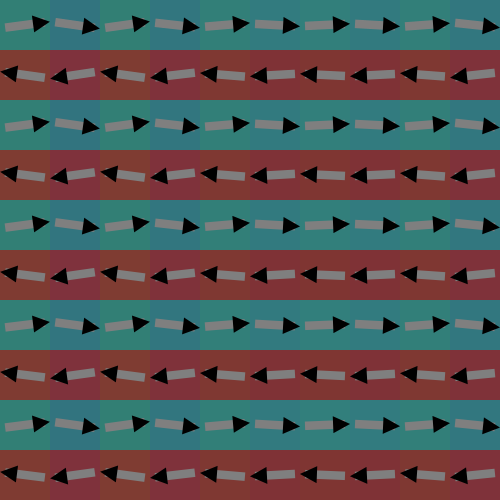
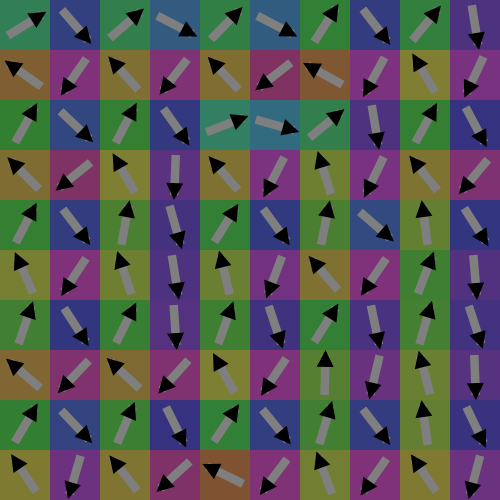
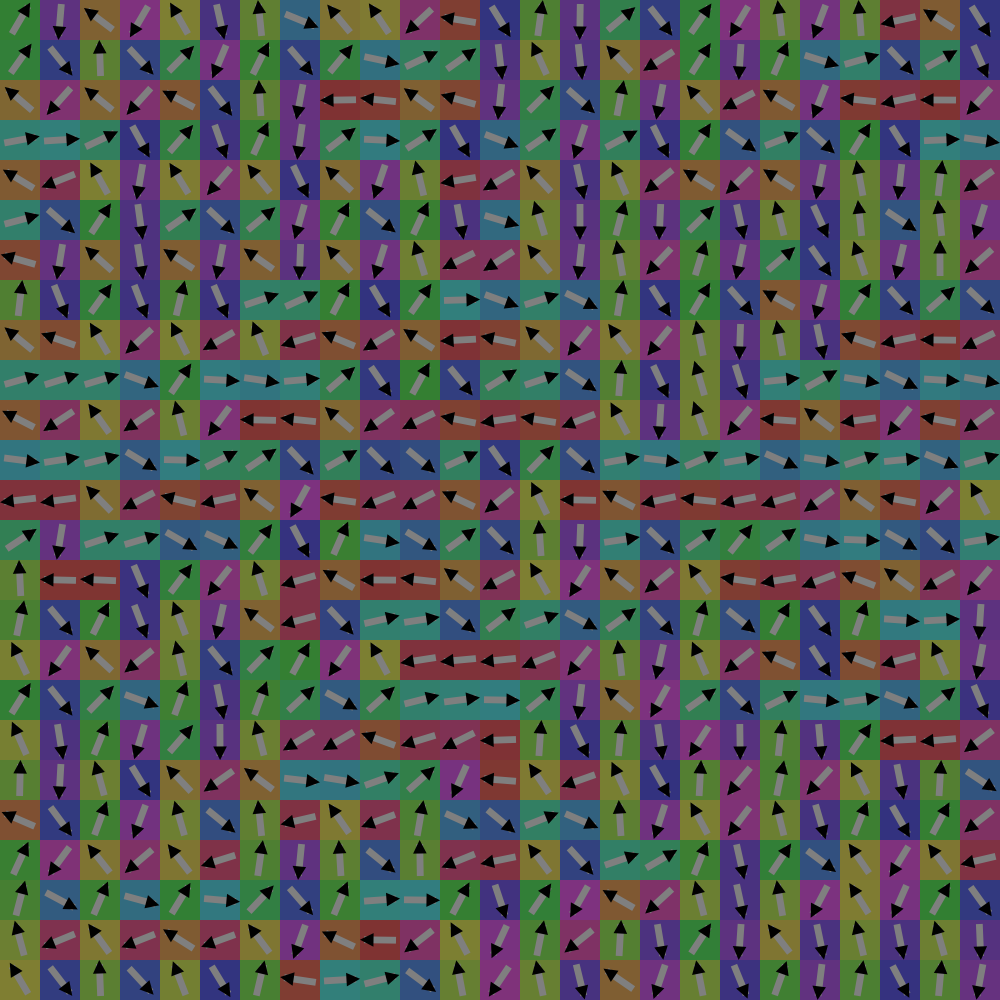
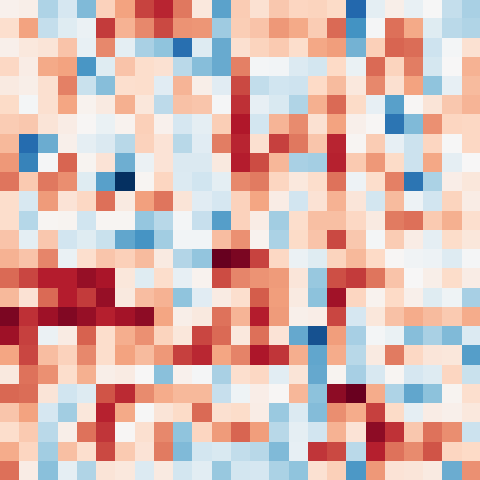
Equilibrium behaviour at room temperature. The domain structure of an equilibrated film with zero applied field is shown in Figure 2. Twinning of the MA dipoles occurs to minimise the free energy. This leads to aligned domains along the square axes (as cofacial alignment minimises the dipole-dipole distance compared to diagonal). Visualising the resulting dipole potential that comes from this alignment, we observe the presence of structured interpenetrating regions of high and low electric potential, following the features in the domain boundaries.
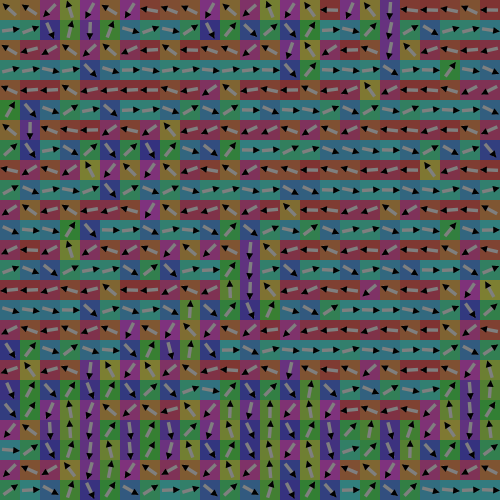
The temperature dependence of the domain structure is shown in Figure 3. At 0 K, a striped anti-ferroelectric phase is favoured, which becomes increasingly disordered as the temperature increases due to the role of configuration entropy. The room temperature phase could be viewed as superparaelectric, consisting of randomly oriented linear ferroelectric domains, while the domains are broken to give a paraelectric phase at 1000 K.
The effective simulation temperature varies linearly with respect to the Hamiltonian interaction energies. As our model currently has a point-dipole approximated interaction energy, and ignores energetic contributions from the cage strain, or ion inertia (freely rotating dipoles), simulation temperature cannot be expected to correspond directly to physical temperature.
Electric field dependence of polarisation. For a solar cell to operate the electrical contacts must be selective—a difference in work function must exist between the front and back contacts. This selectivity induces a built-in potential that at short–circuit (or in the dark) results in an electric field across the device, which acts to sweep out generated charge. Current collection at short–circuit is therefore generally maximised. Here we assume that the perovskite solar cells, without intentional doping, are type; the potential drops linearly across the active material, producing a constant electric field. When a voltage is applied in forward bias, it works to counteract this built-in field. At the maximal power point for a relatively optimal solar cell material such as MAPI, the operating voltage is close to the open–circuit voltage, which is close to the built-in potential and so only a small electrical field will apply across the device.
In typical perovskite solar cells, the layer thickness is of order hundreds of nanometres, and the built in voltage of . In the absence of charge equalisation effects, this results in an electric field of 1 to 10 across the hybrid perovskite. The interaction energy of the MA dipole with this field is , 0.48 for a upper limit field strength of 10 . This is a relatively small perturbation compared to the dipole-dipole interaction of .
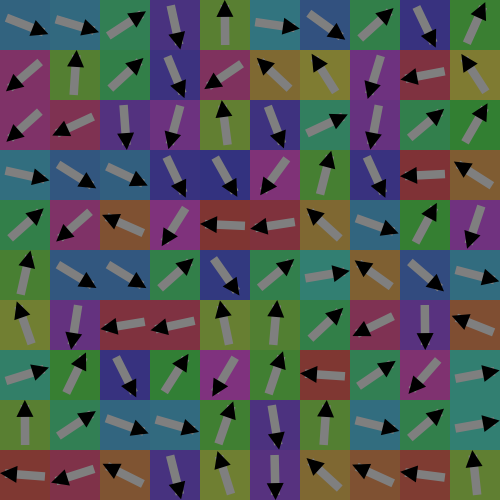
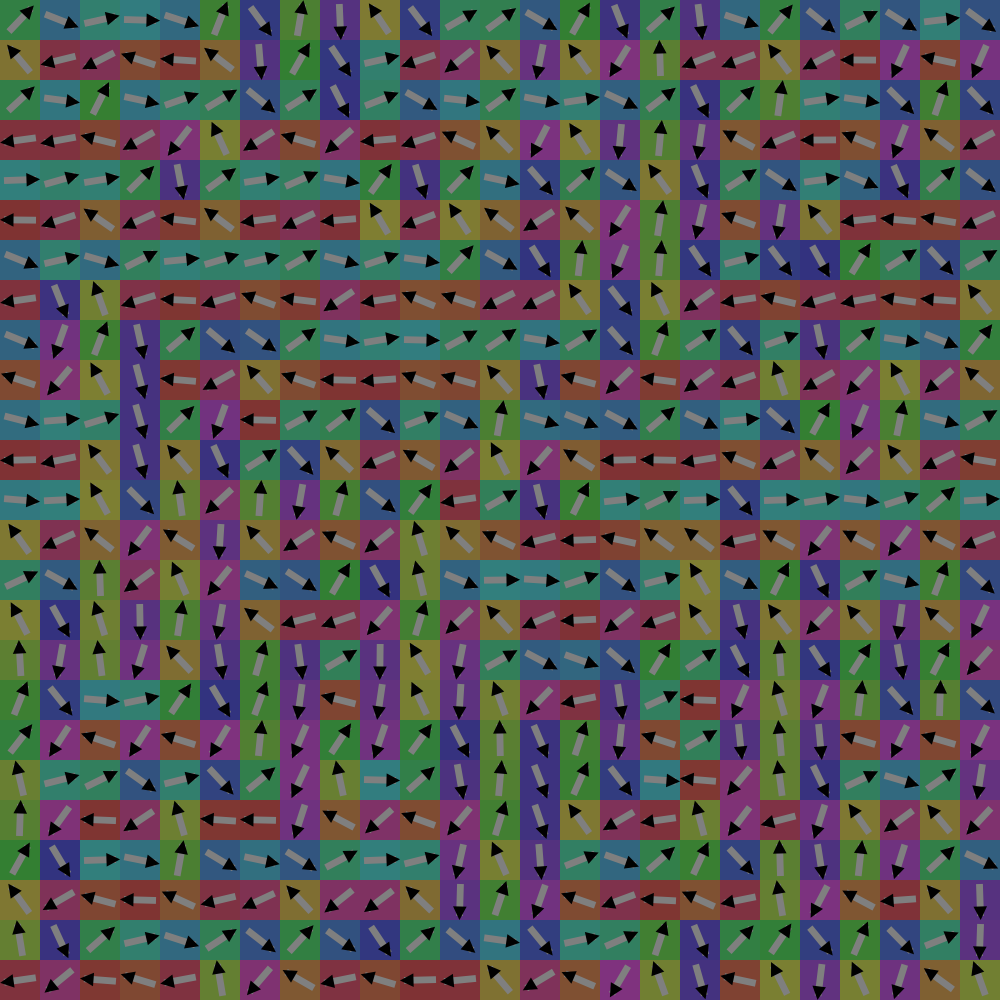
The alignment of the dipoles as a result of the applied field is shown in Figure 4; the dipoles rearrange to partially counteract the applied field. The response in overall dipole alignment is in the direction of the field (versus background fluctuation for no-applied field We emphasise that it took Monte-Carlo moves per lattice site to achieve this equilibrium structure, well beyond where total energy and Debye polarisation appeared to have approached their equilibrium asymptotes.
Though such a small perturbation from the built-in field exhibits negligible visual effect on the alignment (Figure 4 – Top), the effect on the dipole potential (Figure 4 – Middle) is strong, leading to deeper more segregated regions of positive and negative potential.
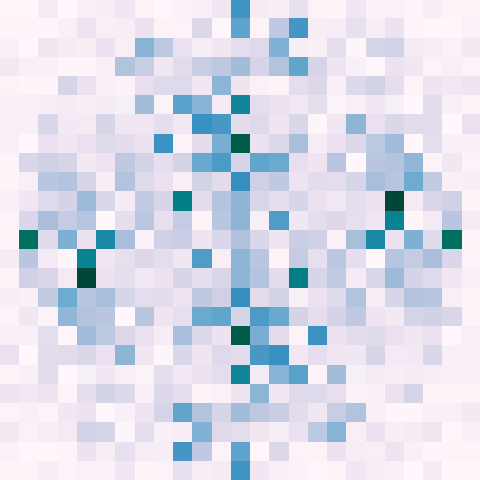
We quantitatively evaluate the change in the structure of the dipole potential by a two-dimensional Fourier transform (Figure 4 – Bottom). Here we see that the zero field (open–circuit) equilibrium structure is equally distributed in both axes, and the density along the origin indicating the presence of linear features. We interpret these short–circuit features as being the development of carrier traps by the dipole domain response to the built-in field; at open–circuit the extended ridges and valleys in potential could act as channels in which charge transport can take place. Understanding the true role of these features and quantifying the effect on device performance will require a sophisticated device model and an improved understanding of the nature of charge carriers and charge transport in this class of materials.
Particularly, the size of the carrier polarons in these materials will heavily affect the influence of such local inhomogeneiity in the electrostatic potential on charge transport. The Fröhlich coupling constant is estimated to be using published band parameters for MAPI (, , ) and a longitudinal optical phonon frequency of 9 THz. This indicates an intermediate electron-lattice coupling, phonon dressing leading to a 25% increase in the effective mass by the Feynman variational treatment28. The electron and hole polaron radii would correspond to approximately 5 perovskite unit cells, sufficiently small to be influenced by inhomogeneity in the local electrostatic potential we predict. We therefore consider it plausible that such variations in electrostatic potential will drive both carrier polaron segregation (open–circuit dipole structure) and trapping (short–circuit dipole structure), leading to increased bulk recombination at short–circuit.
Recently we have been made aware of inverted MAPI perovskite cell designs capped with a fullerene electron accepting layer, which exhibit reduced hysteresis.29 We interpret this as a result of gaps in the MAPI film resulting in high penetration of the fullerene, forming a heterojunction. This effectively quenches the recombination, as electron extraction into the fullerene phase out competes recombination. In comparison to fullerene, \ceTiO2 is a poor (slow) electron acceptor.
Additional ferroelectric contributions. Beyond molecular dipole reorientations, additional ferroelectric contributions include distribution of free carriers (electrons and holes), as well as rotations and titling of the \cePbI3- cage structure. The formation of points defects including \ceI2- defect complexes30 and charged Pb vacancies31 have been suggested, which may also respond to an applied electric field. Previous impedance analysis have also suggested room temperature ionic conductivity in these materials.32
Under short–circuit conditions the MAPI layer will be polarized due to the alignment of dipoles, as demonstrated in our simulations. If the system is then placed in open–circuit conditions the polarization of MAPI is removed; however, the depolarization field consisting of charge carriers will take time to re-equilibrate. There will necessarily be feedback between the ferroelectric domain structure (slower process) and carrier distribution (faster process), therefore causing a further hysteretic contribution to current-voltage measurements. Additionally, the electric field across the absorber (under short–circuit conditions) would lead to an alignment of the cage polarisation (rotation and titling) and domain structure present in the hybrid perovskite film, which is likely to be over a longer time scale than the dipole reorientation. The realignment of these domains upon removal or reversal of the field is another possible source of hysteresis.
In this work we have shown through ab-initio molecular dynamics that the methyl-ammonium ion is rotationally mobile in hybrid perovskites at room temperature, and that the material is structurally soft. This material behaviour may be fortuitous in terms of facilitating transport across grain boundaries when combined with the calculated large polaron transport and small effective masses.5 The large site variation of the ions deserves further study in terms of its effect on material polarisation and ferroelectric response. Further investigation of the molecular dynamics will include expanding the simulation volume and analysing the trajectories further. Additional work with the Monte-Carlo codes are required to extend the simulation to three dimensional perovskite volumes, introduce other move types (such as movement of ions both within the lattice cells, and as net migration through the film), and extend the simulated experiments to other relevant device physics. More sophisticated interaction terms for the molecular cations would increase the expected accuracy of these codes.
In conclusion, we have investigated the behaviour of the dipolar methyl-ammonium cation in \ceCH3NH3PbI3 using numerical simulations, which have provided insights into the domain structure and polarisation fields, which will be important for developing quantitative models to explain the unusual device physics of hybrid perovskite solar cells.
Acknowledgements. We are grateful for useful discussions with Piers Barnes and Aurélien Leguy (Imperial College London), chiefly concerning the role of the electric field in these materials. The molecular dynamics in this work was instigated to interpret their (unpublished) neutron scattering data. We thank Laurie Peter and Petra Cameron (University of Bath) for useful discussions on hysteresis in perovskite solar cells. We acknowledge membership of the UK’s HPC Materials Chemistry Consortium, which is funded by EPSRC grant EP/F067496. Additional computing resources were provided via the PRACE project UltraFOx. J.M.F. and K.T.B. are funded by EPSRC Grants EP/K016288/1 and EP/J017361/1, respectively. A.W. acknowledges support from the Royal Society and ERC (Grant 277757).
Computational Details
The set-up for density functional theory (DFT) calculations of the primitive unit cells of \ceCH3NH3PbI3 with a range of molecular orientations, including structure optimisation and static dielectric response,21, 15 as well as the lattice polarisation and barriers to rotation,5 have been previously reported. These were taken as the starting point for the MD simulations in this study.
Molecular dynamics (MD). Finite temperature Newtonian MD simulations were performed based on the atomic forces calculated at each timestep using DFT (-point sampling with the PBESol functional and a 400 eV plane wave cutoff). The starting configuration was a fully relaxed pseudo-cubic supercell (with a -grid) with MA ions aligned along the direction. Spin-orbit coupling is not treated primarily due to the prohibitive computational expense; as orbital occupation is not changed for the undoped system, the effect on the atomic forces is expected to be negligible. Trajectory data were collected every 50 integration steps (25 ). A Nosé thermostat (canonical ensemble) was used with a Nosé mass of 3. Custom codes were written for the analysis, with the help of the MDAnalysis library.33 A total of 58 (2319 frames) of data was used for analysis, after an equilibration run of 5 . This generated 18547 unique MA alignment vectors.
Monte Carlo (MC). The MC implementation uses a Mersenne Twister34 pseudo random number generator; the code is serial (running at on modest hardware), but efficient uses of computational resources is achieved by making ensemble runs with GNU Parallel35. The modestly sized simulations presented here can be extended up to full device sized simulations, with well defined statistics over ensemble runs. The initial state is a lattice of randomised dipoles. The resulting classical Hamiltonian dipole Monte Carlo code, StarryNight, is available as a source code repository on GitHub.36 Codes to interpret the ab-initio molecular dynamics used in the production of this manuscript are similarly available.37
References
- Edri et al. 2014 E. Edri, S. Kirmayer, S. Mukhopadhyay, K. Gartsman, G. Hodes, and D. Cahen, Nat. Commun. 5, 3461 (2014).
- Gonzalez-Pedro et al. 2014 V. Gonzalez-Pedro, E. J. Juárez-Pérez, W. S. Arsyad, E. M. Barea, F. Fabregat-Santiago, I. Mora-Sero, and J. Bisquert, Nano Lett. 14, 888 (2014).
- Snaith et al. 2014 H. J. Snaith, A. Abate, J. M. Ball, G. E. Eperon, T. Leijtens, N. K. Noel, S. D. Stranks, J. T.-W. Wang, K. Wojciechowski, and W. Zhang, J. Phys. Chem. Lett. 5, 1511 (2014).
- Even, Pedesseau, and Katan 2014 J. Even, L. Pedesseau, and C. Katan, J. Phys. Chem. C (2014).
- Frost et al. 2014 J. M. Frost, K. T. Butler, F. Brivio, C. H. Hendon, M. van Schilfgaarde, and A. Walsh, “bibfield journal “bibinfo journal Nano Letters“ “textbf “bibinfo volume 14,“ “bibinfo pages 2584 (“bibinfo year 2014).
- Glazer 1972 A. Glazer, Acta Cryst. B 28, 3384 (1972).
- Lines and Glass 1977 M. E. Lines and A. M. Glass, Principles and applications of ferroelectrics and related materials (Oxford University Press, 1977).
- Starkiewicz, Sosnowski, and Simpson 1946 J. Starkiewicz, L. Sosnowski, and O. Simpson, “bibfield journal “bibinfo journal Nature“ “textbf “bibinfo volume 158,“ “bibinfo pages 28 (“bibinfo year 1946).
- Fridkin and Popov 1978 V. M. Fridkin and B. N. Popov, “bibfield journal “bibinfo journal Sov. Phys. Usp.“ “textbf “bibinfo volume 21,“ “bibinfo pages 981 (“bibinfo year 1978).
- Neumark 1962 G. Neumark, “bibfield journal “bibinfo journal Phys. Rev.“ “textbf “bibinfo volume 345 (“bibinfo year 1962).
- Johnson, Williams, and Mee 1975 H. R. Johnson, R. H. Williams, and C. H. B. Mee, “bibfield journal “bibinfo journal J. Phys. D: Appl. Phys.“ “textbf “bibinfo volume 8,“ “bibinfo pages 1530 (“bibinfo year 1975).
- von Baltz 1981 R. von Baltz, “bibfield journal “bibinfo journal Ferroelectrics“ “textbf “bibinfo volume 35,“ “bibinfo pages 131 (“bibinfo year 1981).
- Poglitsch and Weber 1987 A. Poglitsch and D. Weber, “bibfield journal “bibinfo journal J. Chem. Phys.“ “textbf “bibinfo volume 87,“ “bibinfo pages 6373 (“bibinfo year 1987).
- Onoda-Yamamuro, Matsuo, and Suga 1992 N. Onoda-Yamamuro, T. Matsuo, and H. Suga, J. Phys. Chem. Sol. 53, 935 (1992).
- Brivio et al. 2014 F. Brivio, K. T. Butler, A. Walsh, and M. van Schilfgaarde, Phys. Rev. B. 89, 155204 (2014).
- Wasylishen, Knop, and Macdonald 1985 R. Wasylishen, O. Knop, and J. Macdonald, Sol. Stat. Commun. 56, 581 (1985).
- Onoda-Yamamuro, Matsuo, and Suga 1990 N. Onoda-Yamamuro, T. Matsuo, and H. Suga, J. Phys. Chem. Sol. 51, 1383 (1990).
- Kawamura, Mashiyama, and Hasebe 2002 Y. Kawamura, H. Mashiyama, and K. Hasebe, J. Phys. Soc. Japan 71, 1694 (2002).
- Choi et al. 2013 J. J. Choi, X. Yang, Z. M. Norman, S. J. Billinge, and J. S. Owen, Nano Lett. 14, 127 (2013).
- Zushi et al. 2014 M. Zushi, A. Suzuki, T. Akiyama, and T. Oku, Chem. Lett. 43, 916 (2014).
- Brivio, Walker, and Walsh 2013 F. Brivio, A. B. Walker, and A. Walsh, APL Mater. 1, 042111 (2013).
- MAP 2014 “enquote “bibinfo title Video: Methyl ammonium lead iodide (mapi) pervoskite - 2x2x2 supercell md,“ \urlprefix\@@endlink (\bibinfoyear 2014)\BibitemShutNoStop
- SI_2014 \BibitemOpen\href@noop \enquote\bibinfotitle See supplementary material for details. \bibinfohowpublished \urlhttps://aip.org/ (\bibinfoyear 2014)\BibitemShutNoStop
- \citenamefontAnderson 1994 \BibitemOpen\bibfieldauthor \bibinfoauthor \bibfnamefontP. W. \bibnamefontAnderson, \href@noop \bibinfotitle Theory of Ferroelectric Behaviour of Barium Titanate, reprinted in A Career in Theoretical Physics (\bibinfopublisher World Scientific, \bibinfoyear 1994)\BibitemShutNoStop
- \citenamefontCochran 1960 \BibitemOpen\bibfieldauthor \bibinfoauthor \bibfnamefontW. \bibnamefontCochran, \href\doibase10.1080/00018736000101229 \bibfieldjournal \bibinfojournal Adv. Phys. \bibinfovolume 9, \bibinfopages 387 (\bibinfoyear 1960)\BibitemShutNoStop
- \citenamefontCochran 1961 \BibitemOpen\bibfieldauthor \bibinfoauthor \bibfnamefontW. \bibnamefontCochran, \href\doibase10.1080/00018736100101321 \bibfieldjournal \bibinfojournal Adv. Phys. \bibinfovolume 10, \bibinfopages 401 (\bibinfoyear 1961)\BibitemShutNoStop
- \citenamefontMcConnell 1980 \BibitemOpen\bibfieldauthor \bibinfoauthor \bibfnamefontJ. R. \bibnamefontMcConnell, \href@noop \bibinfotitle Rotational Brownian motion and dielectric theory (\bibinfopublisher Academic Press, \bibinfoyear 1980)\BibitemShutNoStop
- \citenamefontFeynman 1955 \BibitemOpen\bibfieldauthor \bibinfoauthor \bibfnamefontR. P. \bibnamefontFeynman, \href\doibase10.1103/PhysRev.97.660 \bibfieldjournal \bibinfojournal Physical Review \bibinfovolume 97, \bibinfopages 660 (\bibinfoyear 1955)\BibitemShutNoStop
- \citenamefontXiao et al. 2014 \BibitemOpen\bibfieldauthor \bibinfoauthor \bibfnamefontZ. \bibnamefontXiao, \bibinfoauthor \bibfnamefontC. \bibnamefontBi, \bibinfoauthor \bibfnamefontY. \bibnamefontShao, \bibinfoauthor \bibfnamefontQ. \bibnamefontDong, \bibinfoauthor \bibfnamefontQ. \bibnamefontWang, \bibinfoauthor \bibfnamefontY. \bibnamefontYuan, \bibinfoauthor \bibfnamefontC. \bibnamefontWang, \bibinfoauthor \bibfnamefontY. \bibnamefontGao, and \bibinfoauthor \bibfnamefontJ. \bibnamefontHuang, \href@noop \bibfieldjournal \bibinfojournal Energy Environ. Sci. (\bibinfoyear 2014)\BibitemShutNoStop
- \citenamefontDu 2014 \BibitemOpen\bibfieldauthor \bibinfoauthor \bibfnamefontM. H. \bibnamefontDu, \href\doibase10.1039/C4TA01198H \bibfieldjournal \bibinfojournal J. Mater. Chem. A \bibinfovolume 2, \bibinfopages 9091 (\bibinfoyear 2014)\BibitemShutNoStop
- \citenamefontYin, \citenamefontShi, and \citenamefontYan 2014 \BibitemOpen\bibfieldauthor \bibinfoauthor \bibfnamefontW.-J. \bibnamefontYin, \bibinfoauthor \bibfnamefontT. \bibnamefontShi, and \bibinfoauthor \bibfnamefontY. \bibnamefontYan, \href@noop \bibfieldjournal \bibinfojournal Appl. Phys. Lett. \bibinfovolume 104, \bibinfopages 063903 (\bibinfoyear 2014)\BibitemShutNoStop
- \citenamefontMaeda et al. 1997 \BibitemOpen\bibfieldauthor \bibinfoauthor \bibfnamefontM. \bibnamefontMaeda, \bibinfoauthor \bibfnamefontM. \bibnamefontHattori, \bibinfoauthor \bibfnamefontA. \bibnamefontHotta, and \bibinfoauthor \bibfnamefontI. \bibnamefontSuzuki, \href@noop \bibfieldjournal \bibinfojournal J. Phys. Soc. Japan \bibinfovolume 66, \bibinfopages 1508 (\bibinfoyear 1997)\BibitemShutNoStop
- \citenamefontMichaud-Agrawal et al. 2011 \BibitemOpen\bibfieldauthor \bibinfoauthor \bibfnamefontN. \bibnamefontMichaud-Agrawal, \bibinfoauthor \bibfnamefontE. J. \bibnamefontDenning, \bibinfoauthor \bibfnamefontT. B. \bibnamefontWoolf, and \bibinfoauthor \bibfnamefontO. \bibnamefontBeckstein, \href\doibase10.1002/jcc.21787 \bibfieldjournal \bibinfojournal J. Comput. Chem. \bibinfovolume 32, \bibinfopages 2319 (\bibinfoyear 2011)\BibitemShutNoStop
- \citenamefontMatsumoto and \citenamefontNishimura 1998 \BibitemOpen\bibfieldauthor \bibinfoauthor \bibfnamefontM. \bibnamefontMatsumoto and \bibinfoauthor \bibfnamefontT. \bibnamefontNishimura, \href\doibase10.1145/272991.272995 \bibfieldjournal \bibinfojournal ACM Trans. Model. Comput. Simul. \bibinfovolume 8, \bibinfopages 3–30 (\bibinfoyear 1998)\BibitemShutNoStop
- \citenamefontTange 2011 \BibitemOpen\bibfieldauthor \bibinfoauthor \bibfnamefontO. \bibnamefontTange, \hrefhttp://www.gnu.org/s/parallel \bibfieldjournal \bibinfojournal ;login: The USENIX Magazine \bibinfovolume 36, \bibinfopages 42 (\bibinfoyear 2011)\BibitemShutNoStop
- Git 2014a \BibitemOpen\href\doibase10.5281/zenodo.10543 \enquote\bibinfotitle Monte Carlo codes, \bibinfohowpublished \urlhttps://github.com/WMD-Bath/StarryNight (\bibinfoyear 2014a)\BibitemShutNoStop
- Git 2014b \BibitemOpen\href\doibase10.5281/zenodo.10545 \enquote\bibinfotitle Molecular Dynamics analysis codes and data, \bibinfohowpublished \urlhttps://github.com/jarvist/MAPI-MD-analysis (\bibinfoyear 2014b)\BibitemShutNoStop


Supplemental Materials: Ferroelectric contribution to anomalous hysteresis in hybrid perovskite solar cells
Exploitation of the symmetry of the cubic perovskite lattice is essential to improve the signal-to-noise ratio of computationally expensive molecular dynamics data. However this is difficult to visualise, and so we provide Figure S1 explicitly showing how starting (a) with no symmetry, we first (b) fold the data into the first octant and then reflect along the three lines of symmetry radiating from the diagonal to arrive at (c), a 48 fold increase in density.
To reduce an arbitrary three-vector onto this reflection domain, we first take the absolute value of the Cartesian components (reflecting into the first octant), then sort the elements of the vector by size (which applies a three-plane reflection about ). This is implemented in Python as sorted(abs(r)).
In this work we alternatively define the histogram bins for our methylammonium vectors by their angular nearness to the face (), edge () and diagonal () vectors, with respect to the cubic perovskite lattice. This partitions the cube into 6 regions around the face, 12 regions around the edges and 8 regions around the diagonals. The boundary between these regions is midway on the grand-circle route between the high symmetry points; this is similar in construction to a Wigner-Seitz cell but on the surface of a sphere. In Figure S2 we present a projection of the random spherical vectors used in Monte-Carlo integration to define the area of these zones of influence and thus the weighting to allow direct comparison of methylammonium alignment.