∎
22email: marc.sauvage@cea.fr 33institutetext: K. Okumura 44institutetext: Commissariat à l’Energie Atomique, IRFU, Orme des Merisiers, Bât. 709, 91191 Gif/Yvette, France 55institutetext: U. Klaas 66institutetext: Max-Planck-Institut für Astronomie, Königstuhl 17, 69117 Heidelberg, Germany 77institutetext: Th. Müller, A. Poglitsch, H. Feuchtgruber 88institutetext: Max-Planck-Institut für extraterrestrische Physik, Giessenbachstraße, 85748 Garching, Germany 99institutetext: A. Moór 1010institutetext: Konkoly Observatory, MTA CSFK, Konkoly Thege Miklós út 15-17, 1121 Budapest, Hungary 1111institutetext: L. Duband 1212institutetext: Commissariat à l’Energie Atomique, INAC, Service des Basses Températures, 17, rue des Martyrs, 38054 Grenoble, France
Operations and Performance of the PACS Instrument 3He Sorption Cooler on board of the Herschel Space Observatory††thanks: Herschel is an ESA space observatory with science instruments provided by European-led Principal Investigator consortia and with important participation from NASA.
Abstract
A 3He sorption cooler produced the operational temperature of 285 mK for the bolometer arrays of the Photodetector Array Camera and Spectrometer (PACS) instrument of the Herschel Space Observatory. This cooler provided a stable hold time between 60 and 73 h, depending on the operational conditions of the instrument. The respective hold time could be determined by a simple functional relation established early on in the mission and reliably applied by the scientific mission planning for the entire mission. After exhaustion of the liquid 3He due to the heat input by the detector arrays, the cooler was recycled for the next operational period following a well established automatic procedure. We give an overview of the cooler operations and performance over the entire mission and distinguishing in-between the start conditions for the cooler recycling and the two main modes of PACS photometer operations. As a spin-off, the cooler recycling temperature effects on the Herschel cryostat 4He bath were utilized as an alternative method to dedicated Direct Liquid Helium Content Measurements in determining the lifetime of the liquid Helium coolant.
Keywords:
Herschel PACS SPIRE telescopes space vehicles: instrumentation instrumentation: photometers calibration space cryogenics sorption coolers 3He system1 Introduction
The Herschel Space Observatory Refpilbratt10 with its 3.5 m telescope provided an excellent platform for FIR observations with unprecedented sensitivity, photometric accuracy and spatial resolution. The FIR instrument PACS Refpoglitsch10 employed the largest detector arrays Refbillot10 ever flown in space. Its bolometer arrays needed to be cooled to an operational temperature of 285 mK, which was achieved by means of a 3He sorption cooler inside the instrument. We give a short overview of this type of device, which was also used for the SPIRE Refgriffin10 instrument, the recycling process and the characterization of the cooler hold time, which was an essential parameter for the Herschel scientific mission planning. We present a statistics and characteristics of all PACS cooler cycles over the entire Herschel mission. Finally we sketch a method utilizing the thermal interaction of the sorption cooler pump and the 4He coolant in the Herschel cryostat, by dumping a constant heat input, for determining the remaining liquid 4He mass and hence its lifetime.
2 The PACS 3He Sorption Cooler
The Herschel flight model cooler is described in detail in Refduband08 . Fig. 1 gives a 3D view of the device showing its main components.
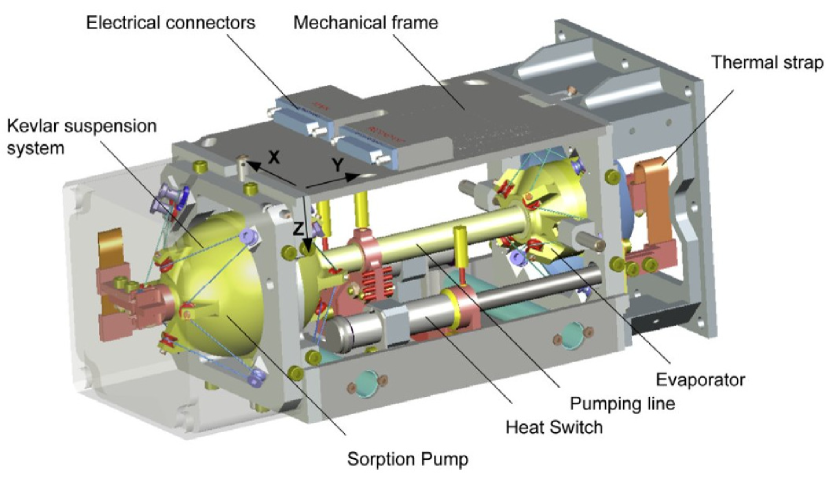
The evaporator contains a porous material, an alumina sponge (91 % Al2O3 / 9 % SiO2), which traps the liquid 3He during the cold state. This liquid 3He evaporates providing the cooling to the detector focal plane. When all the liquid 3He has been evaporated into the gas phase, it needs to be recycled. The gaseous 3He flows into the sorption pump which contains active charcoal for adsorption of the gas.
3 Procedure of the Cooler Recycling
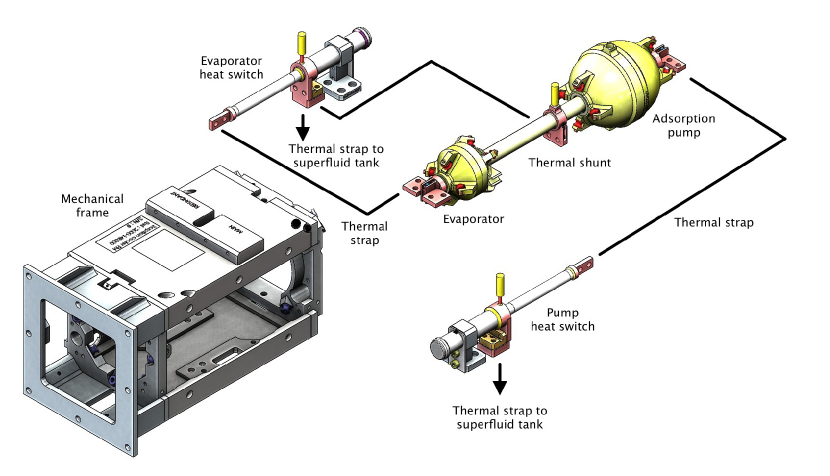
Fig. 2 provides a schematic view of the PACS cooler elements and their thermal connection to the bolometer detector focal plane unit and the liquid 4He bath of the Herschel cryostat, also referred to as the level 0 of the thermal system, L0, at 1.7 K.
Fig. 3 shows the evolution of the temperatures relevant for the cooler during the different steps of the recycling process as monitored via Housekeeping (HK) parameters from temperature sensors. At the beginning, the evaporator temperature (TEMP_EV) is around 2 K indicating that the cooler has run out of liquid coolant. The recycling procedure is completely controlled via heaters and heat switches integrated in the cooler. The heat switches are of the gas-gap type, where the presence or absence of gas between two interlocked copper parts changes drastically the heat flow between them. Gas handling is achieved with a miniature cryogenic adsorption pump (RefDuband95 ).
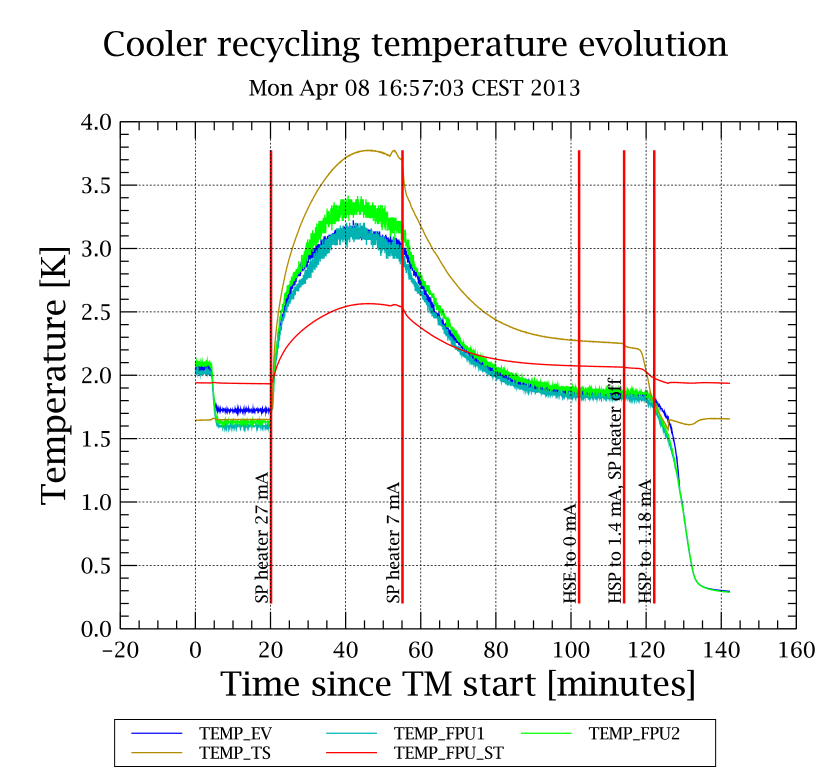
The first 15 minutes serve to settle the thermal environment. The pump heat switch (HSP in Fig. 2) has to be open, so that the pump does not dissipate heat into the instrument. The evaporator heat switch (HSE in Fig. 2) is closed so that the evaporator thermalizes with the 2 K level and does not warm up too much when the pump is heated and thus still traps condensing gas. The heat switches HSP and HSE are closed by applying a current and opened by setting the current to zero.
The recycling proper starts with heating the sorption pump (SP) to desorb the gas that has been trapped in the active charcoal. After 35 min the heater current is lowered to keep the pump at the required temperature of about 40 K. At this time 3He out-gases from the pump and condenses. TEMP_EV rises following the temperature rise of the pump both because the enthalpy of the hot gas coming from the pump is not fully removed by the thermal shunt and due to the latent heat of 3He. Since the evaporator and the shunt are connected to the same thermal strap, all variations happening at the shunt are also registered by the evaporator temperature sensor (TEMP_EV). TEMP_EV decreases when the pump is kept at the required temperature. At around 80 min TEMP_EV drops below the 2 K level. The finally achieved TEMP_EV in this step characterizes the efficiency of the recycling.
After 82 min the evaporator heat switch (HSE in Fig. 2) is opened (HSE = 0 mA) to thermally isolate the evaporator. To establish the cooling functionality the pump heater is switched off after 94 min and the pump is re-connected to the 2 K level by closing the pump switch (HSP in Fig. 2). Once the pump is connected to the 2 K level the charcoal in the pump starts pumping and the 3He pressure drops. The thermally insulated liquid 3He decreases in temperature to below the 300 mK level which is reached after around 142 min.
The cooler recycling procedure with the tuned time steps as described above proceeded fully automatically. The duration of the PACS-only cooler recycling block was 142.37 min, the duration of the parallel mode cooler recycling block 172.53 min. This automatic cooler recycling procedure implemented by means of the Herschel Common Uplink System (CUS) is documented in the online appendix section 9.
4 Establishment of the Cooler Hold Time Relation for Herschel Mission Planning
The Herschel Space Observatory executed its observations autonomously along a Mission Timeline (MTL) stored on-board, while ground contact was only during the normally 3 h long Daily Telecommunication Period (DTCP). The mission was divided into Operational Days (ODs) of on average approximately 24 h duration, each beginning with a DTCP during which the MTL for a forth-coming OD was uploaded. This pre-planned automatic command execution without the possibility of human intervention meant that a reliable prediction of the cooler hold time for PACS photometer operations was necessary. The cooler hold time was defined as the period between TEMP_EV going below 300 mK at the end of the recycling process (cf. Sect. 3 and Fig. 3) and TEMP_EV exceeding 320 mK when liquid Helium in the cooler was exhausted.
The essential parameter determining the length of the cooler hold time was the time when the PACS bolometer detectors were biased for measurement. This period was set by the so-called orbit prologue and orbit epilogue, engineering-type Astronomical Observations Requests (AORs) setting and resetting the detector bias and bracketing the sequence of science AORs. The so-called biased time was defined as the period between the start of an orbit prologue and the end of the subsequent orbit epilogue. Note, that several biased periods were possible during one single cooler hold time and the biased time quoted in Table 1 is the sum of all periods. From OD 128 onwards, the final optimum bias voltages of the PACS detectors were always applied, but on earlier ODs of the Performance Verification and Commissioning Phases bias settings were varied during detector characterization and optimization periods, which can have some impact on the resulting hold time.
Such a dependence was monitored right from the beginning of the
mission and after about three quarters of a year there was
enough statistics to derive a relation as shown in
Fig. 4. The relation
| (1) |
established from all complete cooler periods up to OD 270, irrespective of the start conditions or whether it was a PACS only or parallel mode cooler recycling, was reliably used in the scientific mission scheduling until the end of the mission with a last PACS cooler recycling on OD 1443. The formula was applied for determination of the cooler hold time following both a PACS only and a parallel mode (together with the SPIRE cooler) recycling.
In eqn.(1) thold can be written as with tidle being the fraction of the hold time period with the PACS bolometer detectors not biased, e.g. during spacecraft operational maintenance windows or SPIRE only operations in parallel mode.
In case t0, then eqn.(1) can be
re-written as
| (2) |
This meant that a contiguous block of about 2.5 ODs of photometer observations could be scheduled, thus minimizing the cooler recycling frequency. The remaining 0.5 OD was usually filled with PACS spectrometer observations, not requiring 3He cooling, by switching between the two PACS sub-instruments.
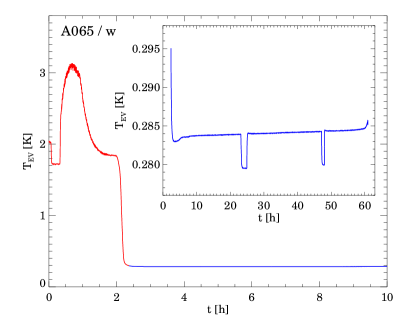
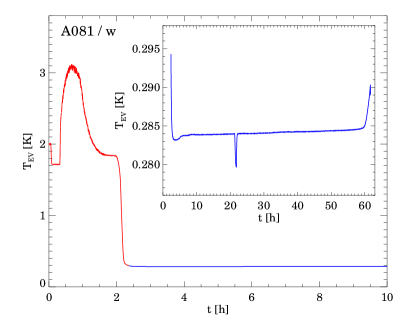
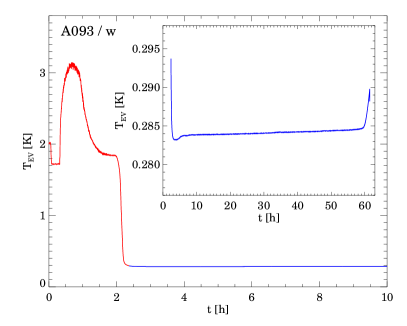
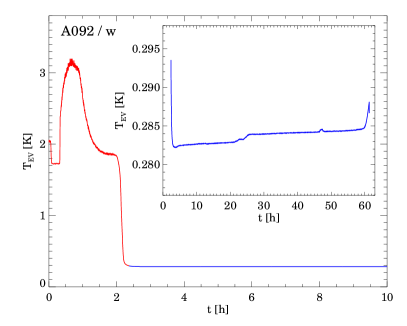
Since the cooler hold time relation in eqn.(1) was determined for the point in time when the evaporator temperature exceeded an out-of-limit value of 320 mK, a safety time buffer was included when using this relation for mission planning, thus reducing tbias,max by tbuffer. Since the evaporator temperature increased very steeply only at the end of the cooler hold time (see Fig. 5), a buffer of 1.5 h was deemed sufficient initially. However, inspection of photometer calibration observations, scheduled deliberately at the end of the cooler period for cross-calibration with subsequently scheduled PACS spectrometer observations of the same target, showed that there was already an increase in the evaporator temperature (cf. the course of the temperature in Fig. 5 with an increase of up to 5 mK for the two cycles labeled A081 and A093; for the naming convention see beginning of Sect. 5 and online Table 1) with an impact on the photometric calibration accuracy (Refbalog13 , Refnielbock13 ). This effect is described in detail and characterized by appropriate correction functions in Refmoor13 . Despite the final calibration and correction of this effect, it was decided to increase tbuffer to 3 h, which meant that the evaporator temperature increased by at most 1 mK at the end of the cooler period. This meant a maximum contiguous PACS photometer operation of 57.8 h.

5 Mission Statistics of Cooler Recycling
A total number of 239 PACS cooler recyclings was performed during the Herschel mission, the first one on OD 26 for PACS commissioning and the last one on OD 1443. 139 cooler recyclings were performed as PACS only (labeled “A” plus a sequence number), 100 recyclings in parallel with the SPIRE cooler recycling (labeled “B” plus a sequence number). It should be noted that the parallel cooler recyclings were not only performed for parallel mode observations of PACS and SPIRE, but also for separate PACS and SPIRE observations during the subsequent hold time periods. The SPIRE cooler hold time was restricted to about 48 h, the difference between the PACS and SPIRE cooler hold times was usually covered by PACS photometer observations to achieve the highest possible efficiency of each cooler recycling with regard to the foreseen and available photometer observing program.
Online Table 1 gives an overview of all cooler cycles with the achieved hold time and the duration of the PACS detector operations during this hold time. It can be recognized that in the beginning of the mission the detector operational times were relatively short owing to the step-by-step commissioning and performance assessment of the PACS photometer. From about OD 200 onwards, routine observations started achieving usually 40 – 50 h of photometer operations, but this depended also on the instrument allocation per Operational Day due to target visibility and priority of the observations. In the beginning, the PACS photometer was operated in a safe manner, it was switched into its standby mode by an orbit epilogue AOR, i.e. detectors were de-biased, at the end of each OD and whenever another instrument became prime. This is reflected in the usual 2 – 3 bias periods during this time. This safety aspect could be relaxed along the mission due to the smooth operation of the Herschel Space Observatory. From OD 675 onwards, the PACS photometer was switched to standby mode after the first OD of a photometer block, but was then left in biased mode for the subsequent 1.5 ODs. From OD 732 onwards, the PACS photometer was kept in biased mode for the full 2.5 ODs, thus reaching maximum biased times of up to 59.2 h, and later 57.8 h after increasing the buffer time at the end of the hold time (see Sect. 4). From OD 824 onwards, PACS and SPIRE were operated in most cases simultaneously in prime mode following a parallel cooler recycling without interference in their HK telemetry. This saved time, which had to be spent for the instrument set-up from standby into biased mode, for science observations, but did not mean full permanent observations with PACS during the biased time due to spacecraft operations windows or SPIRE only observations. Nevertheless, this final way of operation yielded the most optimum usage of the PACS and SPIRE photometers for science observations.
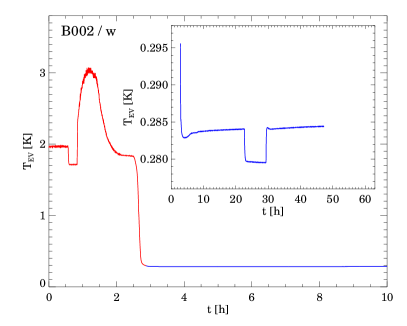
Fig. 5 shows individual cooler cycles from these different modes of operating the detectors. The periods of unbiased detectors can be clearly recognized by a temperature drop of about 4 mK. After biasing the detectors again, the temperature goes up to the previous level. There is a relatively smooth slight increase of the evaporator temperature during the cycle until the very end when the temperature rises much more steeply. Depending on the safety buffer, this final increase ranges from less than 1 mK for the 3 h buffer to about 5 mK for the 1.5 h buffer.
When inspecting the shape of the cooler evaporator temperature along the cooler cycle, we can distinguish two main types, as illustrated for two subsequent cycles undisturbed by detector bias switching in Fig. 6 (this characteristic difference applies in general also for cycles with detector bias switching).
-
1)
Following the drop to the operational temperature between 282 and 283 mK (if detectors are already biased), the evaporator temperature shows a flat increase. Around 24 h after the start of the cooler recycling, there is a 1 mK high swell in the temperature curve. This usually occurs at around 24 h (not always at exactly the same time), but there are some cases when it already occurs after less than 10 h or only after more than 30 h.
-
2)
Directly after the drop, there is an initial dip followed by the flat temperature rise. A swell does not occur during this cycle.
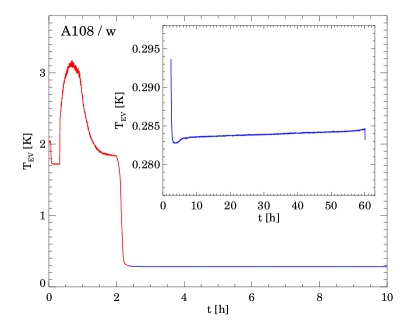
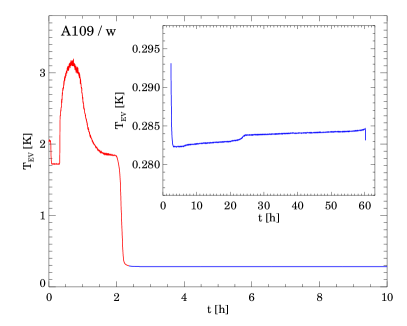
Most of the cooler cycles, both PACS only and parallel, show the “swell” shape. Column 9 in Table 1 indicates the shape for each cooler cycle. “Swell”-type cycles start at a lower temperature level than “dip”-type cycles and reach the temperature level of the “dip”-type cycle at the time of the “swell”. The duration of the “swell” is 2-3 h. The “dip” has a similar duration.
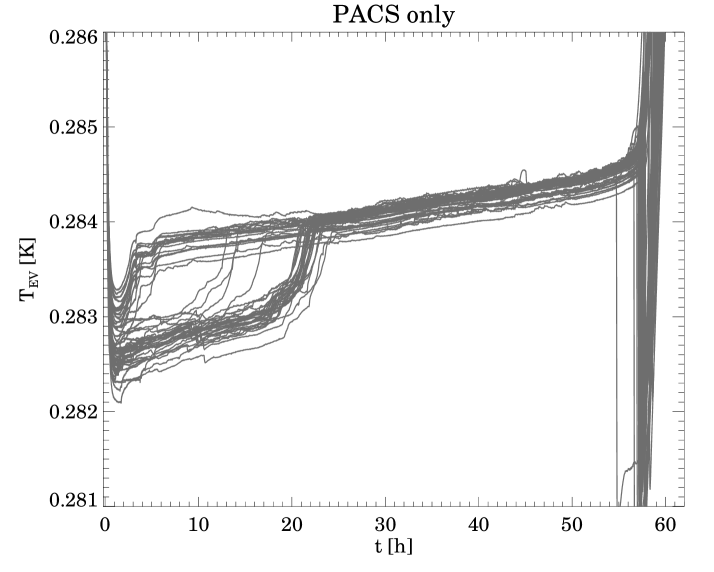
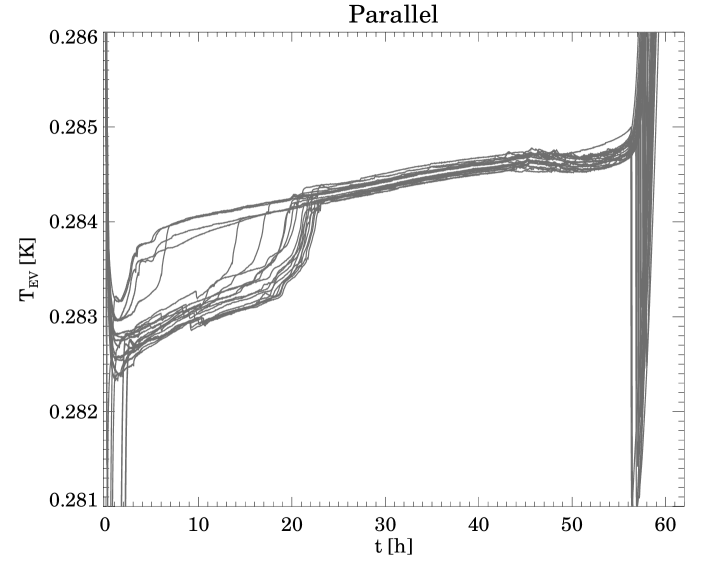
As a summary of the described characteristics of the evaporator temperature evolution, Fig. 7 shows a superposition of all cooler cycles with full hold time and without de-biasing in-between, separately for PACS-only and parallel mode cycles. This reveals fine differences for the two modes of operations. Parallel cycles show an on average slightly higher temperature level, which indicates some small impact by the parallel operations of the SPIRE instrument. This impact is confirmed by the temperature drop after about 48 h, when SPIRE operations terminate. Thanks to the photometric calibration method correcting for time dependent evaporator temperature variation (Refmoor13 ), all photometric measurements are put on a homogeneous temperature reference level.
The “dip-type” evaporator temperature curves look similar to the observed on-ground behavior. The “dip” appears therefore to be a consequence of the relative timing of the end of the cooler recycling procedure, when the evaporator temperature still drops, and the bias setting of the detectors as part of the orbit prologue procedure, which leads to the turn of the temperature curve to the level for biased detectors.
We have investigated whether the evaporator temperature “swell” is related to instrument or satellite specific activities. We could not find any strong correlation with instrument switching, long slews, in particular the concluding ones of an OD, or spacecraft operational windows for reaction wheel de-biasing. The physical reason behind the occurrence of the “swells” in the evaporator temperature remains therefore an open issue. We believe it to be a zero gravity effect, possibly related to the liquid arrangement inside the porous material, since it was never observed during tests of the cooler system on ground. Note that for the SPIRE cooler a similar phenomenon has been reported, which has been called the “SPIRE cooler burp”.
We also investigated the impact of the detector operations on the shape of the evaporator cooler temperature curve. This is illustrated in Fig. 8. Even with the brightest measurable sources on the detector, the illumination did not cause any noticeable deviations of the evaporator temperature. A noticeable effect could be recognized when the detectors were operated with different bias settings, but this was restricted to a few engineering and calibration observations only.
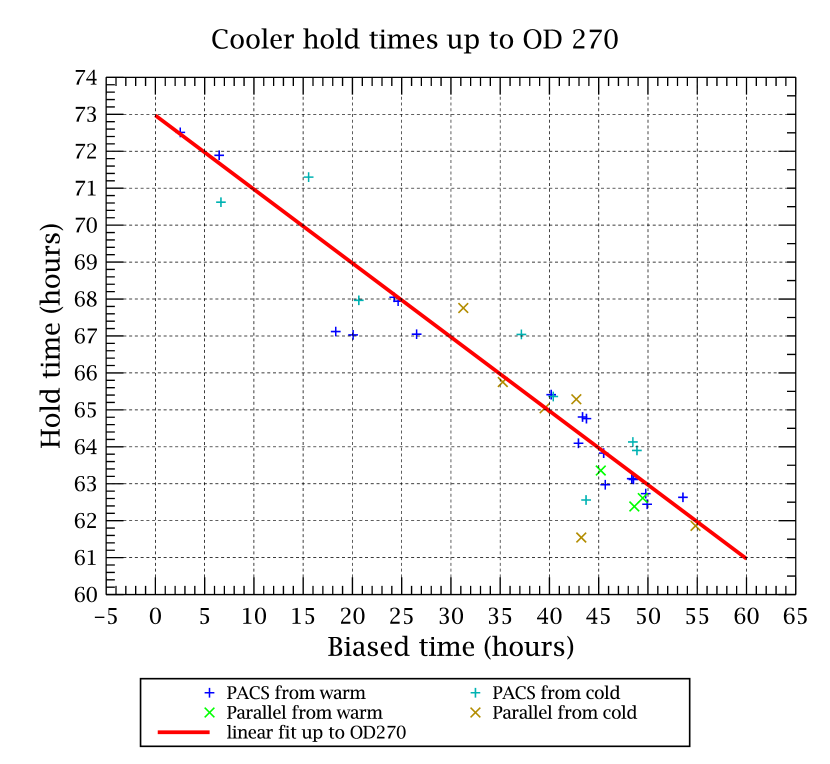
Fig. 9 shows the relation of the cooler hold time versus the biased time for all complete cooler cycles during the mission (192 out of 239, 115 out of 139 PACS only, 77 out of 100 parallel). Cooler periods flagged in Table 1 by a banner “t” in the column hold time were not considered, because of their truncation by the start of a new cooler recycling under cold start conditions before the final exhaustion of the liquid 3He.
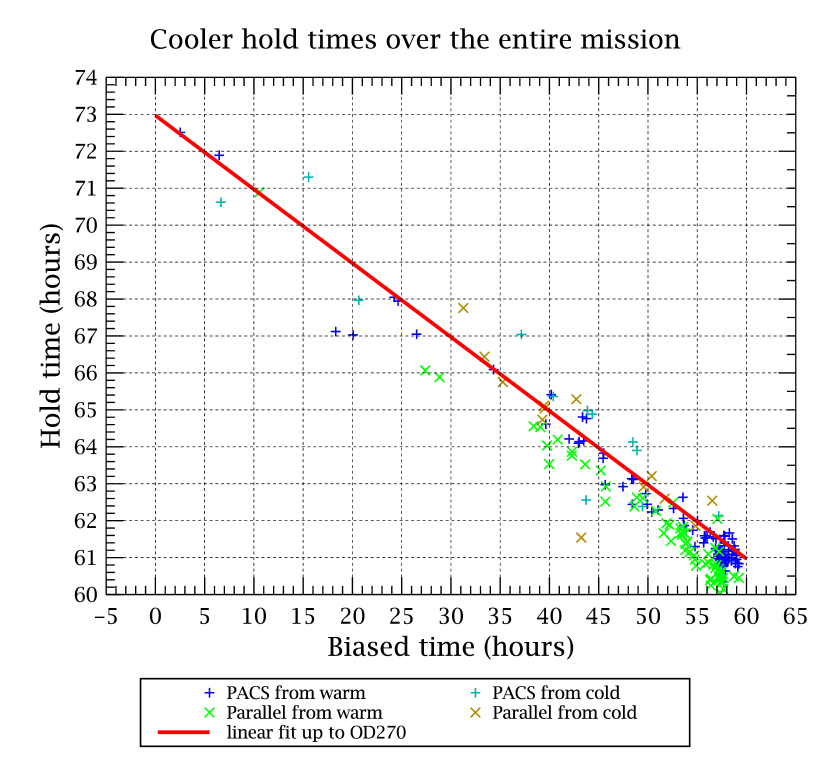
Plotting all complete hold times of the entire mission shows some fine differences between the different modes and start conditions. The PACS-only recyclings starting from a warm cooler cluster close to the relation established from all complete cooler periods up to OD 270 (cf. Sect. 4 and Fig. 4, as represented by the red line in Fig. 9 with a dispersion of 0.5 h. The parallel cooler recyclings starting from a warm cooler are slightly shifted to an about 1 h shorter cooler hold time with a similar dispersion. This one hour less efficiency was well covered by the buffer time applied for mission planning aspects as described in Sect. 4. Statistics for the cooler recyclings starting from a still cold cooler are poorer, but there is some indication that the hold times both for PACS-only and parallel cooler recycling are about 0.5 h longer than for the warm start PACS-only cooler recyclings.
There are a few outliers with hold times shorter by 1.5 to 3 h than comparable cycles which are restricted to one period between OD 101 and OD 132. Note that this period largely coincides with the period when the bias voltage settings of the PACS detectors were still being varied for detector performance optimization (prior to OD 128).
Formal linear fits like the one for the general hold time relation in Eqn(1)
yield
for all cycles:
| (3) |
for PACS-only cycles with warm start:
| (4) |
for PACS-only cycles with cold start:
| (5) |
for parallel cycles with warm start:
| (6) |
for parallel cycles with cold start:
| (7) |
Investigation of the cause for the dispersion in cooler hold time for the same biased time has to consider the following aspects:
-
1)
Short term variations of the thermal environment in the order of days.
-
2)
Systematic trends along the Herschel mission.
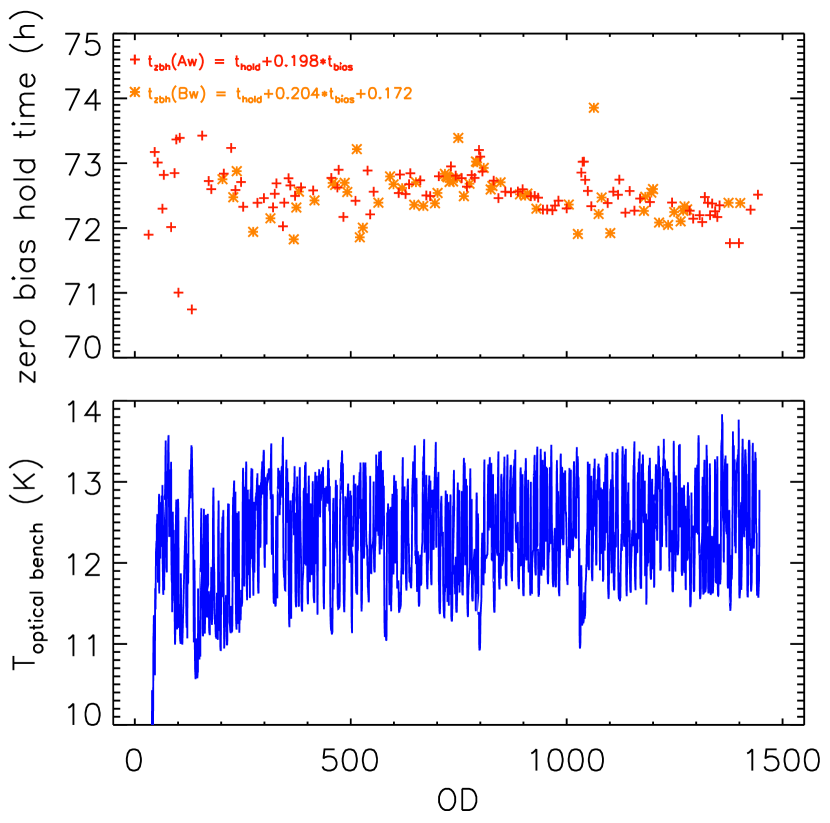
This investigation is illustrated in Fig. 10. For a homogeneous comparison of cooler cycles with very different biased times we calculate the zero bias hold time as
| (8) |
with being the factors in the relations of Eqns. (4) and (6), respectively. To account for the slightly different average hold times of PACS only and parallel mode recyclings, the difference of the offsets (72.523 h - 72.351 h = 0.172 h) has been added to of parallel cycles.
Fig. 10 features the following characteristics
-
1)
There is quite some dispersion up to about OD 200 including the mentioned outliers.
-
2)
From OD 200 onwards there are periods with quite low dispersion in interrupted by periods with higher scatter.
-
3)
There appears to be a slight downward trend of along the mission.
In trying to find correlations with instrument temperature sensing, the PACS instrument optical bench temperature (in the range 10 - 13 K) appears to reflect individual features and overall trends (cf. Fig.10). Note that this is an anti-correlation with low optical bench temperatures corresponding to long hold times and vice versa. It is not always a 1-to-1 anti-correlation in time, but the thermal history also has to be considered. The PACS optical bench temperature is a representation of the total thermal load into the PACS instrument. It depends on activities of all systems inside the cryostat. Switch-off of one of the three instruments, e.g. due to contingency mainly by cosmic ray hits, can cause a significant drop of the thermal load. The thermal load and environment can have an impact both on the recycling process and the evaporation level. We noted some slight systematic variations of the evaporator temperature curves during the recycling, like an increase of the peak temperature and the final 2 K level of the recycling, with proceeding mission.
6 Utilization of cooler recyclings to determine the lifetime of 4He in the Herschel cryostat
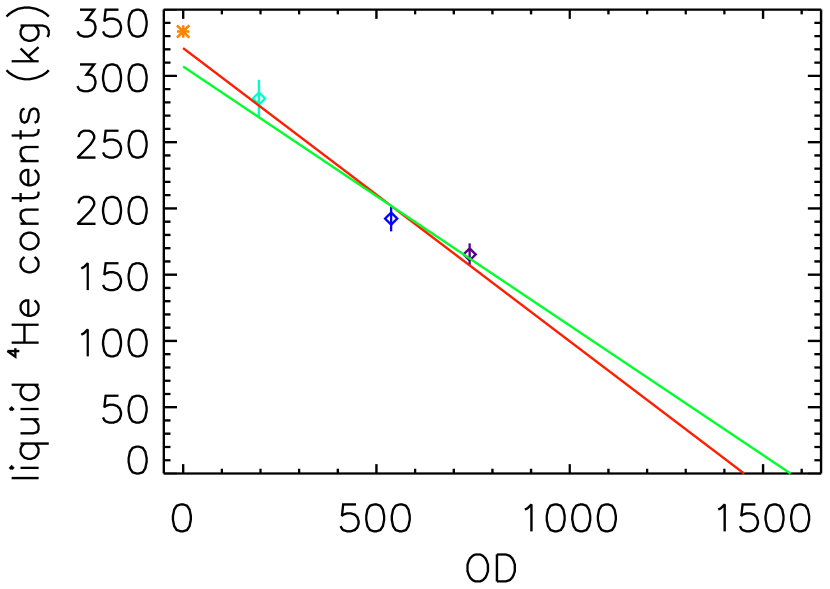
The lifetime of a cryogenic mission is usually determined by the consumption of the initial mass of coolant. In the case of Herschel this was the amount of superfluid 4He carried inside the instrument cryostat. For a realistic mission planning trying to execute the essential scientific program a feedback on the remaining lifetime is very helpful. For that reason the Herschel cryostat was equipped with special heaters to perform Direct Liquid Content Measurements (DLCM). Three measurements of this type were performed on ODs 196, 538 and 741 by sending a dedicated heat pulse into the superfluid 4He and watching its thermal reaction. This meant however each time the interruption of the scientific observations for several hours to achieve stable thermal conditions and the results did not show a smooth gradual reduction of the 4He mass content, leaving a relatively large uncertainty of about 4 months in lifetime, cf. Fig. 11.
The PACS team cryogenic experts developed an alternative method utilizing the regularly executed cooler recyclings of PACS and SPIRE. During the recyclings a well reproducible heat dissipation from the cooler pump into the superfluid 4He L0 bath of the Herschel cryostat took place. Fig. 12 (top) shows the corresponding measured temperature rise, which is the higher the less superfluid 4He remains. A smooth and well sampled trend was observed with this method.

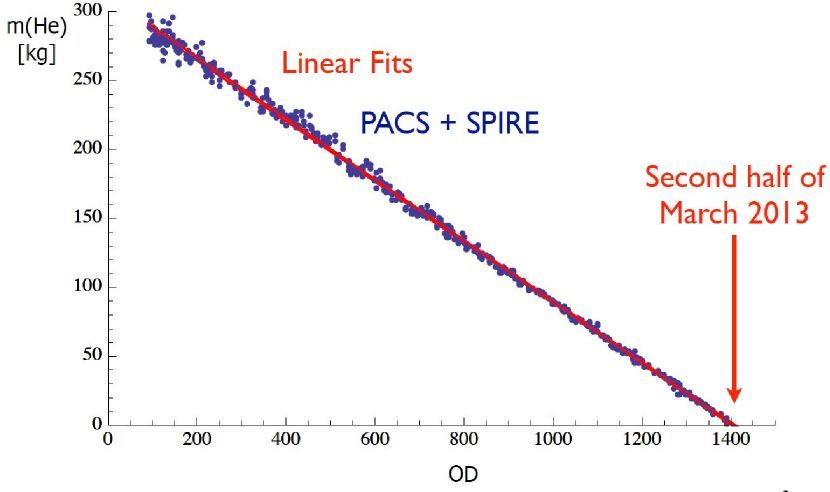
With the knowledge of the tank volume, the specific heat capacities of superfluid 4He and He gas in the ullage and the density of both phases, the remaining superfluid 4He mass can be determined. This is plotted in Fig. 12 (bottom) and led to a prediction for End of Life in the second half of March 2013. The actual superfluid 4He boil-off happened on 29 April 2013, i.e. the superfluid 4He lifetime turned out to be one month longer than predicted. This is owed to uncertainties in both the adopted physical properties, like e.g. the values of the specific heat capacities, and the start conditions, namely the initial superfluid 4He mass in the tank at launch.
7 The Slightly Non-nominal Cooler Recycling on OD 1440
The shape of the relevant cooler temperatures during the recycling as shown in Fig. 3 was highly reproducible during the whole Herschel mission until the last recycling on OD 1443, with one exception for the second-to-last recycling on OD 1440, 1 week before the boil-off of the liquid 4He in the large Herschel cryostat tank.
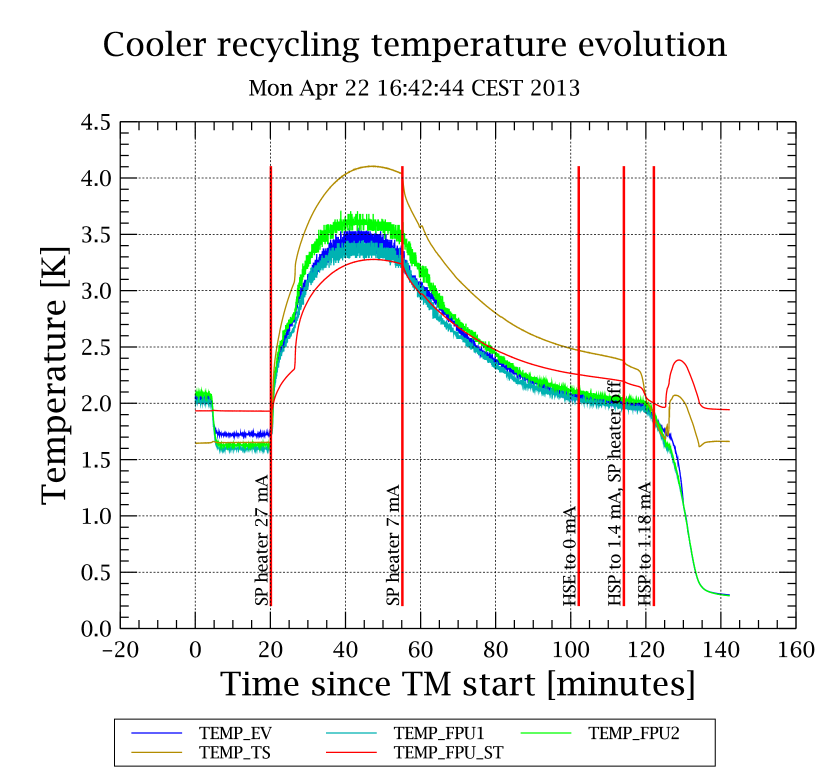
Fig. 13 shows the temperature evolution which can be compared with the one shown in Fig. 3. It can be noted that TEMP_EV exceeds 3.5 K during the heating of the pump and that the “knee” at around 117 min after thermally disconnecting the evaporator (HSE = 0) and closing the pump heater switch (HSP) is at 2 K and not below. As pointed out in Sect. 3, the finally achieved TEMP_EV in this step characterizes the efficiency of the recycling. This led to a 3.3 h shorter cooler hold time than anticipated (see Sect. 4 and Table 1). Due to a safety buffer of 3 h taken into account by the science mission planning only 0.3 h of PACS photometer observations were lost111The earlier increase of the evaporator temperature triggered an autonomy function and put PACS into safe mode leading to the failure of OBSIDs 1342270750 & 1342270751 planned to observe asteroid (2000) Herschel..
The likely explanation for this behavior is that the remaining liquid 4He film was broken or too thin so that the heat dissipation from the pump was not perfect. This is also reflected in the otherwise not observed bumps in TEMP_TS and TEMP_FPU_ST at about 128 min. This event was the only sign before the final boil-off, that the liquid 4He reserve was close to its end. The liquid 4He film recovered again for the next and final PACS cooler recycling on OD 1443.
8 Conclusion
-
1)
The PACS 3He sorption cooler exceeded the required cooler hold time of 46 h by at least 15 h depending on the operational time of the PACS bolometer detectors. The biased time of the detectors is the essential parameter for the resulting hold time. We did not observe any sign of aging effect of the device, despite more than 9 years of operations, almost 4 of them in space.
-
2)
An automatic cooler recycling procedure, assembling the necessary steps with the right timing, worked highly reproducible over the whole mission until the last cooler recycling 4 days before the liquid 4He boil-off in the Herschel cryostat. The only slightly non-nominal recycling with a 5% shorter hold time on OD 1440 can be explained by a disturbed thermal interface to the liquid 4He bath 1 week before the boil-off. In total, 139 automatic PACS cooler recyclings and 100 automatic parallel (with SPIRE) cooler recyclings were executed during the Herschel mission.
-
3)
The dependence of the cooler hold time on the detector operational time (biased detectors) was established early in the mission and worked reliably for the science mission planning process over the entire Herschel mission.
-
4)
We give a statistics of all PACS cooler recyclings over the full Herschel mission. From this fine differences in the performance of the different modes and start conditions can be seen. Parallel cooler recyclings starting with a warm cooler give an about 1 h shorter hold time than PACS-only recyclings. Cooler recyclings starting from a still cold cooler give an about 0.5 h longer hold time than the warm start PACS-only recycling.
-
5)
We characterize the cooler cycles into two main classes: (1) Dip-type cycles starting at a slightly higher level (1 mK in evaporator temperature) and, for the majority, (2) swell-type cycles starting at a slightly lower level and usually showing a temperature swell of 1 mK after around 24 h adjusting then to the level of the dip-type cycles. The physical reason for this “swell” is unclear, it appears to be a zero gravity effect. The “dip-type” shapes were also observed during ground tests of the device and seem to be the consequence of relative timing of evaporator temperature evolution and detector bias switching. We also noted a systematically slightly higher evaporator temperature level for parallel cooler cycles during the time interval of SPIRE operations. Illumination conditions of the detectors could be ruled out as negligible.
-
6)
We investigated the cause for the dispersion of cooler hold times of cycles with similar biased time, same mode and start condition, which is in the order of about 1 h. By determining a zero bias hold time, allowing a homogeneous comparison of all cycles, we have seen that the dispersion is caused by trends and different thermal loads into the PACS instrument along the Herschel mission. This was concluded from the fact that the PACS optical bench temperature sensor showed a quite good anti-correlation both with regard to long term trends and short term scatter. A few outliers with noticeable shorter hold times can be related to a confined period between OD 101 and OD 132 early in the mission, when larger temperature load variations occurred.
-
7)
The evolution of the cooler evaporator temperature during the individual cooler cycles was studied and the impact of the temperature variation on the bolometer response and hence the photometric accuracy during the biased times could be characterized very well and corrections improving the relative calibration accuracy were established as described in Refmoor13 .
-
8)
We sketch a method of 4He mass content determination evaluating the temperature response of the 4He coolant in the large Herschel cryostat to the constant heat deposition of the 3He sorption cooler pump at the end of the recycling process. This gave a much denser and hence robust against individual outliers coverage of the mass content curve for zero cost as an alternative to few dedicated Direct Liquid Content Measurements (DLCM) requiring the interrupt of the scientific operations. The accuracy of the method utilizing the anyhow performed cooler recyclings is solely limited by uncertainties in the adopted physical properties, like e.g. the values of the specific heat capacities, and the start conditions, namely the initial superfluid 4He mass in the tank at launch.
Acknowledgements.
PACS has been developed by a consortium of institutes led by MPE (Germany) and including UVIE (Austria); KUL Leuven, CSL, IMEC (Belgium); CEA, LAM (France); MPIA (Germany); INAF-IFSI/OAA/OAP/OAT, LENS, SISSA (Italy); IAC (Spain). This development and the operation of the PACS Instrument Control Centre, planning the calibration observations, analyzing and documenting the measurements and supporting the mission planning stray-light protection has been supported by the funding agencies BMVIT (Austria), ESA-PRODEX (Belgium), CEA/CNES (France), DLR (Germany), ASI/INAF (Italy), and CICYT/MCYT (Spain).References
- (1) Balog Z., et al., The Herschel-PACS photometer calibration. Point-source flux calibration for scan maps, Exp Astron, DOI 10.1007/s10686-013-9352-3 this volume (2013)
- (2) Billot, N. et al., CEA bolometer arrays: the first year in space, Proc. SPIE, Vol. 7741, article id. 774102, 11 pp. (2010)
- (3) Duband, L., et al., A thermal switch for use at liquid helium temperature in space-borne cryogenics systems, Proceedings of the 8th International Cryocooler Conference, 1995, Plenum Press, NY, p. 731-741
- (4) Duband L., et al., Herschel flight models sorption coolers, Cryogenics, 48, 95 (2008)
- (5) Griffin M.J. et al., The Herschel-SPIRE instrument and its in-flight performance, A&A, 518, L3 (2010)
- (6) Moór A. et al., PACS photometer calibration block analysis, Exp Astron, this volume (2013)
- (7) Nielbock M. et al., The Herschel PACS photometer calibration. A time dependent flux calibration for the PACS chopped point-source photometry AOT mode, Exp Astron, DOI 10.1007/s10686-013-9348-z this volume (2013)
- (8) Pilbratt G.L. et al., Herschel Space Observatory, A&A, 518, L1 (2010)
- (9) Poglitsch A. et al., The Photodetector Array Camera and Spectrometer (PACS) on the Herschel Space Observatory, A&A, 518, L2 (2010)
| # | OD | start cooler | end cooler | start | hold time | # bias | biased time | shape |
|---|---|---|---|---|---|---|---|---|
| recycling (UT) | recycling (UT) | cond. | (h) | periods | (h) | TEV | ||
| A001 | 26 | 2009-06-08T22:40:14 | 2009-06-09T01:02:36 | w | 23.8043t | 1 | 1.1781 | s |
| A002 | 27 | 2009-06-10T00:44:57 | 2009-06-10T03:07:19 | c | 70.6215 | 1 | 6.6511 | - |
| A003 | 31 | 2009-06-14T06:32:58 | 2009-06-14T08:55:20 | w | 67.7156 | 1 | 21.1211 | s |
| A004 | 38 | 2009-06-21T07:50:34 | 2009-06-21T10:12:56 | w | 34.9333t | 1 | 2.5333 | - |
| A005 | 40 | 2009-06-22T21:03:09 | 2009-06-22T23:25:31 | c | 71.2997 | 2 | 15.5522 | s |
| A006 | 46 | 2009-06-28T17:33:17 | 2009-06-28T19:55:39 | w | 71.8910 | 1 | 6.4761 | s |
| A007 | 53 | 2009-07-06T02:56:06 | 2009-07-06T05:18:28 | w | 72.5103 | 1 | 2.5250 | d |
| A008 | 64 | 2009-07-16T14:47:08 | 2009-07-16T17:09:30 | w | 67.0481 | 2 | 26.5164 | s |
| A009 | 67 | 2009-07-19T14:46:13 | 2009-07-19T17:08:35 | w | 67.9420 | 1 | 24.6364 | s |
| A010a | 72 | 2009-07-24T14:43:23 | 2009-07-24T17:05:45 | w | - | 2 | 38.4600 | s |
| A011 | 84 | 2009-08-05T14:52:20 | 2009-08-05T17:14:42 | w | 62.9721 | 3 | 45.6658 | s |
| A012 | 92 | 2009-08-13T20:21:42 | 2009-08-13T22:44:04 | w | 68.0481 | 3 | 24.2375 | s |
| A013 | 96 | 2009-08-17T15:15:43 | 2009-08-17T17:38:05 | w | 65.4114 | 2 | 40.1767 | s |
| A014 | 101 | 2009-08-22T13:27:38 | 2009-08-22T15:50:00 | w | 67.0301 | 1 | 20.0683 | 2s |
| A015 | 104 | 2009-08-25T13:35:37 | 2009-08-25T15:57:59 | w | 64.8066 | 2 | 43.3583 | d |
| A016 | 107 | 2009-08-28T13:44:13 | 2009-08-28T16:06:35 | w | 45.8214t | 2 | 41.4394 | s |
| A017 | 109 | 2009-08-30T13:50:13 | 2009-08-30T16:12:35 | c | 42.6895t | 2 | 37.7328 | s |
| B001 | 111 | 2009-09-01T10:19:08 | 2009-09-01T13:11:40 | c | 61.5438 | 2 | 43.2303 | s |
| A018 | 118 | 2009-09-08T23:53:36 | 2009-09-09T02:15:58 | w | 58.1821t | 2 | 34.0006 | s |
| A019 | 120 | 2009-09-11T12:21:16 | 2009-09-11T14:43:38 | c | 72.7466 | 1 | 5.2692 | s |
| A020 | 124 | 2009-09-14T23:42:21 | 2009-09-15T02:04:43 | w | 60.7143t | 2 | 43.5650 | s |
| A021 | 127 | 2009-09-17T14:42:05 | 2009-09-17T17:04:27 | c | 62.5602 | 2 | 43.7186 | s |
| A022 | 132 | 2009-09-23T01:45:58 | 2009-09-23T04:08:20 | w | 67.1199 | 1 | 18.3050 | d |
| B002 | 136 | 2009-09-26T23:12:08 | 2009-09-27T02:04:40 | w | 45.1275t | 2 | 37.5689 | d |
a PACS switch-off during Onboard Software Upload in DTCP-74, no TM received
| # | OD | start cooler | end cooler | start | hold time | # bias | biased time | shape |
|---|---|---|---|---|---|---|---|---|
| recycling (UT) | recycling (UT) | cond. | (h) | periods | (h) | TEV | ||
| A023 | 138 | 2009-09-28T23:06:36 | 2009-09-29T01:28:58 | c | 65.3623 | 2 | 40.3878 | d |
| A024 | 146 | 2009-10-06T22:43:56 | 2009-10-07T01:06:18 | w | 45.6248t | 1 | 20.6497 | d |
| A025 | 148 | 2009-10-08T22:38:06 | 2009-10-09T01:00:28 | c | 45.6031t | 2 | 37.1192 | s |
| A026 | 150 | 2009-10-10T22:32:08 | 2009-10-11T00:54:30 | c | 67.0422 | 2 | 37.1500 | d |
| A027 | 156 | 2009-10-16T22:13:22 | 2009-10-17T00:35:44 | w | 64.7625 | 2 | 43.7536 | d |
| A028 | 159 | 2009-10-19T22:03:37 | 2009-10-20T00:25:59 | w | 21.6661t | 1 | 15.0633 | d |
| A029 | 160 | 2009-10-20T22:00:21 | 2009-10-21T00:22:43 | c | 46.0562t | 2 | 33.8381 | s |
| B003 | 162 | 2009-10-22T21:53:52 | 2009-10-23T00:46:24 | c | 45.0942t | 4 | 40.4399 | s |
| A030 | 164 | 2009-10-24T21:47:26 | 2009-10-25T00:09:48 | c | 67.9650 | 2 | 20.6369 | 2s |
| A031 | 171 | 2009-10-31T21:25:59 | 2009-10-31T23:48:21 | w | 63.1170 | 3 | 48.5269 | s |
| A032 | 177 | 2009-11-06T21:08:55 | 2009-11-06T23:31:17 | w | 64.0964 | 3 | 42.9447 | 2s |
| A033 | 184 | 2009-11-13T20:49:39 | 2009-11-13T23:12:01 | w | 45.6627t | 2 | 35.5911 | d |
| A034 | 186 | 2009-11-15T20:46:04 | 2009-11-15T23:08:26 | c | 46.5388t | 2 | 40.0861 | d |
| A035 | 188 | 2009-11-17T21:36:12 | 2009-11-17T23:58:34 | c | 44.8176t | 1 | 19.9575 | s |
| A036 | 190 | 2009-11-19T20:42:49 | 2009-11-19T23:05:11 | c | 46.1684t | 2 | 33.3992 | 2s |
| B004 | 192 | 2009-11-21T20:41:22 | 2009-11-21T23:33:54 | c | 65.7532 | 2 | 35.2633 | s |
| A037 | 197 | 2009-11-26T20:38:22 | 2009-11-26T23:00:44 | w | 46.2087t | 2 | 41.7544 | s |
| B005 | 199 | 2009-11-28T20:37:28 | 2009-11-28T23:30:00 | c | 67.7568 | 2 | 31.2525 | d |
| B006 | 203 | 2009-12-02T20:36:11 | 2009-12-02T23:28:43 | w | 63.3581 | 3 | 45.2086 | s |
| A038 | 206 | 2009-12-05T20:35:46 | 2009-12-05T22:58:08 | w | 63.8295 | 3 | 45.5047 | s |
| A039 | 212 | 2009-12-11T17:42:52 | 2009-12-11T20:05:14 | w | 45.8827t | 2 | 42.0986 | s |
| B007 | 214 | 2009-12-13T17:22:18 | 2009-12-13T20:14:50 | c | 65.2871 | 2 | 42.7278 | s |
| A040 | 218 | 2009-12-17T17:24:38 | 2009-12-17T19:47:00 | w | 45.7505t | 2 | 39.1311 | s |
| A041 | 220 | 2009-12-19T17:26:16 | 2009-12-19T19:48:38 | c | 64.1315 | 3 | 48.4658 | d |
| A042 | 223 | 2009-12-22T17:21:24 | 2009-12-22T19:43:46 | w | 62.6322 | 3 | 53.5508 | d |
| B008 | 228 | 2009-12-27T17:35:37 | 2009-12-27T20:28:09 | w | 62.3849 | 3 | 48.6158 | s |
| A043 | 233 | 2010-01-01T17:49:03 | 2010-01-01T20:11:25 | w | 62.7316 | 3 | 49.7739 | s |
| B009 | 236 | 2010-01-04T17:49:32 | 2010-01-04T20:42:04 | w | 62.6127 | 3 | 49.4731 | s |
| B010 | 239 | 2010-01-07T17:55:47 | 2010-01-07T20:48:19 | w | 45.2951t | 2 | 31.5111 | s |
| A044 | 241 | 2010-01-09T18:00:14 | 2010-01-09T20:22:36 | c | 48.1649t | 2 | 39.6519 | s |
| A045 | 243 | 2010-01-11T20:27:54 | 2010-01-11T22:50:16 | c | 63.9023 | 3 | 48.8775 | d |
| # | OD | start cooler | end cooler | start | hold time | # bias | biased time | shape |
|---|---|---|---|---|---|---|---|---|
| recycling (UT) | recycling (UT) | cond. | (h) | periods | (h) | TEV | ||
| A046 | 246 | 2010-01-14T20:35:12 | 2010-01-14T22:57:34 | w | 63.1364 | 3 | 48.3519 | s |
| A047 | 251 | 2010-01-19T18:25:06 | 2010-01-19T20:47:28 | w | 62.4450 | 3 | 49.9144 | d |
| B011 | 256 | 2010-01-24T18:38:36 | 2010-01-24T21:31:08 | w | 45.4533t | 2 | 38.9014 | s |
| A048 | 258 | 2010-01-26T18:52:33 | 2010-01-26T21:14:55 | c | 46.1565t | 2 | 42.9736 | d |
| B012 | 260 | 2010-01-28T18:49:38 | 2010-01-28T21:42:10 | c | 65.0416 | 3 | 39.5114 | d |
| B013 | 268 | 2010-02-05T19:11:52 | 2010-02-05T22:04:24 | w | 45.8134t | 2 | 34.1367 | d |
| B014 | 270 | 2010-02-07T19:17:24 | 2010-02-07T22:09:56 | c | 61.8602 | 3 | 54.8289 | s |
| B015 | 274 | 2010-02-11T20:35:08 | 2010-02-11T23:27:40 | w | 65.8847 | 2 | 28.8431 | s |
| A049 | 284 | 2010-02-21T18:39:57 | 2010-02-21T21:02:19 | w | 61.7253 | 3 | 53.8569 | s |
| A050 | 299 | 2010-03-08T22:40:03 | 2010-03-09T01:02:25 | w | 64.6146 | 2 | 39.6306 | s |
| B016 | 314 | 2010-03-23T21:14:03 | 2010-03-24T00:06:35 | w | 60.7813 | 3 | 54.8858 | s |
| A051 | 320 | 2010-03-29T23:52:03 | 2010-03-30T02:14:25 | w | 62.9215 | 3 | 47.4594 | d |
| A052 | 324 | 2010-04-02T21:12:41 | 2010-04-02T23:35:03 | w | 64.2123 | 2 | 41.9975 | s |
| A053 | 328 | 2010-04-06T22:01:36 | 2010-04-07T00:23:58 | w | 63.6904 | 3 | 45.4486 | s |
| A054 | 343 | 2010-04-21T23:25:43 | 2010-04-22T01:48:05 | w | 62.4411 | 3 | 48.4106 | d |
| A055 | 346 | 2010-04-24T20:21:49 | 2010-04-24T22:44:11 | w | 62.2905 | 3 | 51.0150 | d |
| B017 | 349 | 2010-04-27T20:38:59 | 2010-04-27T23:31:31 | w | 45.6088t | 2 | 37.0225 | s |
| B018 | 351 | 2010-04-29T20:32:05 | 2010-04-29T23:24:37 | c | 45.3056t | 2 | 37.2692 | d |
| B019 | 353 | 2010-05-01T20:08:18 | 2010-05-01T23:00:50 | c | 65.1113 | 3 | 39.4364 | s |
| A056 | 356 | 2010-05-04T20:15:04 | 2010-05-04T22:37:26 | w | 64.1593 | 2 | 43.4786 | s |
| A057 | 360 | 2010-05-08T19:55:45 | 2010-05-08T22:18:07 | w | 64.1401 | 2 | 43.0119 | d |
| B020 | 368 | 2010-05-16T19:42:22 | 2010-05-16T22:34:54 | w | 66.0664 | 2 | 27.3881 | s |
| A058 | 371 | 2010-05-19T19:37:37 | 2010-05-19T21:59:59 | w | 61.8683 | 3 | 53.6761 | s |
| B021 | 374 | 2010-05-22T19:32:55 | 2010-05-22T22:25:27 | w | 64.0344 | 3 | 39.7544 | s |
| B022 | 380 | 2010-05-28T18:56:03 | 2010-05-28T21:48:35 | w | 64.5570 | 2 | 38.3961 | s |
| A059 | 385 | 2010-06-02T18:40:01 | 2010-06-02T21:02:23 | w | 61.5922 | 3 | 55.7314 | s |
| B023 | 392 | 2010-06-09T14:47:42 | 2010-06-09T17:40:14 | w | 47.7938t | 2 | 28.9322 | s |
| B024 | 394 | 2010-06-11T16:52:03 | 2010-06-11T19:44:35 | c | 64.7317 | 3 | 39.2725 | s |
| A060 | 399 | 2010-06-16T15:59:20 | 2010-06-16T18:21:42 | w | 46.1451t | 2 | 43.7475 | d |
| B025 | 401 | 2010-06-18T15:54:41 | 2010-06-18T18:47:13 | c | 45.1666t | 2 | 36.1786 | s |
| B026 | 403 | 2010-06-20T15:22:12 | 2010-06-20T18:14:44 | c | 66.4402 | 3 | 33.4058 | s |
| # | OD | start cooler | end cooler | start | hold time | # bias | biased time | shape |
|---|---|---|---|---|---|---|---|---|
| recycling (UT) | recycling (UT) | cond. | (h) | periods | (h) | TEV | ||
| A061 | 413 | 2010-06-30T15:26:53 | 2010-06-30T17:49:15 | w | 61.5300 | 3 | 55.8081 | s |
| B027 | 416 | 2010-07-03T15:19:57 | 2010-07-03T18:12:29 | w | 62.9263 | 3 | 45.7253 | s |
| B028b | 420 | 2010-07-07T15:10:42 | 2010-07-07T18:03:14 | w | - | 2 | 37.7656 | s |
| B029 | 434 | 2010-07-21T14:38:18 | 2010-07-21T17:30:50 | w | 45.1509t | 2 | 33.6669 | s |
| A062 | 436 | 2010-07-23T14:33:39 | 2010-07-23T16:56:01 | c | 64.8827 | 2 | 44.3497 | d |
| B030 | 446 | 2010-08-02T14:31:16 | 2010-08-02T17:23:48 | w | 45.6873t | 2 | 39.2767 | s |
| B031 | 448 | 2010-08-04T14:29:07 | 2010-08-04T17:21:39 | c | 45.6707t | 2 | 40.9700 | s |
| B032 | 450 | 2010-08-06T14:26:58 | 2010-08-06T17:19:30 | c | 45.2300t | 2 | 35.7411 | s |
| A063 | 452 | 2010-08-08T14:28:27 | 2010-08-08T16:50:49 | c | 62.1286 | 3 | 57.1875 | s |
| A064 | 455 | 2010-08-11T14:21:44 | 2010-08-11T16:44:06 | w | 61.5068 | 3 | 56.8969 | s |
| B033 | 458 | 2010-08-14T14:18:39 | 2010-08-14T17:11:11 | w | 61.6184 | 3 | 53.4636 | d |
| B034 | 464 | 2010-08-20T14:12:37 | 2010-08-20T17:05:09 | w | 63.8651 | 2 | 42.2944 | s |
| A065 | 469 | 2010-08-25T14:07:46 | 2010-08-25T16:30:08 | w | 61.5374 | 3 | 55.9964 | d |
| A066 | 472 | 2010-08-28T14:04:54 | 2010-08-28T16:27:16 | w | 62.0021 | 3 | 55.0281 | s |
| B035 | 478 | 2010-09-03T17:29:21 | 2010-09-03T20:21:53 | w | 45.6931t | 2 | 40.5706 | s |
| B036 | 480 | 2010-09-05T17:27:34 | 2010-09-05T20:20:06 | c | 63.5363 | 2 | 41.9306 | d |
| A067 | 483 | 2010-09-08T17:25:43 | 2010-09-08T19:48:05 | w | 62.3834 | 3 | 49.4347 | s |
| B037 | 486 | 2010-09-11T17:38:46 | 2010-09-11T20:31:18 | w | 64.1949 | 2 | 40.8369 | s |
| B038 | 492 | 2010-09-17T17:34:33 | 2010-09-17T20:27:05 | w | 63.7611 | 2 | 42.2675 | s |
| B039 | 497 | 2010-09-22T17:29:04 | 2010-09-22T20:01:36 | w | 45.6872t | 2 | 43.4728 | s |
| B040 | 499 | 2010-09-24T17:26:55 | 2010-09-24T20:19:27 | c | 44.9416t | 2 | 38.9772 | s |
| A068 | 501 | 2010-09-26T17:11:04 | 2010-09-26T19:33:26 | c | 64.9817 | 2 | 43.8539 | d |
| A069 | 511 | 2010-10-06T17:03:52 | 2010-10-06T19:26:14 | w | 61.4005 | 3 | 55.6553 | s |
| B041 | 514 | 2010-10-09T17:17:08 | 2010-10-09T20:09:40 | w | 70.8895 | 1 | 10.5675 | s |
| B042 | 521 | 2010-10-16T16:57:42 | 2010-10-16T19:50:14 | w | 63.5320 | 2 | 39.9642 | s |
| B043 | 528 | 2010-10-23T16:53:24 | 2010-10-23T19:45:56 | w | 62.5161 | 3 | 45.6708 | s |
| A070 | 539 | 2010-11-03T16:12:19 | 2010-11-03T18:34:41 | w | 66.0888 | 2 | 34.3353 | s |
| A071 | 545 | 2010-11-09T16:13:54 | 2010-11-09T18:36:16 | w | 62.2343 | 3 | 50.3853 | s |
| A072 | 553 | 2010-11-17T16:05:23 | 2010-11-17T18:27:45 | w | 61.1577 | 3 | 57.5881 | s |
| B044 | 564 | 2010-11-28T16:07:55 | 2010-11-28T19:00:27 | w | 61.1509 | 3 | 54.2536 | s |
b TM loss from OD 422 to OD 424
| # | OD | start cooler | end cooler | start | hold time | # bias | biased time | shape |
|---|---|---|---|---|---|---|---|---|
| recycling (UT) | recycling (UT) | cond. | (h) | periods | (h) | TEV | ||
| B045 | 573 | 2010-12-07T12:53:27 | 2010-12-07T15:45:59 | w | 45.4319t | 2 | 40.8656 | s |
| B046 | 575 | 2010-12-09T12:35:57 | 2010-12-09T15:28:29 | c | 45.5978t | 2 | 41.8775 | d |
| B047 | 577 | 2010-12-11T12:29:33 | 2010-12-11T15:22:05 | c | 63.2060 | 3 | 50.3769 | d |
| A073 | 581 | 2010-12-15T12:13:43 | 2010-12-15T14:36:05 | w | 46.4597t | 2 | 44.6547 | d |
| B048 | 583 | 2010-12-17T12:27:57 | 2010-12-17T15:20:29 | c | 45.7077t | 2 | 43.1344 | d |
| B049 | 585 | 2010-12-19T12:28:04 | 2010-12-19T15:20:36 | c | 45.4999t | 2 | 40.1469 | s |
| B050 | 587 | 2010-12-21T12:15:46 | 2010-12-21T15:08:18 | c | 62.5957 | 3 | 51.6947 | d |
| B051 | 591 | 2010-12-25T12:24:44 | 2010-12-25T15:17:16 | w | 61.6580 | 3 | 53.7583 | s |
| B052 | 599 | 2011-01-02T12:02:37 | 2011-01-02T14:55:09 | w | 64.5291 | 2 | 39.0817 | s |
| B053 | 603 | 2011-01-06T10:44:26 | 2011-01-06T13:36:58 | w | 45.6712t | 2 | 39.1711 | d |
| B054 | 605 | 2011-01-08T10:41:29 | 2011-01-08T13:34:01 | c | 62.9152 | 3 | 49.5681 | s |
| A074 | 611 | 2011-01-14T10:18:37 | 2011-01-14T12:40:59 | w | 61.7411 | 3 | 54.5383 | s |
| A075 | 614 | 2011-01-17T10:13:08 | 2011-01-17T12:35:30 | w | 61.3934 | 3 | 57.7394 | s |
| B055 | 619 | 2011-01-22T10:23:46 | 2011-01-22T13:16:18 | w | 61.4251 | 3 | 54.0169 | s |
| A076 | 627 | 2011-01-30T10:07:57 | 2011-01-30T12:30:19 | w | 60.9945 | 3 | 58.2303 | s |
| A077 | 635 | 2011-02-07T10:13:29 | 2011-02-07T12:35:51 | w | 62.0622 | 3 | 53.6019 | d |
| A078 | 638 | 2011-02-10T10:15:34 | 2011-02-10T12:37:56 | w | 61.6956 | 3 | 56.3108 | d |
| B056 | 647 | 2011-02-19T10:52:43 | 2011-02-19T13:45:15 | w | 61.6607 | 3 | 51.5978 | d |
| B057 | 651 | 2011-02-23T10:55:22 | 2011-02-23T13:47:54 | w | 61.8892 | 3 | 52.1847 | s |
| A079 | 661 | 2011-03-05T14:19:59 | 2011-03-05T16:42:21 | w | 61.2173 | 3 | 58.1769 | s |
| B058 | 668 | 2011-03-12T23:39:24 | 2011-03-13T02:31:56 | w | 61.1985 | 2 | 53.7753 | s |
| A080 | 675 | 2011-03-19T23:38:21 | 2011-03-20T02:00:43 | w | 61.2452 | 2 | 56.8564 | s |
| A081 | 684 | 2011-03-28T23:49:19 | 2011-03-29T02:11:41 | w | 60.8365 | 2 | 58.8703 | d |
| B059 | 695 | 2011-04-08T21:46:31 | 2011-04-09T00:39:03 | w | 61.0576 | 2 | 54.6689 | s |
| B060 | 701 | 2011-04-15T00:00:09 | 2011-04-15T02:52:41 | w | 61.3918 | 2 | 53.8089 | s |
| A082 | 704 | 2011-04-17T21:22:42 | 2011-04-17T23:45:04 | w | 61.2057 | 2 | 58.5483 | d |
| B061 | 712 | 2011-04-25T23:45:43 | 2011-04-26T02:38:15 | w | 45.7131t | 2 | 40.2983 | s |
| B062 | 714 | 2011-04-27T23:45:06 | 2011-04-28T02:37:38 | c | 62.5411 | 2 | 56.5261 | d |
| B063 | 718 | 2011-05-01T21:02:38 | 2011-05-01T23:55:10 | w | 61.7916 | 3 | 53.2950 | s |
| B064 | 721 | 2011-05-04T23:48:13 | 2011-05-05T02:40:45 | w | 62.2669 | 3 | 50.8091 | s |
| B065 | 724 | 2011-05-07T23:31:35 | 2011-05-08T02:24:07 | w | 61.6951 | 2 | 53.5144 | s |
| # | OD | start cooler | end cooler | start | hold time | # bias | biased time | shape |
|---|---|---|---|---|---|---|---|---|
| recycling (UT) | recycling (UT) | cond. | (h) | periods | (h) | TEV | ||
| B066 | 729 | 2011-05-12T23:21:24 | 2011-05-13T02:13:56 | w | 61.6653 | 2 | 53.3042 | d |
| A083 | 732 | 2011-05-15T23:02:01 | 2011-05-16T01:24:23 | w | 61.3188 | 2 | 58.7514 | d |
| B067 | 737 | 2011-05-20T23:09:35 | 2011-05-21T02:02:07 | w | 61.0989 | 2 | 56.1139 | s |
| A084 | 743 | 2011-05-26T22:46:20 | 2011-05-27T01:08:42 | w | 61.1842 | 1 | 58.7111 | s |
| B068 | 746 | 2011-05-29T22:56:30 | 2011-05-30T01:49:02 | w | 62.6281 | 3 | 48.8675 | s |
| B069 | 749 | 2011-06-01T22:51:35 | 2011-06-02T01:44:07 | w | 62.4941 | 2 | 52.5683 | s |
| A085 | 757 | 2011-06-09T18:44:50 | 2011-06-09T21:07:12 | w | 61.1722 | 1 | 58.5747 | s |
| B070 | 762 | 2011-06-14T18:48:21 | 2011-06-14T21:40:53 | w | 60.8709 | 2 | 56.1197 | s |
| A086 | 769 | 2011-06-21T16:08:36 | 2011-06-21T18:30:58 | w | 60.9551 | 1 | 59.0025 | s |
| B071 | 775 | 2011-06-27T15:49:27 | 2011-06-27T18:41:59 | w | 61.9294 | 2 | 51.8719 | s |
| A087 | 780 | 2011-07-02T15:14:52 | 2011-07-02T17:37:14 | w | 61.1763 | 1 | 58.7919 | d |
| A088 | 787 | 2011-07-09T14:47:12 | 2011-07-09T17:09:34 | w | 61.5607 | 1 | 56.6278 | d |
| B072 | 790 | 2011-07-12T14:49:47 | 2011-07-12T17:42:19 | w | 61.2617 | 2 | 56.8269 | s |
| B073 | 793 | 2011-07-15T14:42:02 | 2011-07-15T17:34:34 | w | 61.1677 | 2 | 57.2194 | s |
| A089 | 797 | 2011-07-19T14:08:37 | 2011-07-19T16:30:59 | w | 61.6677 | 1 | 58.2642 | s |
| A090 | 800 | 2011-07-22T13:59:03 | 2011-07-22T16:21:25 | w | 61.5059 | 1 | 58.5600 | d |
| A091 | 805 | 2011-07-27T13:19:42 | 2011-07-27T15:42:04 | w | 61.2231 | 1 | 58.8314 | d |
| B074 | 808 | 2011-07-30T13:02:55 | 2011-07-30T15:55:27 | w | 61.8302 | 2 | 53.5567 | s |
| B075 | 824 | 2011-08-15T12:03:04 | 2011-08-15T14:55:36 | w | 63.5238 | 1 | 43.6217 | 2s |
| B076 | 828 | 2011-08-19T12:02:32 | 2011-08-19T14:55:04 | w | 60.4957 | 1 | 58.7331 | s |
| A092 | 831 | 2011-08-22T11:19:42 | 2011-08-22T13:42:04 | w | 61.0556 | 1 | 58.9658 | s |
| A093 | 842 | 2011-09-02T14:44:53 | 2011-09-02T17:07:15 | w | 60.7562 | 1 | 59.1175 | d |
| B077 | 847 | 2011-09-07T15:46:55 | 2011-09-07T18:39:27 | w | 60.4520 | 1 | 59.2228 | d |
| A094 | 858 | 2011-09-18T14:53:57 | 2011-09-18T17:16:19 | w | 60.9849 | 1 | 58.4603 | s |
| A095 | 871 | 2011-10-01T15:03:46 | 2011-10-01T17:26:08 | w | 60.8517 | 1 | 59.0897 | s |
| A096 | 887 | 2011-10-17T15:07:36 | 2011-10-17T17:29:58 | w | 60.8347 | 1 | 59.2342 | s |
| B078 | 892 | 2011-10-22T15:19:04 | 2011-10-22T18:11:36 | w | 61.3681 | 2 | 53.8206 | d |
| A097 | 898 | 2011-10-28T15:04:17 | 2011-10-28T17:26:39 | w | 61.0836 | 1 | 58.1575 | s |
| B079 | 904 | 2011-11-03T15:16:11 | 2011-11-03T18:08:43 | w | 60.6198 | 1 | 57.3950 | s |
| B080 | 909 | 2011-11-08T15:54:23 | 2011-11-08T18:46:55 | w | 60.8049 | 2 | 56.6389 | s |
| A098 | 917 | 2011-11-16T15:01:17 | 2011-11-16T17:23:39 | w | 60.9123 | 1 | 58.4747 | d |
| # | OD | start cooler | end cooler | start | hold time | # bias | biased time | shape |
|---|---|---|---|---|---|---|---|---|
| recycling (UT) | recycling (UT) | cond. | (h) | periods | (h) | TEV | ||
| A099 | 926 | 2011-11-25T14:56:04 | 2011-11-25T17:18:26 | w | 60.9715 | 1 | 58.2014 | s |
| B081 | 930 | 2011-11-29T15:07:46 | 2011-11-29T18:00:18 | w | 61.4486 | 2 | 52.3406 | d |
| A100 | 934 | 2011-12-03T12:12:53 | 2011-12-03T14:35:15 | w | 61.1944 | 1 | 56.9378 | d |
| A101 | 945 | 2011-12-14T13:02:29 | 2011-12-14T15:24:51 | w | 60.8858 | 1 | 57.5639 | s |
| A102 | 955 | 2011-12-24T11:41:56 | 2011-12-24T14:04:18 | w | 60.9793 | 1 | 57.1031 | s |
| A103 | 967 | 2012-01-05T10:44:52 | 2012-01-05T13:07:14 | w | 60.8817 | 1 | 57.5353 | s |
| A104 | 973 | 2012-01-11T11:41:17 | 2012-01-11T14:03:39 | w | 61.0380 | 1 | 57.1114 | s |
| A105 | 981 | 2012-01-19T10:07:13 | 2012-01-19T12:29:35 | w | 61.0445 | 1 | 57.4642 | s |
| A106 | 1000 | 2012-02-07T10:36:17 | 2012-02-07T12:58:39 | w | 60.9549 | 1 | 57.3111 | s |
| B082 | 1005 | 2012-02-12T10:51:58 | 2012-02-12T13:44:30 | w | 60.4919 | 1 | 57.3442 | s |
| B083 | 1026 | 2012-03-04T13:41:39 | 2012-03-04T16:34:11 | w | 60.0322 | 1 | 57.3728 | s |
| A107 | 1034 | 2012-03-13T01:13:32 | 2012-03-13T03:35:54 | w | 61.4201 | 1 | 57.7531 | s |
| A108 | 1037 | 2012-03-15T23:22:28 | 2012-03-16T01:44:50 | w | 61.5980 | 1 | 57.6972 | d |
| A109 | 1040 | 2012-03-19T00:47:49 | 2012-03-19T03:10:11 | w | 61.5788 | 1 | 57.8047 | s |
| A110 | 1043 | 2012-03-22T00:13:45 | 2012-03-22T02:36:07 | w | 62.3290 | 3c | 52.5992 | d |
| A111 | 1049 | 2012-03-27T21:36:34 | 2012-03-27T23:58:56 | w | 61.2187 | 1 | 57.3392 | s |
| A112 | 1057 | 2012-04-04T21:36:15 | 2012-04-04T23:58:37 | w | 60.9807 | 1 | 57.3567 | s |
| B084 | 1063 | 2012-04-10T21:25:05 | 2012-04-11T00:17:37 | w | 62.0468 | 1 | 57.0419 | s |
| B085 | 1074 | 2012-04-21T21:10:53 | 2012-04-22T00:03:25 | w | 60.3257 | 1 | 57.4464 | s |
| B086 | 1081 | 2012-04-28T20:49:23 | 2012-04-28T23:41:55 | w | 60.5841 | 1 | 57.4281 | s |
| A113 | 1095 | 2012-05-12T19:48:01 | 2012-05-12T22:10:23 | w | 60.9746 | 1 | 57.6339 | d |
| B087 | 1101 | 2012-05-18T19:39:52 | 2012-05-18T22:32:24 | w | 60.2460 | 1 | 56.3936 | s |
| A114 | 1108 | 2012-05-25T19:01:50 | 2012-05-25T21:24:12 | w | 61.1698 | 1 | 57.5344 | s |
| A115 | 1119 | 2012-06-05T16:44:45 | 2012-06-05T19:07:07 | w | 61.0970 | 1 | 57.6556 | s |
| A116 | 1122 | 2012-06-08T16:43:08 | 2012-06-08T19:05:30 | w | 61.3202 | 1 | 57.7100 | d |
| A117 | 1136 | 2012-06-23T09:10:04 | 2012-06-23T11:32:26 | w | 60.8137 | 1 | 57.6911 | s |
| A118 | 1146 | 2012-07-02T15:57:44 | 2012-07-02T18:20:06 | w | 61.2490 | 1 | 57.1850 | s |
| A119 | 1157 | 2012-07-13T16:30:38 | 2012-07-13T18:53:00 | w | 60.9320 | 1 | 57.2533 | d |
| A120 | 1170 | 2012-07-26T14:40:38 | 2012-07-26T17:03:00 | w | 61.0454 | 1 | 57.6242 | s |
| B088 | 1179 | 2012-08-04T14:49:35 | 2012-08-04T17:42:07 | w | 60.4126 | 1 | 57.2525 | s |
c avoid interference with manual commanding (HIFI)
| # | OD | start cooler | end cooler | start | hold time | # bias | biased time | shape |
|---|---|---|---|---|---|---|---|---|
| recycling (UT) | recycling (UT) | cond. | (h) | periods | (h) | TEV | ||
| B089 | 1182 | 2012-08-07T15:17:36 | 2012-08-07T18:10:08 | w | 60.7152 | 1 | 56.8350 | s |
| A121 | 1193 | 2012-08-18T14:12:11 | 2012-08-18T16:34:33 | w | 61.0950 | 1 | 57.0972 | s |
| B090 | 1196 | 2012-08-21T13:52:24 | 2012-08-21T16:44:56 | w | 60.6987 | 1 | 57.2300 | d |
| B091 | 1200 | 2012-08-25T16:09:17 | 2012-08-25T19:01:49 | w | 60.8055 | 1 | 56.9783 | s |
| B092 | 1214 | 2012-09-08T17:21:18 | 2012-09-08T20:13:50 | w | 60.1515 | 1 | 57.6483 | s |
| B093 | 1235 | 2012-09-29T18:36:12 | 2012-09-29T21:28:44 | w | 60.3889 | 1 | 56.3078 | s |
| A122 | 1244 | 2012-10-08T17:31:46 | 2012-10-08T19:54:08 | w | 61.0778 | 1 | 57.1506 | d |
| B094 | 1249 | 2012-10-13T16:54:47 | 2012-10-13T19:47:19 | w | 60.3564 | 1 | 57.4428 | s |
| B095 | 1264 | 2012-10-28T16:43:06 | 2012-10-28T19:35:38 | w | 60.4298 | 1 | 56.3814 | s |
| B096 | 1270 | 2012-11-03T16:40:49 | 2012-11-03T19:33:21 | w | 60.3439 | 1 | 57.5953 | d |
| B097 | 1273 | 2012-11-06T16:48:13 | 2012-11-06T19:40:45 | w | 60.4971 | 1 | 57.1886 | s |
| B098 | 1279 | 2012-11-12T21:45:51 | 2012-11-13T00:38:23 | w | 60.9443 | 1 | 54.7631 | s |
| A123 | 1285 | 2012-11-18T21:28:36 | 2012-11-18T23:50:58 | w | 60.8648 | 1 | 57.5872 | d |
| A124 | 1293 | 2012-11-26T21:24:49 | 2012-11-26T23:47:11 | w | 61.2999 | 1 | 54.7717 | s |
| A125 | 1308 | 2012-12-11T14:02:18 | 2012-12-11T16:24:40 | w | 60.7747 | 1 | 57.6894 | s |
| A126 | 1314 | 2012-12-18T02:36:52 | 2012-12-18T04:59:14 | w | 60.6358 | 1 | 57.8556 | d |
| A127 | 1320 | 2012-12-23T13:34:30 | 2012-12-23T15:56:52 | w | 61.0521 | 1 | 57.7108 | s |
| A128 | 1327 | 2012-12-30T13:26:59 | 2012-12-30T15:49:21 | w | 61.0103 | 1 | 57.4708 | s |
| A129 | 1332 | 2013-01-04T12:29:51 | 2013-01-04T14:52:13 | w | 60.8369 | 1 | 57.3789 | s |
| A130 | 1337 | 2013-01-09T12:36:54 | 2013-01-09T14:59:16 | w | 60.9349 | 1 | 57.7964 | d |
| A131 | 1344 | 2013-01-16T13:01:53 | 2013-01-16T15:24:15 | w | 60.8892 | 1 | 57.4214 | d |
| A132 | 1349 | 2013-01-21T17:02:54 | 2013-01-21T19:25:16 | w | 60.7600 | 1 | 57.6244 | s |
| A133 | 1354 | 2013-01-26T17:32:26 | 2013-01-26T19:54:48 | w | 60.9113 | 1 | 57.7697 | d |
| B099 | 1375 | 2013-02-16T20:22:35 | 2013-02-16T23:15:07 | w | 60.8283 | 1 | 55.8261 | s |
| A134 | 1378 | 2013-02-19T23:33:12 | 2013-02-20T01:55:34 | w | 60.9005 | 1 | 57.4461 | s |
| A135 | 1399 | 2013-03-12T13:53:09 | 2013-03-12T16:15:31 | w | 60.3442 | 1 | 57.6919 | s |
| B100 | 1402 | 2013-03-15T13:50:08 | 2013-03-15T16:42:40 | w | 60.4554 | 1 | 57.6394 | s |
| A136d | 1418 | 2013-03-31T13:36:31 | 2013-03-31T15:58:53 | w | 65.2737 | 1 | 56.3383 | d |
| A137 | 1426 | 2013-04-08T14:59:01 | 2013-04-08T17:21:23 | w | 60.8467 | 1 | 57.7586 | d |
| A138e | 1440 | 2013-04-22T14:44:44 | 2013-04-22T17:07:06 | w | 57.0020 | 1 | 57.7450 | s |
| A139 | 1443 | 2013-04-25T14:42:18 | 2013-04-25T17:04:40 | w | 61.0741 | 1 | 57.7806 | s |
d not nominal: instrument power cycling in the middle of cooler cycle and biased time
e not nominal: anomaly in cooler recycling
9 Appendix A: Common Uplink System (CUS) command script for PACS cooler recycling
// Missionphase  :
//
// Purpose       : Perform the cooler recycling
//
// TCL author    : TM
// TCL file      : tm_phot_cooler_recycling.tcl
// CUS author    : DAC
// Script file   : BOLO_cool_recycle.txt
//
// Input arguments
// type    name         description
// N/A
//
// Return values
// Type        Description
// int []      Several duration times
//
// Description   : see PhFPU UM, chapter 4
//
// Dependencies  :
//
// Preconditions :
//
// Comments      : Based on the PhFPU UM Draft 6.0 and abundant e-mail
//                 exchanges with SAp
//
// Version       : 2.0
//
int[] block BOLO_cool_recycle PACS 203 {
}{
    // disable AF 14 (to check for TEMP_EV < 0.3 K)
    Pacs_DPU_SET_FUNCT("EVENT_BOL_T_FPU","DISABLE");
    // disable AF 21 (to check if the absolute value of the HSP current is below 2*10^(-5)A)
    Pacs_DPU_SET_FUNCT("EVENT_BOL_I_SP1","DISABLE");
    // enable AF 18 (to check if the current of the sorption pump heater is below 30mA)
    Pacs_DPU_SET_FUNCT("EVENT_BOL_I_SP2","ENABLE");
    //
    // Obtain and set Block ID
    WriteBBID($BBID);
    // Define variables to communicate various durations to HSPOT.
    // NOTE: all time variables in units of number of ramps (SPEC) or
    //       number of readouts (BOLO). The calling program must convert this
    //       count into actual duration in true time units [seconds].
    //       SRC, REF, CAL, OVR stand for time spent on SRC, REF (on sky),
    //       CAL source, and overheads (wait for something). Total
    //       duration is given by duree_num. If no error, this duration
    //       must be equal to the sum of all others
    // NOTE: here all durations are given in [sec]
    int duree_num = 0;
    int duree_SRC = 0;
    int duree_REF = 0;
    int duree_CAL = 0;
    int duree_OVR = 0;
    // Set HK to PHOT
    Pacs_DPU_SET_HK_LIST("PHOT","BOTH Array");
    // content of "Preparation_au_recyclage.txt"
    // Set SP heater current to  to 0.00000000 amperes (0)
    // # P 07 01 0000
    int operand = 0x7010000;
    Pacs_DMC_SEND_COMMAND_BOLC(operand);
    int t_wait = 1;
    delay(t_wait);
    duree_num = t_wait;
    duree_OVR = t_wait;
    // Set HSP heater current to  to 0.00000000 amperes (0)
    // # P 07 02 0000
    operand = 0x7020000;
    Pacs_DMC_SEND_COMMAND_BOLC(operand);
    t_wait = 1;
    delay(t_wait);
    duree_num = duree_num + t_wait;
    duree_OVR = duree_OVR + t_wait;
    // Set HSE heater current to  to 0.00140000 amperes (3572)
    // # P 07 03 0DF4
    // Attendre 300000 ms
    // # S 01 0493E0
    operand = 0x7030df4;
    Pacs_DMC_SEND_COMMAND_BOLC(operand);
    t_wait = 300;
    delay(t_wait);
    duree_num = duree_num + t_wait;
    duree_OVR = duree_OVR + t_wait;
    // Set HSE heater current to  to 0.00118000 amperes (3011)
    // # P 07 03 0BC3
    // Attendre 900000 ms
    // # S 01 0DBBA0
    operand = 0x7030bc3;
    Pacs_DMC_SEND_COMMAND_BOLC(operand);
    t_wait = 900;
    delay(t_wait);
    duree_num = duree_num + t_wait;
    duree_OVR = duree_OVR + t_wait;
    //*****************************************************************
    //**                                                             **
    //**     Automatic Cooling reclycling                            **
    //**     ("Recyclage_Auto_Time.txt")                             **
    //**                                                             **
    //*****************************************************************
    //
    // - 23/01/06 Procedure of reclycling in Saclay cryostat with Phfpu MV
    // - note : this is timing version without temperature test
    //
    //         Initialisation of BOLC
    //
    // Set temp probe on/off FF hexa
    // # P 07 00 00 FF
    //
    //         Initialisation of LTU
    //
    // Inhiber enregistrement TM
    // # S 08
    // Valider enregistrement TM
    // # S 09
    //
    // Initial conditions
    // TEMP_SP < 10K
    // TEMP_EV < 2K
    //
    // Set SP heater current to  to 0.02730000 amperes (2231)
    // # P 07 01 08B7
    //
    // Attendre 2100000 ms
    // # S 01 200B20
    operand = 0x70108b7;
    Pacs_DMC_SEND_COMMAND_BOLC(operand);
    t_wait = 2100;
    delay(t_wait);
    duree_num = duree_num + t_wait;
    duree_OVR = duree_OVR + t_wait;
    //
    // Set SP heater current to  to 0.00700000 amperes (580)
    // # P 07 01 0244
    //
    // Attendre 2820000 ms
    // # S 01 2B07A0
    operand = 0x7010244;
    Pacs_DMC_SEND_COMMAND_BOLC(operand);
    t_wait = 2820;
    delay(t_wait);
    duree_num = duree_num + t_wait;
    duree_OVR = duree_OVR + t_wait;
    //
    // Set HSE heater current to  to 0.00000000 amperes (0)
    // # P 07 03 0000
    //
    // Attendre 720000 ms
    // # S 01 0AFC80
    operand = 0x7030000;
    Pacs_DMC_SEND_COMMAND_BOLC(operand);
    t_wait = 720;
    delay(t_wait);
    duree_num = duree_num + t_wait;
    duree_OVR = duree_OVR + t_wait;
    //
    // Set SP heater current to  to 0.00000000 amperes (0)
    // # P 07 01 0000
    operand = 0x7010000;
    Pacs_DMC_SEND_COMMAND_BOLC(operand);
    t_wait = 1;
    delay(t_wait);
    duree_num = duree_num + t_wait;
    duree_OVR = duree_OVR + t_wait;
    //
    // Set HSP heater current to  to 0.00140000 amperes (3569)
    // # P 07 02 0DF1
    //
    // Attendre 480000 ms
    // # S 01 075300
    operand = 0x7020df1;
    Pacs_DMC_SEND_COMMAND_BOLC(operand);
    t_wait = 480;
    delay(t_wait);
    duree_num = duree_num + t_wait;
    duree_OVR = duree_OVR + t_wait;
    //
    // Set HSP heater current to  to 0.00118000 amperes (3010)
    // # P 07 02 0BC2
    operand = 0x7020bc2;
    Pacs_DMC_SEND_COMMAND_BOLC(operand);
    t_wait = 1;
    delay(t_wait);
    duree_num = duree_num + t_wait;
    duree_OVR = duree_OVR + t_wait;
    //
    // ************************Ψ
    // **                    **
    // ** end recycling      **
    // **                    **
    // ************************Ψ
    //  Last message
    debug_print("Recycling completed, in about 20 min, TEMP_EV < 0.3 K");
    t_wait = 1200;
    duree_num = duree_num + t_wait;
    duree_OVR = duree_OVR + t_wait;
    delay(t_wait);
    //
    // AF settings
    //
    // disable AF 18 (to check if the current of the sorption pump heater is below 30mA)
    Pacs_DPU_SET_FUNCT("EVENT_BOL_I_SP2","DISABLE");
    // enable AF 21 (to check if the absolute value of the HSP current is below 2*10^(-5)A)
    Pacs_DPU_SET_FUNCT("EVENT_BOL_I_SP1","ENABLE");
    //
    // Set HK to NO PRIME (to have the clean SAFE settings again)
    Pacs_DPU_SET_HK_LIST("NO_PRIME","BOTH Array");
    // Return the array of times
    int[] time_array = [duree_num,duree_SRC,duree_REF,duree_CAL,duree_OVR];

    return time_array;
}