New activity pattern
in human interactive dynamics
Abstract
We investigate the response function of human agents as demonstrated by written correspondence, uncovering a new universal pattern for how the reactive dynamics of individuals is distributed across the set of each agent’s contacts. In long-term empirical data on email, we find that the set of response times considered separately for the messages to each different correspondent of a given writer, generate a family of heavy-tailed distributions, which have largely the same features for all agents, and whose characteristic times grow exponentially with the rank of each correspondent. We furthermore show that this universal behavioral pattern emerges robustly by considering weighted moving averages of the priority-conditioned response-time probabilities generated by a basic prioritization model. Our findings clarify how the range of priorities in the inputs from one’s environment underpin and shape the dynamics of agents embedded in a net of reactive relations. These newly revealed activity patterns might be present in other general interactive environments, and constrain future models of communication and interaction networks, affecting their architecture and evolution.
Keywords: complex systems — human dynamics — priority queueing — time scaling
1 Introduction
The interaction dynamics of animal and human agents is of interest in many theoretical and applied domains of science, from ecology to sociology to economics. Especially interesting is the clarification of the response function of humans, which has been investigated in a variety of contexts [1, 2, 3, 4, 5, 6], a paradigmatic case being written correspondence, especially through email.
When each person is viewed as the node of a graph, written communication generates an evolving weighted and directed network whose large-scale structure and dynamics are still virtually unknown. Many interesting facts have emerged from the investigation of a number of email or paper mail databases collecting basic empirical information on written correspondence spanning from a few months [7, 8] to several decades of writers’ activity [6, 9, 10, 12, 13]. Intermittency was observed in the dynamics of correspondence writers, with bursts of events separated by long pauses, with non-Poissonian, heavy-tailed statistics in both the agents’ inter-event times and response times (RTs), see the definitions below and Fig. 1. This also relates to the heavy-tailed temporal distributions observed in human and animal behavior and locomotion [1, 2, 3, 4, 5, 6, 14, 15, 16, 17, 18].
A number of approaches have been used to characterize the features of the empirical time statistics of written communication [6, 19, 20, 21, 22, 23, 11, 24, 25, 26, 27], with debated indications of scaling behavior for the waiting times, and for their possible modeling through priority queueing. A new method for the analysis of these human reactive phenomena has been recently proposed [13], through which it was shown that, in particular, the mechanisms underpinning the response-time (RT) statistics of written correspondence are best understood, rather than in terms of standard time , in terms of an agent’s activity, i.e. by a ’proper time’ parameter counting an agent’s outbound messages. This approach [13] disentangles from the overall time dynamics of writers the contributions due to their spontaneous pauses between messages, and helped uncover universal power-law features in the RT statistics on written correspondence when the -clocking is utilized, rather than the usual -clocking (Fig. 1).
Despite the insight given by such earlier enquiries, information of primary importance about the basic features of human interaction is still lacking, both in the data analysis and modeling. First and foremost, solely the total RT distribution of correspondence writers (with ) has so far been considered in the literature, and it is presently unknown in which way the overall interaction of a given agent is distributed among all of her distinct targets. For instance, the response statistics of a writer separately with each one of her correspondents have so far never been obtained. This lack of empirical analysis parallels the fact that some main aspects of priority modeling have also remained unexplored in the above context.
In the present study we go beyond the analysis of the total RT distribution of correspondence writers, and investigate how the writers’ activity depends on the identity of their distinct contacts. As was done in Ref. [28], where the voice-call inter-event times of cell-phone users with their distinct contacts have been considered, such an analysis is the first, natural step in a more in-depth investigation of the activity patterns in interaction networks, and sheds light on their structure that cannot be obtained from the sole total distribution of the involved agents. We utilize for our inquiry the database presented in Ref. [13] and briefly described below, which is the most complete long-term email dataset currently available in the literature. Our findings reveal a new universal behavioral patterns as well as new modeling effects, evidencing hitherto unknown universal aspects of human interaction. The analysis also illustrates how priority, which in the model is a hidden variable not immediately linked to real data, operates in the generation of a dynamics in accord with empirical observations.
2 Database and definitions. Proper time
Our written communication data concern the full server-recorded activity of all the email accounts belonging to a Department of a large EU university during two years (see also Ref. [13]). The collected data are in the form {sender, receiver, timestamp}, with senders and receivers conventionally numbered for identification, and timestamps given in seconds.
Referring to an agent , the response times (RTs) are defined as the time intervals (in seconds) separating the arrival of any message from any agent to , and the first ensuing message ′ going from to , independently of the subject or contents of or ′. Following Ref. [13], to extricate from the time dynamics of the contributions due to ’s pauses between messages (given by the individual inter-event time distribution of ), we introduce the activity parameter (proper time) of , which clocks the number of outgoing messages from . The RTs of are thus defined by counting the number of outgoing messages from intervening between the same messages and as above, as represented in Fig. 1.
Out of all the nominal monitored accounts in our dataset, we have analyzed the 300 most active agents, whose activity comprises from a minimum of 390 to total RTs. A large percentage of these 300 writers have in the order of a few thousand RTs, distributed over a number of distinct correspondents ranging from less than to almost . The Supplementary Figure
111The Supplementary Figure ( 9 MB) is available at
https://www.researchgate.net/publication/280645729_Supplementary_figure_for_New_activity_pattern_in_human_interactive_dynamics
shows explicitly the RT statistics pertaining to the 84 most active, and the 12 least active, among such 300 agents.
3 Empirical results: new universal behavioral pattern
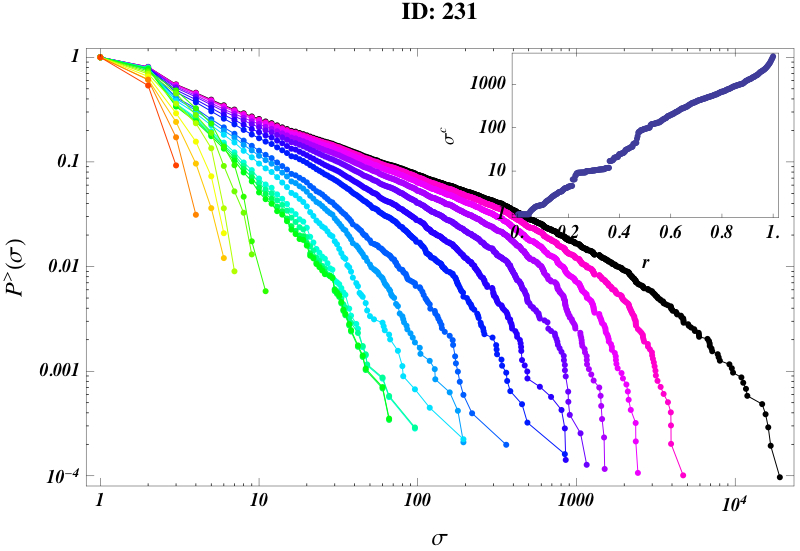
We break down the activity of a writer by considering the RTs of separately for each one of her correspondents (see Fig. 1). We then rank ’s correspondents , , , through their growing characteristic (-)times , the latter being computed from the set of -clocked RTs that generates with each distinct . Then, from the empirical data regarding , we obtain the ordered family of -clocked distributions
| (1) |
where is the total number of ’s correspondents.
 |
 |
|
 |
 |
|
 |
 |
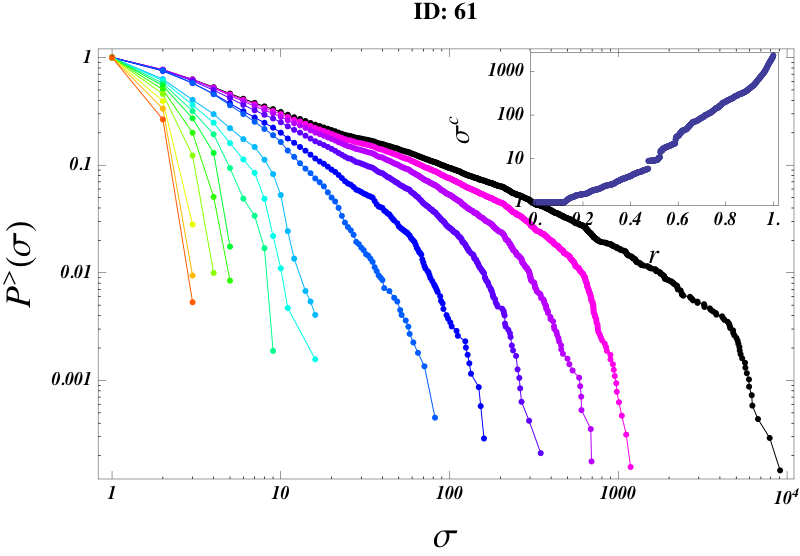
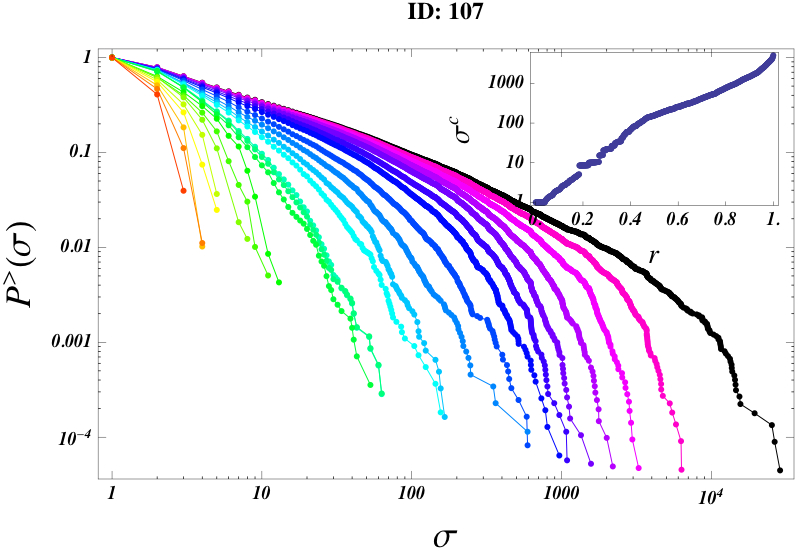
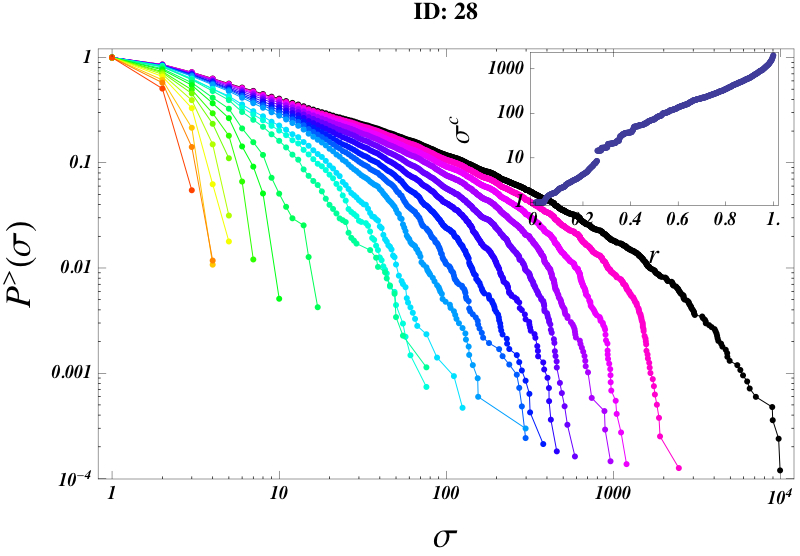
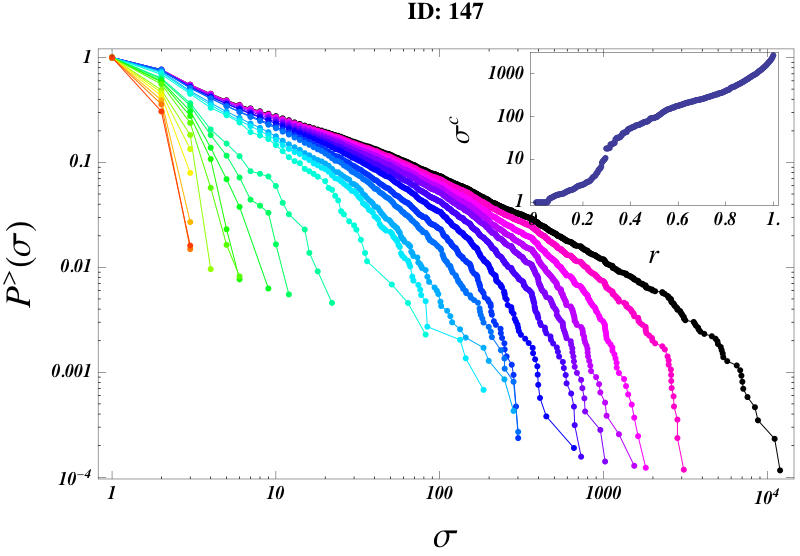
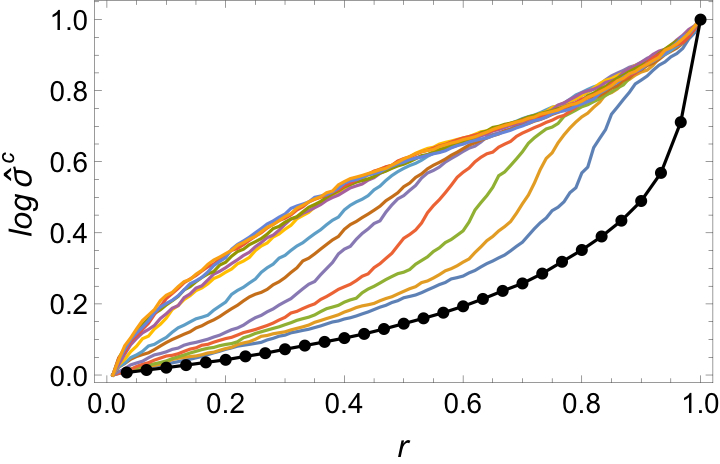
For any given , in (1) we denote by the (inverse) cumulative RT distribution associated to the activity of with all her correspondents with , i.e. gives the probability of finding RTs longer than when considering the responses of to any with . In particular: is the distribution of RTs of with her corresponent ; is the distribution of the aggregated RTs of with her correspondents and ; and so on, with giving the total cumulative RT distribution of agent with all her correspondents. Fig. 2 shows the empirical RT distributions belonging to the family of a typical agent in the database. A quantitative description of the overall features of a family is obtained by computing the characteristic time pertaining to each , i.e. the values computed for the RTs of with all her correspondents , with . The indicate how the -clocked RTs associated to the correspondents of up to the -th rank, grow longer as a whole with . These values, which grow monotonically with , measure how rapidly the curves progressively spread apart from each other on the plane for growing , as they approach, for , the total cumulative distribution of (this is the upper-most curve, obtained for , shown in black in each panel of Fig. 3). We find in Fig. 2 that in the family the individual distributions are heavy-tailed, but they are not power laws for , and do not warrant any simple fitting form nor collapse property. We also observe in the inset of Fig. 2 that the characteristic times computed for each distribution , grow roughly exponentially with rank (the inset of Fig. 2 shows as a function of the normalized correspondent rank ).
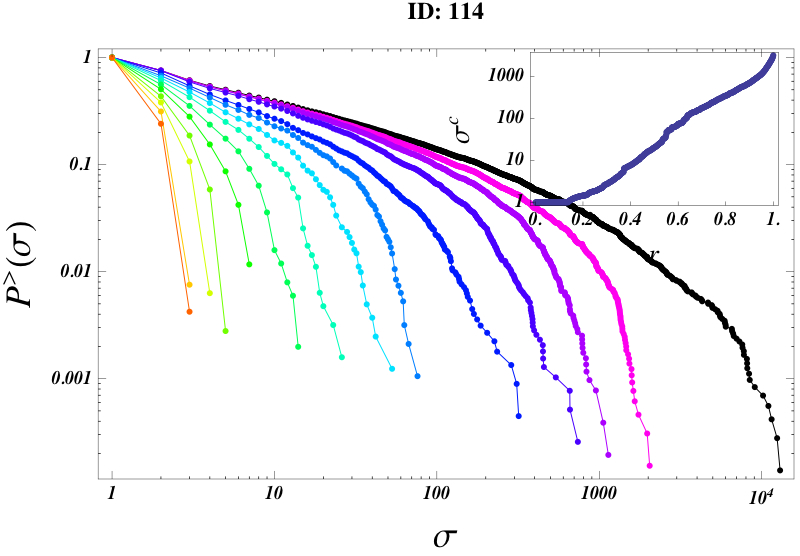
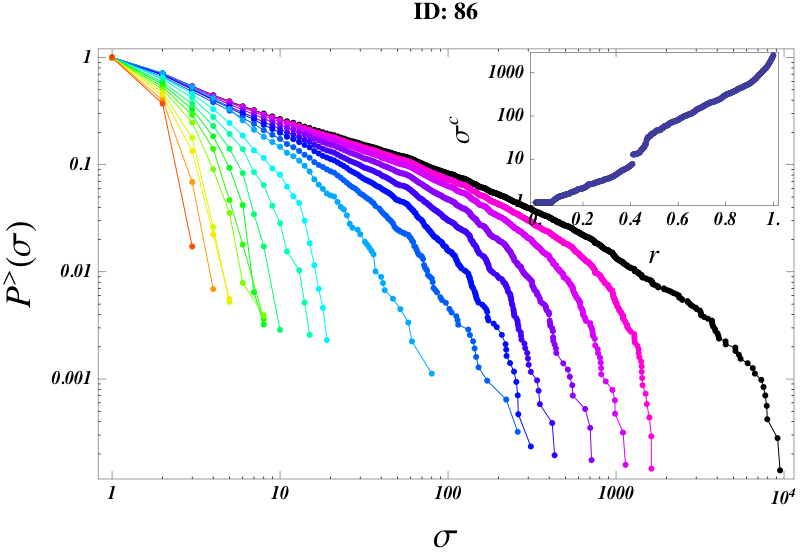
As mentioned, the analysis in Ref. [13] has revealed a strong universality in written communication, showing that the activity-clocked total RT probability densities of correspondence writers have the form of exponentially truncated power laws, with empirical exponents averaging near across all correspondence media (letters, email, text messaging). An even stronger form of behavioral universality emerges from the analysis of the response patterns of humans described by the empirical distribution families in (1). Indeed, Fig. 3 shows the relative to six typical active writers , where we see how the distribution families pertaining to different agents exhibit largely the same features as those evidenced in Fig. 2, clearly pointing to a common pattern in these agents’ reactive dynamics. More statistics of this type are given in the Supplementary Figure, wherein the common pattern in the families highlighted in Figs. 2-3 is not recognizable only for the least active agents in the database.
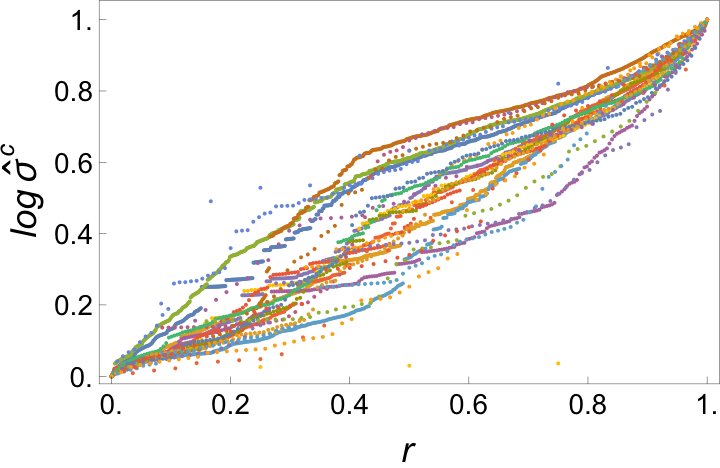
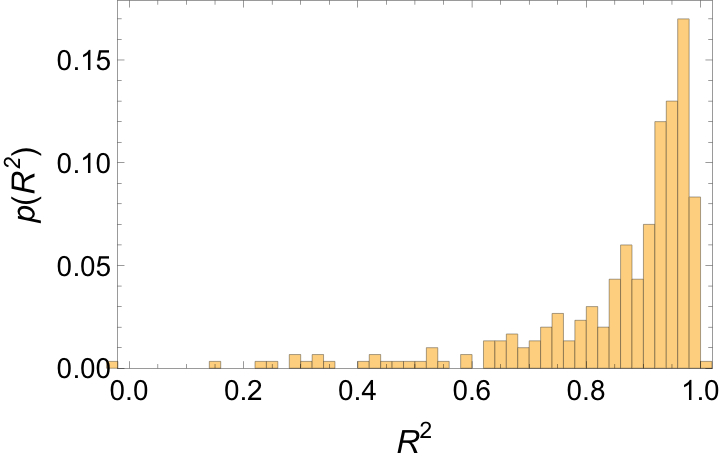
To establish more precisely the statistical commonality indicating the universal behavior of email writers, we analyze the characteristic times pertaining to different agents. Fig. 4(a) shows the behavior of the normalized characteristic times for a random sample of writers in the database (see more data in the Supplementary Figure). A metric can be considered on the set of characteristic-times curves by analyzing the behavior of the parameter, for all the 300 agents in the dataset. The histogram in Fig. 4(b) gives the relative frequency plot for the fit of such curves by a normalized exponential function. We see the histogram is strongly peaked, confirming that the grow roughly exponentially with rank for the great majority of agents, and giving quantitative confirmation to the universality of the activity pattern of email writers revealed by Figs. 2-3 and theSupplementary Figure.
 |
 |
|
| (a) | (b) |
4 Model: prioritization
Previous work [19, 6, 9, 29, 30, 31, 20, 21, 22, 13] has analyzed various aspects of priority queueing in relation to written correspondence. Here we show how a simple model based on prioritization as in Ref. [13], which accurately describes the power-law behavior of the total -clocked RT distribution observed in correspondence writers, also accounts robustly for the RT patterns described by the family of empirical -clocked distributions as in Figs. 2-3.
We describe the model in its simplest form, suitable for agents whose exponent is (close to) . For different individual exponents see Ref. [13]. We consider for an agent an initial list of tasks, with assigned priorities sampled from the uniform distribution on . At each time step (which corresponds to a unit increment of the activity parameter ) the task with highest priority in the list is executed (a message replied), and new tasks are added on average to the list, each one with priority sampled as above. It was analytically proven [29, 30, 32] that this queueing mechanism produces an RT probability density which for decays as a power law with exponent . When finite values of are considered as in numerical simulations, a truncated ()-power-law is obtained for the RTs. Interestingly, we compute that also such finite-size effect obtained in the model agrees with the cut-off observed in the scaling statistics from the empirical data, because for activity cycles, both the model and data give a characteristic time for the total cumulative RT distribution .
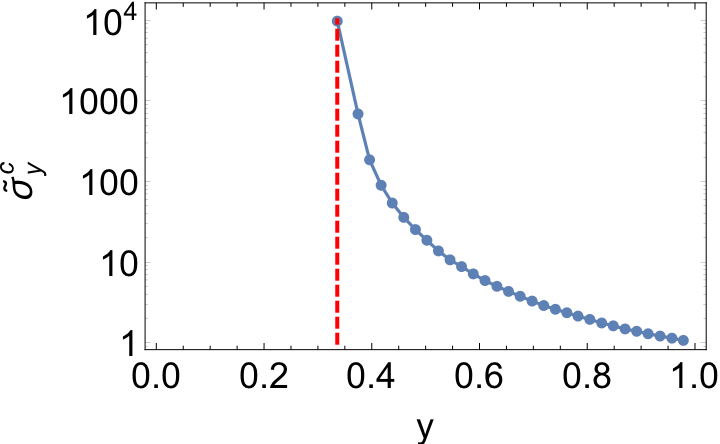
Now, for the purpose of relating the model to the empirical features highlighted above regarding , it is natural to consider the priority-conditioned distributions that are generated by priority queueing. Specifically, let us consider the family of distributions , where is the probability of observing an RT larger than given that the priority of the replied-to messages has values greater than . When plotted, these -conditioned distributions in exhibit heavy tails, and, for decreasing , fan out in the plane in a way that is reminiscent of the empirical curves in Fig. 3 for growing . However, the distribution family does not provide a good description for the families obtained from the empirical data, because the characteristic times computed for the above , i.e. by considering the aggregated RTs given by the model for all priorities greater than , grow supra-exponentially as . This can be seen from the characteristic times shown in Fig. 5(b). Fig. 7 below also shows the , whose supra-exponential theoretical values do not satisfactorily match the behavior of the empirical counterparts for growing rank , shown in the insets of Figs. 2-3.
 |
 |
|
| (a) | (b) |
5 Gaussian averaging
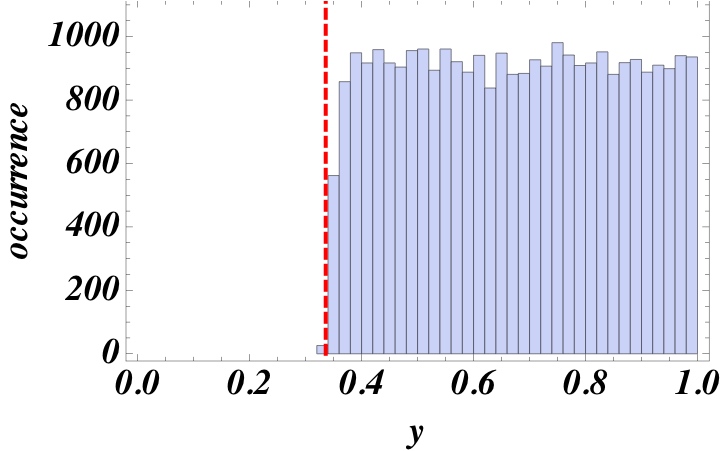
To actually connect the model to the empirical families , we need to better understand the operation of the priority in generating the RTs in the queueing process. For this, we consider the distribution of -values for the generated RTs, which are shown in Fig. 5(a). We notice prioritization generates a threshold effect, whose existence can be proven in our context by adapting the arguments in Ref. [33] Accordingly, only the entering messages whose priority is are replied to in the model. As already mentioned, the characteristic times of the corresponding RTs, shown in Fig. 5(b), exhibit supra-exponential growth as the priority of the entering messages approaches the threshold value from above, and likewise behave the .
The failure of the family to represent correctly the features of is not surprising because, while certainly present, the correlation between the identity of correspondents and their messages’ priority cannot be too strict, as each correspondent of should be associated, rather than to a single value of the priority , to some individual distribution of -values. To describe this, we consider a suitable family of kernels which, for each , describe in the model the distribution (with suitable s.d. , and with mean decreasing with growing ) of priorities for the messages from the -th correspondent which has replied to. Given such ’s, we compute the distributions
| (2) |
where is the probability of observing, in the model, an RT in a small neighborhood of given that the priority of the replied-to messages has values in a small neighborhood of . Then, the behavior exhibited by the empirical families in Fig. 3 should be better captured by a new family of distributions
| (3) |
where the are the (cumulative) distributions associated to the in (2), i.e., they give the probability of observing RTs greater than when considering in the model the aggregated replied-to messages pertaining to all the -samples with average priorities greater than .
The simplest hypothesis in this context considers, for , Gaussian kernels in (2), with a common s.d. , and values of the mean which are homogeneously distributed between and 1 (these bounds derive from the threshold effect in the model, see Fig. 5). The distribution of -values over the RTs in the model remains largely homogeneous after sampling by means of these kernels, as in Fig. 5(a). For we recover the model with no averaging.
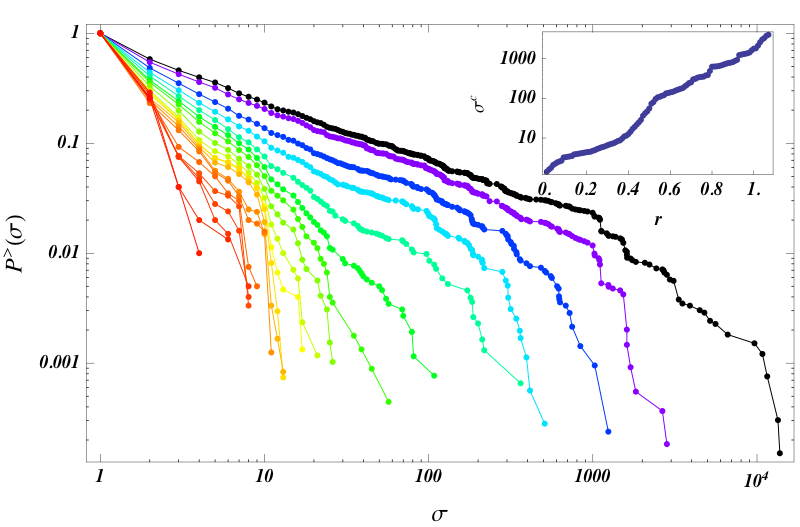
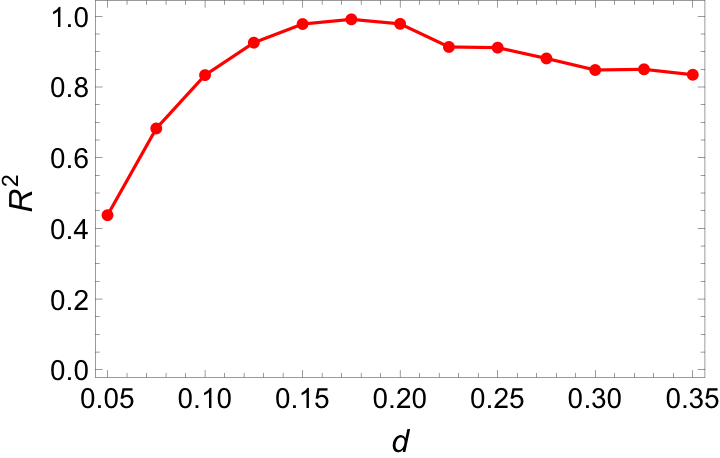
Fig. 6 shows the family of distributions in (3) computed through the above Gaussian kernels, for and . We see that the curves in the averaged distribution family do reproduce qualitatively very well the behavior of the empirical curves in the families in Fig. 3 and in the Supplementary Figure. In particular, the inset in Fig. 6 shows that the values , computed by aggregating the RTs given by the model referring to all the Gaussian samples with average priorities greater than , grow roughly exponentially with rank (i.e. as ). This matches closely the behavior of their empirical shown in the insets of Figs. 2-3. The analysis in Fig. 7 corroborates the accord of with the empirical families , as we see that the computed characteristic times of (i.e. the colored curves) in Fig. 7(a) behave like their empirical counterparts in Fig. 4(a) for a range of values of the order . This agreement of the averaged-model family with the empirical families is assessed quantitatively in Fig. 4(b), which shows the high values, above 0.9, obtained for the exponential fit of the computed characteristic times for in this -range. This indicates that the characteristic times in the averaged model robustly display roughly exponential growth as do their empirical counterparts in Figs. 3-4(b). This effect thus does not need fine tuning in the model, and is rather rooted in the prioritization process and the weighted averaging used to account for the priority distribution of the messages from each correspondent.
 |
 |
|
| (a) | (b) |
6 Discussion
We have achieved in this study a two-fold result. (a) Firstly, we have uncovered a new universal activity pattern in the interactive dynamics of correspondence writers, highlighted through the examination of long-term empirical data on written correspondence via email. We find that agents all distribute in the same way their interactions separately with each one of their distinct contacts, generating families of heavy-tailed RT distributions which have largely the same features across writers, with characteristic times which universally exhibit roughly exponential growth with correspondent rank. This analysis considerably extends the scrutiny of the sole total distribution of correspondence writers, on which the literature has focused so far. (b) We have furthermore shown that this previously undetected behavioral pattern emerges robustly by considering Gaussian moving averages on the priority-conditioned RT probabilities derived from a basic priority model.
Our findings clarify how priority-queueing contributes to generate the observed activity statistics of human response, and suggest the associated universal patterns may result from fundamental constraints imposed by prioritization and by averaging mechanisms on the outcome of any complex underlying individual choice processes. The effects reveled here should affect both the architecture and the evolution of communication and interaction (social) networks, imposing explicit constraints on their future exploration and modeling. They may also contribute to better estimate the possible value of such networks related to size, [34, 35] which is an important question in computer science, business management, and sociology. Natural extensions of the present study relate to the possibility of identifying, within the individual variations of the empirical -curves, the existence of core communities [36, 37] within each agent’s ensemble of correspondents. Another point of interest is the adoption of less schematic averaging kernels than used above. This would not affect the basic point of behavioral universality highlighted here, but may help capture other effects occurring in written communication, and in reactive dynamics in general. Indeed, we expect the stylized facts [38] and universal activity patterns presently uncovered for email correspondence can also occur, and could be successfully investigated, in other general interactive environments. This should promote our understanding of the dynamics of reciprocal activity in diverse agent-driven domains, as in economics or sociology. For instance, our approach may enhance queueing-based models [33, 39, 40] as valuable tools in finance for investigating order-book dynamics. Also theories for preference formation and extraction, for competing-opinion dynamics, and for information spreading [41, 42, 43, 44], may benefit from the knowledge and analysis of reciprocal-action data such as we have obtained here on emailing, because decision making at the personal and collective levels, or the shift of sentiments and preferences, are largely based on how individuals communicate and interact with each other. In general, the present analysis should help inform future empirical and theoretical work on the interplay among distinct agents of any kind, animate or inanimate, embedded in networks of reactive relations.
Acknowledgements
We thank Dr. M. Gravino for providing to us the email data analyzed in this study. AM acknowledges the Cariparo Foundation for financial support. MF acknowledges financial support of GAČR grant P201/12/2613. MF thanks prof. J.M. Swart for many conversations.
Author contributions statement
Authors with initials M.F., A.L., A.M. and G.Z. equally contributed to the manuscript.
Additional information
Competing financial interests: The authors declare no conflict of interest.
References
- [1] T. Henderson and S. Bhatti. Modelling user behaviour in networked games, MULTIMEDIA ’01: Proc. of the 9th ACM international conference on Multimedia, pp. 90–94 (2001).
- [2] Q. Wang and J.-L. Guo. Human dynamics scaling characteristics for aerial inbound logistics operation, Physica A-Statistical Mechanics And Its Applications 389, 2127 (2010).
- [3] Z. Dezso, et al. Dynamics of information access on the web, Phys. Rev. E 73, 066132 (2006).
- [4] B. Gonçalves and J. J. Ramasco. Human dynamics revealed through Web analytics, Phys. Rev. E 78, 026123 (2008).
- [5] L. Gao, J.-L. Guo, C. Fan and X.-J. Liu. Individual and group dynamics in purchasing activity, arXiv.org 1010, (2010).
- [6] A. Vazquez, et al. Modeling bursts and heavy tails in human dynamics, Phys. Rev. E 73, 036127 (2006).
- [7] J. Eckmann, E. Moses, and D. Sergi. Entropy of dialogues creates coherent structures in e-mail traffic, Proc. Natl. Acad. Sci. U.S.A. 101, 14333 (2004).
- [8] Y. Wu, C. Zhou, J. Xiao, J. Kurths, and H. J. Schellnhuber. Evidence for a bimodal distribution in human communication, Proc. Natl. Acad. Sci. U.S.A. 107, 18803 (2010).
- [9] J.G. Oliveira and A.-L. Barabasi. Human dynamics: Darwin and Einstein correspondence patterns, Nature 437, 1251 (2005),
- [10] S. Qu, Q. Wang, and L. Wang. The statistical research of human dynamics on correspondence, Proceedings of the 2011 International Conference on Modelling, Identification and Control (ICMIC), 282–284 (2011).
- [11] R.D. Malmgren, D.B. Stouffer, A.E. Motter, and L.A.N. Amaral. A Poissonian explanation for heavy tails in e-mail communication. Proc. Natl. Acad. Sci. U.S.A., 105, 18153–18158 (2008).
- [12] R.D. Malmgren, D.B. Stouffer, A.S. Campanharo and L.A.N. Amaral. On universality in human correspondence activity, Science 325, 1696 (2009).
- [13] M. Formentin, A. Lovison, A. Maritan and G. Zanzotto. Hidden scaling patterns and universality in written communication, Phys. Rev. E 90, 012817 (2014).
- [14] K. Hanai, M. Ozaki, D. Yamauchi and Y. Nakatomi, Scale Free Dynamics Involved in the Ant Locomotion, Proceedings of the Int. Conf. on Cellular and Molecular Biology, Biophysics and Bioengineering (2006).
- [15] R. Crane, F. Schweitzer, and D. Sornette, Power law signature of media exposure in human response waiting time distributions, Phys. Rev. E 81, 056101 (2010).
- [16] A. Proekt, J.R. Banavar, A. Maritan, and D.W. Pfaff. Scale invariance in the dynamics of spontaneous behavior, Proc. Natl. Acad. Sci. U.S.A. 109, 10564 (2012).
- [17] K. Jung, H. Jang, J.D. Kralik, and J. Jeong. Bursts and heavy tails in temporal and sequential dynamics of foraging decisions, PLoS Computational Biology 10, e1003759 (2014).
- [18] O. Mryglod, B. Fuchs, M. Szelle, Yu. Holovatcha, and S. Thurner, Interevent time distributions of human multi-level activity in a virtual world, Physica A 419, 681 (2015).
- [19] A. Barabasi. The origin of bursts and heavy tails in human dynamics, Nature 435, 207 (2005).
- [20] G. Grinstein and R. Linsker. Power-law and exponential tails in a stochastic priority-based model queue, Phys. Rev. E 77, 012101 (2008).
- [21] N. Masuda, J.S. Kim, and B. Kahng. Priority queues with bursty arrivals of incoming tasks, Phys. Rev. E 79, 036106 (2009).
- [22] J. Walraevens, T. Demoor, T. Maertens, and H. Bruneel. Stochastic queueing-theory approach to human dynamics, Phys. Rev. E 85, 021139 (2012).
- [23] P. Blanchard and M.-O. Hongler. Modeling human activity in the spirit of Barabasi’s queueing systems, Phys. Rev. E 75, 026102 (2007).
- [24] B. Min, K.-I. Goh, and I.-M. Kim. Waiting time dynamics of priority-queue networks, Phys. Rev. E 79, 056110 (2009).
- [25] W.-K. Cho, B. Min, K.-I. Goh. Generalized priority-queue network dynamics: Impact of team and hierarchy, Phys. Rev. E 81, 066109 (2010).
- [26] K. Kim and K.C. Chae. Discrete-time queues with discretionary priorities, Eur. J. Operat. Res. 200, 473 (2010).
- [27] H.-H. Jo, R.K. Pan, and K. Kaski. Time-varying priority queuing models for human dynamics, Phys. Rev. E 85, 066101 (2012).
- [28] Z.-Q. Jiang et al. Calling patterns in human communication dynamics, Proc. Natl. Acad. Sci. U.S.A. 110, 1600 (2013).
- [29] A. Gabrielli and G. Caldarelli. Invasion percolation and the time scaling behavior of a queuing model of human dynamics , J. Stat. Mech.-Theory and Experiment, P02046 (2009).
- [30] A. Gabrielli and G. Caldarelli. Invasion percolation on a tree and queueing models, Phys. Rev. E, 041133 79 (2009b).
- [31] G. Grinstein and R. Linsker. Biased diffusion and universality in model queues, Phys. Rev. Lett. 97, 130201 (2006).
- [32] J. Abate and W. Whitt. Asymptotics for M/G/1 low-priority waiting-time tail probabilities, Queueing Systems 25, 173 (1996).
- [33] H. Luckock. A steady-state model of the continuous double auction, Quantitative Finance 3, 385 - 404 (2003).
- [34] B. Briscoe and A. Odlyzko. Metcalfe’s law is wrong, IEEE Spectrum 43(7), 34. (2006).
- [35] R. Tongia and E.J. Wilson. The flip side of Metcalfe’ s law: multiple and growing costs of network exclusion, Int. J. Comm. 5, 665. (2011).
- [36] R.I.M. Dunbar. Neocortex size as a constraint on group size in primates, J. Human Evol. 22 (6), 469 - 493 (1992).
- [37] B. Gonçalves, N. Perra and A. Vespignani. Modeling users’ activity on Twitter networks: validation of Dunbar’s number, PLoS ONE 6 (8), e22656. (2011).
- [38] M. Buchanan. It’s a (stylized) fact!, Nature Physics 8, 3 (2012).
- [39] D.K. Gode and S. Sunder. Allocative efficiency of markets with zero-intelligence traders: Market as a partial substitute for individual rationality, J. Polit. Econ. 101, 119. (1993).
- [40] J.D. Farmer, P. Patelli and I.I. Zovko. The predictive power of zero intelligence in financial markets, Proc. Natl. Acad. Sci. U.S.A. 102, 2254-2259. (2005).
- [41] N.O. Hodas and K. Lerman. The simple rules of social contagion, Scientific Reports 4, 4343. (2014).
- [42] K. Burghardt, W. Rand and M. Girvan. Competing opinions and stubborness: connecting models to data, arXiv:1411.7415 (2014).
- [43] J. Xie et al. Evolution of opinions on social networks in the presence of competing committed groups, PLoS ONE e0033215. (2012).
- [44] S. Das, S. Gollapudi, and K. Munagala. Modeling opinion dynamics in social networks, WSDM ’14 Proceedings of the 7th ACM international conference on Web search and data mining 403 - 412. (2012).