Kinematic alignment of non-interacting CALIFA galaxies
We present 80 stellar and ionised gas velocity maps from the Calar Alto Legacy Integral Field Area (CALIFA) survey in order to characterize the kinematic orientation of non-interacting galaxies. The study of galaxies in isolation is a key step towards understanding how fast-external processes, such as major mergers, affect kinematic properties in galaxies. We derived the global and individual (projected approaching and receding sides) kinematic position angles (PAs) for both the stellar and ionised gas line-of-sight velocity distributions. When compared to the photometric PA, we find that morpho-kinematic differences are smaller than 22 degrees in 90 % of the sample for both components; internal kinematic misalignments are generally smaller than 16 degrees. We find a tight relation between the global stellar and ionised gas kinematic PA consistent with circular-flow pattern motions in both components. This relation also holds generally in barred galaxies across the bar and galaxy disk scales. Our findings suggest that even in the presence of strong bars, both the stellar and the gaseous components tend to follow the gravitational potential of the disk. As a result, kinematic orientation can be used to assess the degree of external distortions in interacting galaxies.
Key Words.:
Galaxies: kinematics and dynamics Galaxies: photometry Galaxies: structure Galaxies: evolution1 Introduction
To first order, galaxies are rotationally-supported disk systems (for a historical review see e.g., Sofue & Rubin 2001). The observed line-of-sight velocity distributions are expected to show a regular rotation pattern in the form of the so-called “spider diagram”, with the position angle (PA) of the minimum and maximum aligned with the optical major axis. However, several physical processes can disturb this regular behaviour. On the one hand, kinematic perturbations can be induced by external factors such as ram-pressure stripping (e.g., Kronberger et al. 2008) or galactic mergers (e.g., Naab & Burkert 2003). On the other hand, kinematic departures from regular rotation can be due to internal instabilities such as spiral arms or bars (Binney & Tremaine 2008; Sellwood 2013). To disentangle the perturbations due to external processes it is necessary first to study in detail the possible kinematic perturbations due to internal processes in both stars and gas.
Integral-field spectroscopy (IFS) is a unique tool to study the kinematic properties across the entire galaxies. Even though 3D spectroscopic surveys are now feasible for a large set of galaxies (e.g.: GHASP, GHFaS, ATLAS3D, SAMI; Epinat et al. 2008; Hernandez et al. 2008; Cappellari et al. 2011; Croom et al. 2012), these surveys have usually focused on the study of the kinematics of early-type systems (e.g.: SAURON, ATLAS3D; Emsellem et al. 2004; Krajnović et al. 2011) or on specific wavelength range like H range in spiral galaxies in different environments (e.g., GHASP, and GHFaS Fathi et al. 2009; Epinat et al. 2008).
The CALIFA survey (Sánchez et al. 2012) provides an unique opportunity to study simultaneously the stellar and ionised gas global kinematics in a sample of galaxies that covers a wide range of morphological types, stellar masses and environments. The spectral and spatial coverage provided by the CALIFA IFS data allow us to study the effect of structures such as bars in non-interacting galaxies on the global kinematics. Bars are frequent elliptical-like structures present in disk galaxies. About 4050 % of nearby disk galaxies observed in optical wavelengths show bars features (e.g., Marinova et al. 2007; Barazza et al. 2008; Aguerri et al. 2009). This fraction is even higher (about 6070 %) for near-infrared observations (e.g., Eskridge et al. 2000; Knapen et al. 2000; Menéndez-Delmestre et al. 2007). Hydrodynamical simulations of these systems show that the bar component contributes only between 10 and 20 % of the disk potential (e.g., Scannapieco et al. 2010), and yet it can produce important changes in the gas dynamics. Bars are thought to be very efficient in redistributing angular momentum, energy and mass in both luminous and dark matter components (e.g., Weinberg 1985; Debattista & Sellwood 1998, 2000; Athanassoula 2003; Martinez-Valpuesta et al. 2006; Sellwood 2006; Sellwood & Debattista 2006; Villa-Vargas et al. 2009). The effects of this angular momentum redistribution is different in gas and stars due to their different properties (e.g., Thielheim & Wolff 1982). For example, flows are observed within the co-rotation radius towards the galaxy centre only in the gas component (e.g., Rozas et al. 2002).
The aim of this paper is to characterize the stellar and the ionised gas kinematics for a sample of non-interacting galaxies by means of their global orientation. In a companion paper (Barrera-Ballesteros et al., in preparation) we will use the results of the present study to quantify how much the kinematic of a sample of interacting galaxies differentiates with respect to the kinematics of isolated ones. In other words, the result from this work will yield a yardstick describing kinematic distortions due to internal processes with which to compare to kinematic disturbances induced by major merger events.
The paper is organized as follows. In Section 2, we present the sample as well as the methods for extracting the stellar and ionised gas kinematics. The procedure used to derive directly the kinematic PA from the velocity maps is presented in Section 3. Section 4 presents the kinematic characterization of the non-interacting galaxies: morpho-kinematic and kinematic misalignments are compared against different bar strengths as well as at different radii of barred galaxies. The impact of bars in the velocity field is discussed in Section 5. Our findings and main conclusions are summarized in Section 6.
2 Sample and observations
2.1 Sample selection
The sample presented in this work is drawn from the CALIFA mother sample (Sánchez et al. 2012) observed until November 2013. This mother sample includes 939 galaxies, selected from the SDSS DR7 (Abazajian et al. 2009). The selection criteria is such that galaxies included are in the nearby Universe with redshifts 0.005 0.03 and their isophotal diameter in the SDSS -band is 45′′ 80′′.
Using the SDSS -band images of the observed galaxies we select 80 galaxies without evident signatures of interaction such as tidal tails, bridges, rings, shells or any other morphological distortion caused by a merging. Moreover, we consider galaxies isolated from companions within a physical radius of 250 kpc, a systemic velocity difference smaller than 1000 km s-1 and a difference in magnitude in the SDSS r-band images larger than 2 mag (position and systemic velocities were taken from NED111NASA/IPAC Extragalactic database. http://ned.ipac.caltech.edu/ ). We use a conservative physical radius for rejecting close companions with respect to pairs-survey criteria (e.g., Ellison et al. 2008). The systemic velocity selection criteria is supported by recent cosmological simulations (Moreno et al. 2013). Finally, we also selected those galaxies for which stellar and ionised gas signal-to-noise (S/N) ratios allow us a reliable estimation of their kinematic properties (see section 2.2).
It is important to note that these selection criteria does not exclude from our sample galaxies with minor companions or galaxies located in the outskirts of groups. However, we estimate the perturbation caused by tidal forces induced by companions by means of the f-value (Varela et al. 2004). Values larger than -2 are required to produce sizeable effects on a disk galaxy. We were able to measure in 71 objects the f-value. We found that 95% of these galaxies have f-values smaller than -2 with a mean value of -4.0. This suggests that our sample is a fairly representation of isolated galaxies. In fact, 10 galaxies from our sample are also part of the AMIGA sample (Analysis of the interstellar Medium of Isolated GAlaxies, Verdes-Montenegro et al. 2005, CALIFA id: 2, 30, 131, 152, 275, 743, 748, 777, 779, 856). AMIGA sample is defined based on strict isolation criteria, and shows different physical properties at all wavelengths studied so far than galaxies in denser environments (even field galaxies). These 10 galaxies are located in the region of lower tidal forces and number density of AMIGA full sample (Fig. 6 in Verley et al. (2007)).
Our non-interacting sample includes different morphological types, bar strengths and a relatively wide range of luminosities (-24 ; where is the absolute magnitude in SDSS -band). Morphological types and bar strengths were obtained by visual inspection of the SDSS -band images by different members of the collaboration (Walcher et al., in preparation, see also table 1). Even more, the sample is dominated by Sbs and Sc morphological types, which are also the dominant population of the AMIGA sample, hence characteristic of isolated galaxies. Finally, from a visual inspection of the velocity maps we exclude from our sample the early-type galaxy NGC 5623. This galaxy presents a stellar counter-rotating disk, presumably originated from an early encounter, and thus it will be included in the sample of interacting galaxies of Barrera-Ballesteros et al. (in prep.).

2.2 CALIFA velocity maps
Observations were carried out using the PPAK instrument at Calar Alto Observatory (Roth et al. 2005). Its main component consists of 331 fibers of 27 diameter each, concentrated in a single hexagon bundle covering a field-of-view of , with a filling factor of 60% . Three dithered pointings are taken for each object to reach a filling factor of 100% across the entire FoV. The final data cube consists of more than 4000 spectra at a sampling of per spaxel (see details in Husemann et al. 2013). The CALIFA survey has two spectral setups, V500 and V1200, low and intermediate resolution, respectively. Objects included in this work have been observed in the V500 setup. This setup has a nominal resolution of / 850 at 5000Å and its nominal wavelength range is 37457300Å.However, the final data cube has an homogenized spectral resolution (FWHM) over the entire wavelength range of 6.0Å and the wavelength sampling per spaxel is 2.0Å. The total exposure time per pointing is fixed for all the observed objects to 45 min. The data reduction is performed by a pipeline designed specifically for the CALIFA survey. Detailed reduction process is explained by Sánchez et al. (2012) and improvements on this pipeline are presented by Husemann et al. (2013).
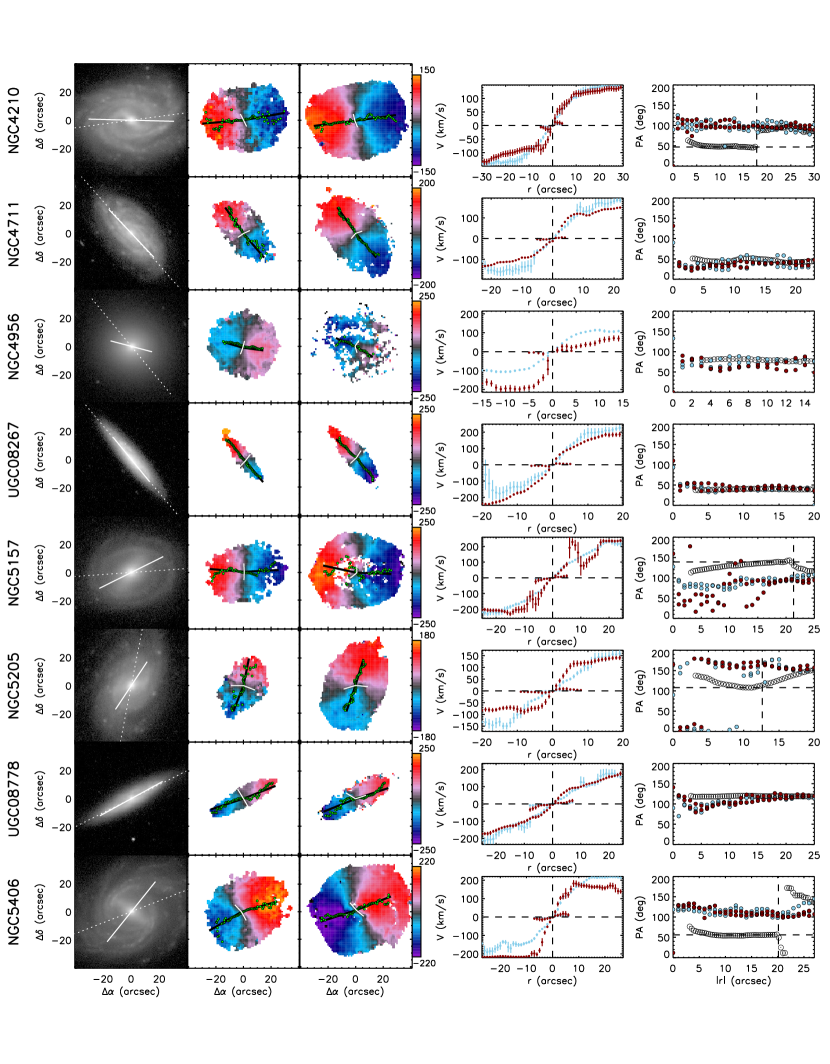
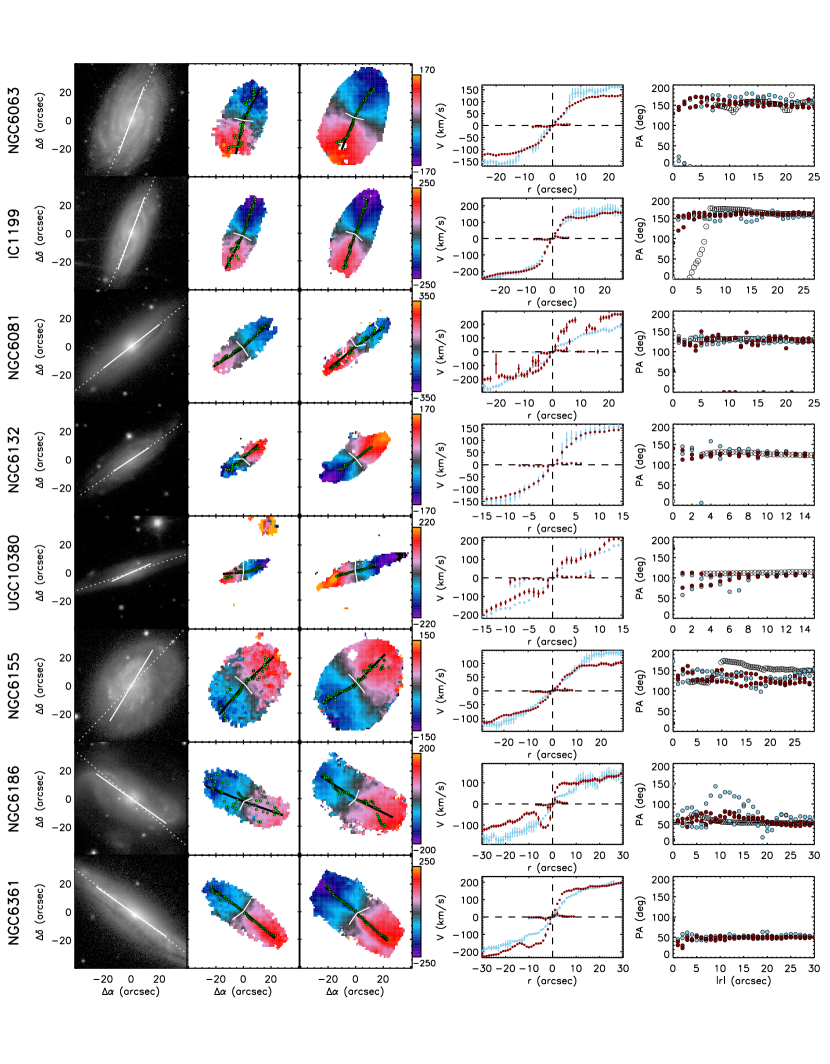
The stellar kinematic extraction method for the CALIFA survey will be presented in Falcón-Barroso et al. (in prep.). Here we highlight the main steps. Spaxels with continuum S/N 3 in the original V500 cube were considered unreliable and therefore not considered in further analysis. To achieve a minimum S/N of 20, we used a Voronoi-binning scheme for optical IFS data implemented by Cappellari & Copin (2003). We will refer to these Voronoi bins as “voxels”. From this selection in the continuum S/N, a large fraction of the voxels (80%) have the same size as the spaxels of the cube. The remaining fraction of the voxels are located in the outer regions of the galaxies and include a range between three or five spaxels. To derive the line-of-sight velocity maps, for each cube, a non-linear combination of a subset of stellar templates from the Indo-U.S. library (Valdes et al. 2004) is fit to each voxel using the penalized pixel-fitting method (pPXF, Cappellari & Emsellem 2004). Errors for each voxel, determined via Monte Carlo simulations, range from 5 to 20 km s-1 for inner to outer voxels, respectively. Note that these uncertainties are smaller than the spectral sampling per spaxels from the data cubes. Since each spaxel offers a wide range of absorption lines to fit its line-of-sight velocity, the spectral location of these absorption features can be determine even at scales smaller than the spectral sampling. Figure 1 (middle-left panel) shows an example of a stellar kinematic maps for one of our galaxies
The detailed description of the ionised-gas kinematic extraction method for the CALIFA survey is provided by García-Lorenzo et al. (2014, submitted). Briefly, to obtain the ionised-gas emission in each spaxel we subtracted the stellar continuum spectra derived from the best stellar pPXF fit in its corresponding voxel. No binning was done for the ionized gas. We assumed that the stellar populations in each voxel are rather smooth and do not change from spaxel to spaxel within each voxel. A cross-correlation (CC) method is used to measure the velocity of the ionised-gas (see García-Lorenzo 2013, for details on the method). The method compares the spectrum in each spaxel in a given wavelength range with a template that includes the H+[NII]6548,6584 emission lines (65086623Å). The template corresponds to a Gaussian model for each emission line in the given wavelength range, shifted to the systemic velocity reported in NED and assuming a velocity dispersion equals to the instrumental resolution ( 90 km s-1 at the H emission line). We selected spaxels with S/N 8 in this emission line for the ionised gas velocity maps. García-Lorenzo et al. (2014, submitted) present examples on the kinematic fitting per spaxel and the extraction of the ionized gas component. Fig. 1 (middle-right panel) shows an example of an ionised-gas velocity maps. Estimated uncertainties in the location of the maximum of the CC function are 10 km s-1. Both the pPXF and the CC methods are able to determine velocity dispersion maps however, due to the low spectra resolution of the V500 data we did not attempt any further analysis of these maps. They are also not required for the work presented here.
3 Kinematic position angles from velocity maps
Appendix C shows the complete set of stellar and ionised gas velocity maps for the galaxies in this study. Some of them are also presented in Falcón-Barroso et al. (in prep., for stellar kinematics in the V1200 setup) and García-Lorenzo et al. (2014, submitted for the ionised gas).
In the last years, several analytic methods have been developed to determine kinematic properties from two-dimensional velocity distributions. These models consider symmetric velocity distributions, either by assuming a thin disk geometry (e.g., Barnes & Sellwood 2003; Epinat et al. 2008), pure-circular motion on elliptical galaxies (Krajnović et al. 2006) or symmetrical radial distortions with respect to some axis (Spekkens & Sellwood 2007). Even though these methods yield good results for symmetric velocity maps, they may provide (depending on its use) biased or uncertain results for galaxies with strong departures from order motions.
The aim of this paper is to establish the observed (i.e., projected) typical ranges of kinematic parameters expected for non-interacting galaxies. From those kinematic values, we will be able to shade some light on the possible kinematic distortions induced by an interaction. For this reason, we provide in this study a quantitative characterization of the kinematics of galaxies through parameters derived directly from their stellar and ionised gas velocity distributions. No assumption on the behaviour of the galactic components is made. We will use the same method on our sample of interacting galaxies in order to make a consistent comparison. A pure-rotational velocity field can be caracterized by several parameters: kinematic centre, systemic velocity, global orientation of the field (i.e., kinematic PA), and its inclination with respect to the sky’s plane. In this study we restrict ourselves only to kinematic projected properties of the sample. We consider that an estimation of the inclination via the velocity distribution would require assuming an intrinsic behavior on the kinematic component (e.g., tilted-ring modeling, Józsa et al. 2007). Although, this could be the case of some of the non-interacting galaxies presented in this study (restricted even only to the nebular component), it might not be the case for highly asymmetric velocity fields, such as those exhibit by interacting/merging galaxies. In the work presented here we focus mainly on the characterzation of the velocity fields via their different components kinematic PAs.
In order to determine the global orientation of the velocity maps first it is necessary to set the kinematic centre. For an ideal pure rotating disk the kinematic centre should be at the position with the largest velocity gradient (or gradient peak, GP hereafter) and in agreement with optical nucleus. The reader is refered to García-Lorenzo et al. (2014, submitted) for details of the method used to determine the velocity gradient in the CALIFA ionized gas velocity fields. Briefly, in a region of centred in the optical nuclei we determine the velocity gradient in each spaxel with respect to the surrounding spaxels. Then, we select the positions where the velocity gradient is larger than its average inside this box. Finally, the GP is estimated from the weighted average location of the selected positions, using as weights the velocity gradient at each location.
For an observed velocity field the GP does not always coincided with the optical nucleus (ON hereafter). Taking the size of the original fiber as the minimum distance to report an offset between the GP and ON (i.e., 2.7). We find that a large fraction of the sample in their stellar component do not present a significant offset between these two positions (69/80) with a mean offset of 1.5 and standard deviation of 1.1 arcsecs. In the rest of the stellar velocity fields this offset is due to possible SNe in the central region (e.g., NGC 7478) or the possibility in barred galaxies that the GP is located at the end of bar (e.g. NGC 6004). The ionized gas present similar offsets (mean offset of 1.3 and standard deviation of 0.9 arcsecs). However the fraction of galaxies with small offsets is larger (74/80). The galaxies with large offsets are either edge on galaxies (e.g., UGC 841) or patchy in emission (e.g., NGC 4956). Finally, as kinematic centre we choose either ON or GP, depending on the best symmetry of the rotational curve (see details below). In all the cases with large offset in the GP (in both components) the ON yields a more symmetric velocity curve than the GP. This yield that in 21/80 and 5/80 velocity fields the ON was selected as the kinematic centre for the stellar and ionized gas components, respectively. As we note above most of the offsets are smaller than the original spatial resolution of the instrument, in particular, for the stellar component where spatial binning is done (although small for the nuclear region) this yield a larger number of fields where the ON was selected as kinematic centre. In tables 2 and 3 we list the gradient peak location with respect to the optical centre when the choice for the kinematic centre was the GP, and the systemic velocity derived for both components as the mean value within a 2.7 radius of the kinematic centre.

The major (projected) kinematic axis (PAkin, hereafter) provides a measurement of the global kinematic orientation. It can be determined directly from the positions of the spaxels defining the kinematic lines of nodes (Nicholson et al. 1992). In practice, we plot the radial velocity for all the spaxels up to a given radius in a position-velocity diagram centred in the kinematic centre previously assigned (see right panel of Fig. 1). We then choose those spaxels with the maximum (minimum) projected velocity at the receding (approaching) side at different radii. Finally, for each side, we identify the selected spaxels in the velocity map. The average of their polar coordinates provides an estimation of PAkin and their standard deviation (PAkin) measures the scatter of these points around the straight line defining the kinematic PA. Following a similar procedure, we also determine the minor (receding and approaching) kinematic PA by selecting the spaxels with the lowest velocity differences respect to the kinematic center. To compare the stellar and the ionised gas kinematic PA we pick the common maximum radius where both components can be measured. Although PAkin is usually defined as the angle between the north and the receding side of the velocity field (e.g., Schoenmakers et al. 1997), for the sake of homogeneity, we report the approaching and receding kinematic PAs independently (PAkin,app and PAkin,rec) between 0 and 180 degrees from North to East. Typical errors in PAkin and PAkin are of the order of 7 ∘ obtained from Monte Carlo simulations. We have also investigated the uncertainties introduced by the Voronoi binning in the stellar velocity maps (by artificially increasing the level of binning in a few of our galaxies) and established that they could bias the determination of PAkin at most 4∘.
In this study, for comparison, we also estimate the photometric orientations of the galaxies by fitting an ellipse model using the standard task ellipse of IRAF222 IRAF is distributed by the Optical Astronomy Observatory, which is operated by the Association of Universities for research in Astronomy (AURA) under cooperative agreement with the National Science Fundation on the isophotes of the SDSS -band image at two galactocentric distances: 1) at the same galactocentric distance where PAkin are derived (, see solid white line in left panel of Fig. 1) and 2) at the outer most isophotes of the image (PA, see dotted white line in left panel of Fig. 1). We use the ellipticity of the latter () as an homogeneous proxy for the inclination of the galaxies in our sample (see Table 1). All the position angles used in this work, as well as the radial distances where they have been computed, are presented in Tables 2 and 3.


4 Kinematic alignment of galaxies
4.1 Global morpho-kinematic misalignments
In Fig. 2 we show the morpho-kinematic PA misalignment (i.e., ) for the stellar and ionised-gas components (top and middle panels, respectively) against the total stellar mass of the galaxies (from Walcher et al., in preparation). Since there is no preference between the kinematic approaching and receding PA, both of them were compared with respect to . We do not find any trend between the stellar mass and the morpho-kinematic PA misalignment, in any component, for our sample of galaxies.
About 90% of the galaxies have morpho-kinematic misalignments smaller than 21(stellar)/ 22 (ionised gas) degrees. The mean misalignment and standard deviation are 0∘ and 10∘, respectively in both components. This indicates a global agreement between morphology and kinematics regardless the morphological type or bar strength. Barred galaxies present in both components the larger morpho-kinematic difference and the larger error bars (see tags in Fig. 2). On the one hand, larger differences in the stellar component are observed in IC 1683, NGC 5735, and NGC 171. For the two former galaxies the kinematic PA is similar to PA rather than . However of NGC 171 is not similar to any of the photometric PA presented here (see Fig. 4). On the other hand for the ionised component, NGC 3687 and NGC 5735 present dissagrements with the photometric and kinematic PA. Similarly as in the stellar component, this galaxies seems to be more aligned to PA than . In Sec. 4.3, we study the impact of deriving the kinematic PA at different radius, in particular for barred galaxies.
Krajnović et al. (2011) found that for 90% of the ATLAS3D galaxies displayed stellar morpho-kinematic misalignments smaller than 16∘ in their stellar component. From a sample of 24 early-type bulges, Falcón-Barroso et al. (2006) found that 80% showed stellar morpho-kinematic differences smaller than 20∘. Our results, based on a sample of non-interacting galaxies with a wide range of morphological types, are consistent with those findings. For the ionised-gas, the Fabry-Perot survey of late-type spirals and irregular galaxies, GHASP (Epinat et al. 2008), reported a 85% of the objects with morpho-kinematic misalignments smaller than 15∘. These results are also in agreement with our findings. Similar results have also been found for smaller samples (e.g. Kutdemir et al. 2008).
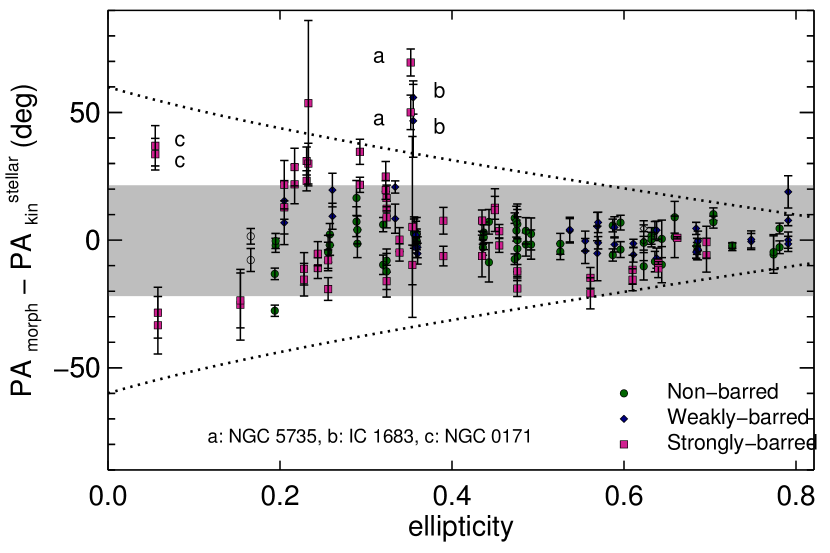
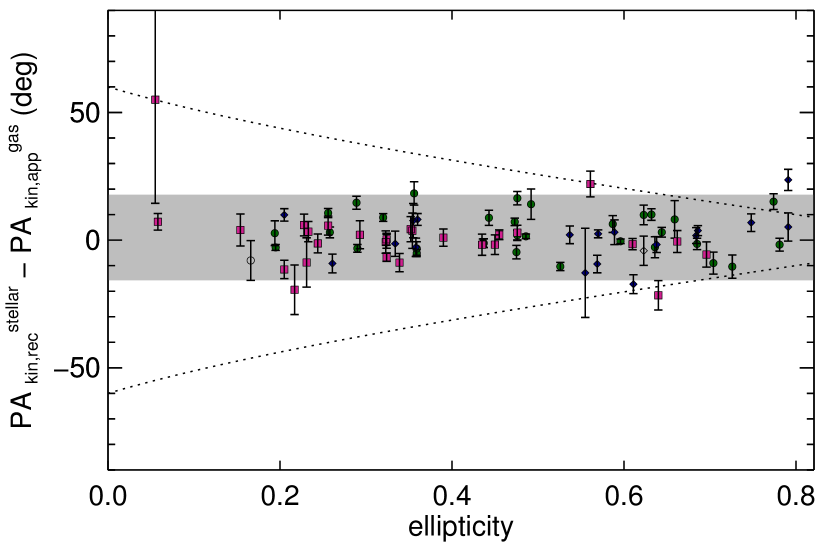
Although we present along this study projected kinematic properties of non-interacting galaxies, in Appendix A we study the possible impact of the inclination for the determination of kinematic properties. In Fig. 8 we plot the previous morpho-kinematic misalignments with respect to the photometric ellipticity as a proxy for the inclination (, see Sec. 3). As is expected, larger misalignments are found at low ellipticities whereas at high ellipticities the morpho-kinematic misalignements get reduced due to the projection effects. However, we suggest that even at low ellipticities this misalignments reduced significantly (see Sec. 4.3).
Our results suggest that for a non-interacting galaxy the misalignment between the photometric and global (stellar- and/or ionised gas-) kinematic orientation is small for a wide range of morphologies and stellar masses (smaller than 20∘, with a mean value of 0∘). This also held for galaxies with strict isolation critera (i.e., AMIGA subsample), where the average misalignment for these galaxies is 1∘ with a standard deviation of 8∘ and 5∘ for the stellar and ionized gas component, respectively. As we noted previously only a small fraction of galaxies (2/80, barred) show large morpho-kinematic misalignments.
In the bottom panel of Fig. 2 we show the difference between the stellar and ionised gas kinematic PA (i.e.). As in previous plots, we separate our sample according to their different bar strengths. In this stellar mass range, we do not find any trend. Barred and non-barred galaxies present similar alignments between their components. In fact, the mean difference for these components orientations is 1∘ with a standard deviation of 7∘. For 90% of the galaxies, the global orientation of the stellar and the ionised gas velocity fields agrees, with differences smaller than 16∘. The only galaxy that seems to present large kinematic misalignment between both components is the late-type barred galaxy NGC 171. The large uncertainties in the ionized gas component as well the fact that the locations of maximum velocity present a large deviation from a straight line in the gas component suggest that the strong bar is the driver that distorted the ionised gas velocity field. From the SDSS -band image, this object presents a bar as large as the FoV of the instrument with an extended ring. This is the only galaxy with these features in the sample presented here. In Fig. 10 we plot these misalignments respect to the ellipticity. For a wide range of inclinations the alignment between both components is consistent. Summarizing, our measurements reveal small morpho-kinematics misalignments for both component as well as small stellar versus gas kinematic misalignments for barred galaxies, comparable to those for non-barred galaxies. At the spatial and spectral resolution of CALIFA survey, both components thus seem to follow a similar kinematic pattern even in the presence of bars.
4.2 Internal kinematic PA misalignments
In Sec. 3 we estimated kinematic PA from the approaching and receding side as well as their departures from a straight line (, , , ). This allows us to study the internal kinematic misalignment, defined as , which should be zero for a regular rotational pattern. Figure 3 presents these misalignments for the stellar (left) and the ionised gas (right) components.
We find that 92% of the objects have internal kinematic misalignment smaller than 15∘ for both the stellar and the ionised gas. This is for different stellar masses and ellipticities (see Fig. 9). Assuming that our objects are a representative sample of isolated galaxies, we suggest that any distortion in the line-of-sight velocity distribution that produces a kinematic misalignment larger than those values is not caused by internal processes. The kinematic deviations from a straight line PAkin range from 5∘ to 40∘ in both components for a large fraction of the sample ( 90%). The mean value of these deviations is twice for the stellar component with respect to the ionized gas ( 15∘ and 7∘). Their standard deviation is also twice for stars respect to the stellar component ( 8∘ and 4∘, respectively). In Fig. 5(top-panel) we plot the distribution of PAkin for different barred strengths. The fact that the mean deviation of the stellar component is almost twice the deviation from the ionized gas could be explained by different factors. On the one hand, although we are allow to determine in each spaxel the stellar velocity with relatively small uncertainty, the change of velocity for joint spaxels could be smaller than the spectral resolution leading in a higher scatter in the positions of maximum velocity. On the other hand, the method used here to derived kinematic properties is entirely based on the symmetry that a pure rotational velocity field should display. Therefore, any deviation translates in a perturbation in any of the parameters we are using to quantify or velocity fields. Small PAkin in the ionized gas indicates that gas lies in a thin disk, while the stellar component present ’dynamical-heated’ structures (e.g., dynamical heated disk, pressure-supported bulge, etc).
As we mention above, the barred galaxy NGC 171 is the object where is more difficult to trace a symmetric velocity field in its ionised gas component (see Appendix C), the deviation of the maximmum-velocity positions from a straight line is of the order of PAkin 90∘. In Sec. 5, we discuss the possible relation of PAkin with the level of bar strength of the non-interacting galaxies.


4.3 Dependence on the measuring radius
In previous sections, to compare the PAkin of both components, we used the same distance to average the polar coordinates of positions defined by the lines of nodes (see Sec. 3). In our data, usually the stellar velocity map limits this distance where the average is done. For barred galaxies, it is similar (and a few times smaller) than half the length of the bar (see rbar in table 1 and r in tables 2 3). For the majority of the galaxies, the ionised gas extends further out for these galaxies. Our results could therefore be biased because of measuring the average kinematic orientation on a distance similar or close to the bar length.
To study the impact of this distance in the global orientation of the galaxies, we calculated the morpho-kinematic misalignments at different radii in a sub-sample of 49 low-inclined galaxies ( ). PAkin is computed up to two different radius, rout and rin (see table 4). The former defines the largest extension of the velocity map in any component. For barred galaxies rin defines the bar length, for non-barred galaxies we define it as half of the rout. PAkin(rout) is the average of the polar coordinates from rin to rout, while PAkin(rin) is the average from the kinematic centre up to rin.
Left panels of Fig. 4 show, for both components, the morpho-kinematic misalignment respect to the orientation of an ellipse at the outermost region of each galaxy (PA ).. Red symbols correspond to misalignments with PAkin(rin), while blue ones represent misalignments for PAkin(rout ). Note that in most of the cases PA is measured at larger radii than PAkin(rout). Right panels compare the difference between PAkin(rin) and PAkin(rout). Figure 4 evidences the similar alignment of the kinematic PA for different morphologies at the different measuring radius, rin and rout, in particular for barred galaxies. On the one hand, the comparison of kinematic PAs and PA (left panels) reveals that 90% of the objects have differences smaller than 16∘ (20∘) for the outer (inner) region in the stellar component. Differences became smaller for the ionised gas (13∘ and 20∘ for outer and inner regions, respectively). On the other hand, when we compare PAkin at the inner and outer radii (right panels), we find that 90% of the galaxies have differences smaller than 20∘ (16∘) for the stellar (ionised gas) component. These plots quantify what we observed in velocity fields; at different radii the orientation of the major kinematic PA remains rather constant. Moreover at different radii, PAkin seems to be aligned with the orientation of the major photometric axis rather than other morphological local features such as bars. We find one outlier in both components: the strongly barred late-type galaxy (NGC 171). This galaxy presents the smallest ellipticity in the sample (see Fig. 8), making difficult to determine a reliable estimation of PA. From these morpho-kinematic differences as well as the differences presented in Sections 4.1 and 4.2 we suggest that for this sample of non-interacting galaxies, the stars and the ionised gas follow the potential of the disk.

5 The impact of bars in velocity maps
Simultaneous comparisons of the stellar and ionised gas resolved kinematics in barred galaxies are rather scarce. Falcón-Barroso et al. (2006) studied those cases found in a sample of 24 spiral bulges. The sample included nine barred galaxies. Kinematic misalignments between the two components for these galaxies ranged from 1∘ to 38∘. A subsequent detailed study of the galaxy NGC 5448 (Fathi et al. 2005) revealed a kinematic misalignment between these two components of 25∘. These differences are explained by the fact that the morphological PA of the galaxies was measured within the same FoV probed by their kinematics (i.e. the inner regions of those galaxies). The PAmorph in those cases are thus biased due to the bar. Throughout this study we find that the global kinematic orientation (measured by the major-axis kinematic PA) for the stellar and the ionised gas are aligned for non-interacting objects in the CALIFA survey (see Fig. 2 and 3). This result appears to hold at different radial lengths of the galaxies (Fig. 4), even for barred galaxies. To quantify the departures from perfect axisymmetry in the global kinematic orientation, we plot in top panels of Fig. 5 histograms showing the deviations from a perfect straight line observed in the stellar and ionised-gas kinematic maps (PA, PA). As we already note in Sec. 4.2 the mean value of these deviations is larger for the stellar component in comparison to the ionized gas. For both components the strongly barred galaxies present slightly larger values respect to the non-barred galaxies. In particular the ionised gas component presents a difference between the distribution of barred and non-barred galaxies. This suggest that although the global kinematic orientation is stable in non-interacting galaxies, in particular for barred galaxies, some other kinematic parameters such as PA (at higher spatial and spectral resolution as the present velocity fields ) can be sensitive to the presence of strong bars.

It is important to note that there is still a fair fraction of strongly barred systems with PAkin consistent with those observed in non-barred galaxies. We have investigated whether this effect is caused by the flattening of the galaxy,or due to the relative orientation of the bar with respect to the disk major axis. This is shown in the middle and lower panels of Fig. 5. The projected deviation of the kinemtic PA (PAkin) seems to grow at lower apparent flattening of the galaxy (as a surrogate for inclination). This trend is particular clear for barred galaxies, it may be induced by projections effects. Using the method presented in this study, any kinematic deviation from a straight line would be more easily quantified in a nearly face-on velocity field than in the same field viewed as edge-on. For high inclined galaxies with large kinematic deviations, we may even trace vertical motions rather than radial deviation from a circular velocity field. Note however that other kinematic indicators such as the intrinsic kinematic misalignment do not present a clear trend respect to the ellipticity (see Appendix A). As for the orientation of the bar with respect to the disk major axis, the kinematic deviations covers a wide range of values for a given alignment between the bar and disk orientation, indicating that at least for barred galaxies the orientation of the bar with respect to the disk may not affect drastically the scatter in the location of maximum velocities.
The velocity maps of barred galaxies often show, however, clear signatures of
perturbations from a symmetric velocity field (e.g.,
Hernandez et al. 2005; Fathi et al. 2009). A characteristic “S”-shape in
the zero-velocity curve is observed in several of these ionised gas kinematic
maps (e.g., Peterson & Huntley 1980; García-Barreto & Rosado 2001; Emsellem et al. 2006). For a pure rotating disk galaxy the major and minor axis are perpendicular everywhere (Binney & Merrifield 1998). To account for the distortion in the zero-curve velocity we estimate the difference between the above kinematic PAs. For each low-inclined galaxy ( 0.5) we estimate the largest departure among the four kinematic PAs (approaching and receding major PAs and their corresponding minor PAs). 0∘ represents perpendicularity between major and minor axes. In Fig. 6 we represent these departures against the stellar mass (left panels) and the photometric alignment of the bar respect to the disk for barred galaxies (right panels) for the stellar (top panels) and nebular components (bottom panels). For the stellar component, almost all the low-inclined galaxies present differences smaller than 30∘ except for the barred galaxy NGC 6155. Even more, strongly-barred galaxies spread homogeneously in this range as the non-barred objects. The average departure between strongly and non barred galaxies is similar (11∘ and 15∘, respectively). The ionised gas component display a wide range of differences between the major and minor kinematic PAs. In particular, strongly-barred galaxies present a wider range of differences than non-barred sample. The average of this difference for the barred galaxies is larger (24∘) respect to the unbarred galaxies (15∘). According to numerical simulations, the difference between the major and minor kinematic PA is best seen in velocity fields where the bar makes an angle of 45∘ with the major axis of the galaxy (e.g., Athanassoula 1984; Scannapieco & Athanassoula 2012). Due to the moderate sub-sample of barred galaxies in this study and the rather large uncertainty in determine the minor kinematic PA, it is not clear weather larger differences in the kinematic PAs are observed at this specific angle between the bar and the disk PA. Note however, that for the stellar component an increment in this difference seems to be present at PAdisk - PAbar 50∘. In the ionised gas, for a given morphological alignment between the bar and the disk we find a broad range of differences between the major and minor kinematic PA. Given the spectral and spatial resolution in our velocities distributions, we consider that the difference between the major and minor kinematic PAs is a sensitive indicator of the presence of a bar in particular for the ionised gas component. Detailed individual studies are required in order to explain the shape and length of the distortion in this velocity curve as well as to determine if the ionized gas is more sensitive component to the bar potential. These issues are beyond the scope of this study, however our results motivate numerical simulations to address the nature of the kinematics in non-interacting galaxies. As opposed to the previous kinematic indicators (see Fig. 2 and 3) this indicator of kinematic distortion varies significantly for non-interacting galaxies making difficult to use it as a discriminator to distinguish the kinematic distortion produced by the merging event or a secular process.
6 Conclusions
We have studied the stellar and ionised-gas kinematics for a sample of 80 non-interacting galaxies in the CALIFA survey. The fraction of barred and non-barred objects in this sample is similar. We find that for 90% of the sample the global orientation of the stellar and ionised gas is fairly aligned (misalignment smaller than 20∘) with respect to the global photometric orientation of the galaxy, including barred and non-barred objects. From the method used to measure the major kinematic PA we study the internal kinematic PA misalignments namely, the difference between the receding and approaching kinematic PA. We find intrinsic aligned velocity fields in both components for a large fraction of the sample (intrinsic misalignments smaller than 15∘ degrees for the stellar and the ionised gas components).
We also compared the derived kinematic PA for the stellar and the ionised gas components. We observe a tight alignment (16∘ degrees of difference) between both components for the majority of this non-interacting sample. This result holds even in barred galaxies when the comparison is carried out either at the radius of the bar or further out, the radius of the disk. From these results we suggest that the global kinematics in non-interacting galaxies in both the stellar and the ionised gas components (measured by the major kinematic position angle) seems to be dominated by the mass of the disk, rather than other morphological component that can induce non-circular patterns in the observed velocity fields such as bars. Even though locally bars can redistribute the angular momentum, energy and mass; the global kinematic pattern that dominates across the galactic disk -including the bar- is consistent with a regular rotational pattern.
We will use the results presented in this paper to gauge the kinematic distortions caused by external forces in galaxies that undergo a merger event in Barrera-Ballesteros et al. (in prep.).
Acknowledgements
We thank the referee for a thorough reading of this work and his/her comments and suggestions. We also thank Lindsay Holmes for allow us to use her DiskFit kinematic modelling for comparison with our results. This study makes use of the data provided by the Calar Alto Legacy Field Area (CALIFA) survey (http://www.califa.caha.es). Based on observations collected at the Centro Astronómico Hispano Alemán (CAHA) at Calar Alto, operated jointly by the Max-Planck-Institut für Astronomie and the Instituto de Astrofísica de Andalucia (CSIC). CALIFA is the first legacy survey performed at the Calar Alto. The CALIFA collaboration would like to thank to the IAA-CSIC and MPIA-MPG as major partners of the observatory, and CAHA itself, for the unique access to the telescope time and support in manpower and infrastructures. The CALIFA collaboration also thanks the CAHA staff for the dedication to this project. J. B.-B. and B. G.-L. thank the support from the Plan Nacional de I+D+i (PNAYA) funding programs (AYA2012-39408-C02-02) of Spanish Ministry of Economy and Competitiveness (MINECO). J. F.-B. acknowledges support from the Ramón y Cajal Program, grants AYA2010-21322-C03-02 from the Spanish Ministry of Economy and Competitiveness (MINECO). We also acknowledge support from the FP7 Marie Curie Actions of the European Commission, via the Initial Training Network DAGAL under REA grant agreement number 289313. R.A.M is funded by the Spanish program of International Campus of Excellence Moncloa (CEI). L. V. M. acknowledges support from the Grant AYA2011-30491-C02-01 co-financed by MICINN and FEDER funds, and the Junta de Andalucia (Spain) grants P08-FQM-4205 and TIC-114. J.I.P. acknowledges financial support from the Spanish MINECO under grant AYA2010-21887-C04-01 and from Junta de Andalucía Excellence Project PEX2011-FQM7058. J.M.A. acknowledges support from the European Research Council Starting Grant (SEDmorph; P.I. V. Wild)
References
- Abazajian et al. (2009) Abazajian, K. N., Adelman-McCarthy, J. K., Agüeros, M. A., et al. 2009, ApJS, 182, 543
- Aguerri et al. (2009) Aguerri, J. A. L., Méndez-Abreu, J., & Corsini, E. M. 2009, A&A, 495, 491
- Athanassoula (1984) Athanassoula, E. 1984, Phys. Rep, 114, 319
- Athanassoula (2003) Athanassoula, E. 2003, MNRAS, 341, 1179
- Barazza et al. (2008) Barazza, F. D., Jogee, S., & Marinova, I. 2008, ApJ, 675, 1194
- Barnes & Sellwood (2003) Barnes, E. I. & Sellwood, J. A. 2003, AJ, 125, 1164
- Binney & Merrifield (1998) Binney, J. & Merrifield, M. 1998, Galactic Astronomy
- Binney & Tremaine (2008) Binney, J. & Tremaine, S. 2008, Galactic Dynamics: Second Edition (Princeton University Press)
- Cappellari & Copin (2003) Cappellari, M. & Copin, Y. 2003, MNRAS, 342, 345
- Cappellari & Emsellem (2004) Cappellari, M. & Emsellem, E. 2004, PASP, 116, 138
- Cappellari et al. (2011) Cappellari, M., Emsellem, E., Krajnović, D., et al. 2011, MNRAS, 413, 813
- Croom et al. (2012) Croom, S. M., Lawrence, J. S., Bland-Hawthorn, J., et al. 2012, MNRAS, 421, 872
- Debattista & Sellwood (1998) Debattista, V. P. & Sellwood, J. A. 1998, ApJ, 493, L5
- Debattista & Sellwood (2000) Debattista, V. P. & Sellwood, J. A. 2000, ApJ, 543, 704
- Ellison et al. (2008) Ellison, S. L., Patton, D. R., Simard, L., & McConnachie, A. W. 2008, AJ, 135, 1877
- Emsellem et al. (2004) Emsellem, E., Cappellari, M., Peletier, R. F., et al. 2004, MNRAS, 352, 721
- Emsellem et al. (2006) Emsellem, E., Fathi, K., Wozniak, H., et al. 2006, MNRAS, 365, 367
- Epinat et al. (2008) Epinat, B., Amram, P., Marcelin, M., et al. 2008, MNRAS, 388, 500
- Eskridge et al. (2000) Eskridge, P. B., Frogel, J. A., Pogge, R. W., et al. 2000, AJ, 119, 536
- Falcón-Barroso et al. (2006) Falcón-Barroso, J., Bacon, R., Bureau, M., et al. 2006, MNRAS, 369, 529
- Fathi et al. (2009) Fathi, K., Beckman, J. E., Piñol-Ferrer, N., et al. 2009, ApJ, 704, 1657
- Fathi et al. (2005) Fathi, K., van de Ven, G., Peletier, R. F., et al. 2005, MNRAS, 364, 773
- García-Barreto & Rosado (2001) García-Barreto, J. A. & Rosado, M. 2001, AJ, 121, 2540
- García-Lorenzo (2013) García-Lorenzo, B. 2013, MNRAS, 534
- Hernandez et al. (2005) Hernandez, O., Carignan, C., Amram, P., Chemin, L., & Daigle, O. 2005, MNRAS, 360, 1201
- Hernandez et al. (2008) Hernandez, O., Fathi, K., Carignan, C., et al. 2008, PASP, 120, 665
- Husemann et al. (2013) Husemann, B., Jahnke, K., Sánchez, S. F., et al. 2013, åp, 549, A87
- Józsa et al. (2007) Józsa, G. I. G., Kenn, F., Klein, U., & Oosterloo, T. A. 2007, A&A, 468, 731
- Knapen et al. (2000) Knapen, J. H., Shlosman, I., & Peletier, R. F. 2000, ApJ, 529, 93
- Krajnović et al. (2006) Krajnović, D., Cappellari, M., de Zeeuw, P. T., & Copin, Y. 2006, MNRAS, 366, 787
- Krajnović et al. (2011) Krajnović, D., Emsellem, E., Cappellari, M., et al. 2011, MNRAS, 414, 2923
- Kronberger et al. (2008) Kronberger, T., Kapferer, W., Unterguggenberger, S., Schindler, S., & Ziegler, B. L. 2008, A&A, 483, 783
- Kutdemir et al. (2008) Kutdemir, E., Ziegler, B. L., Peletier, R. F., et al. 2008, A&A, 488, 117
- Marinova et al. (2007) Marinova, I., Jogee, S., Bacon, D., et al. 2007, in Bulletin of the American Astronomical Society, Vol. 39, American Astronomical Society Meeting Abstracts, 905
- Martinez-Valpuesta et al. (2006) Martinez-Valpuesta, I., Shlosman, I., & Heller, C. 2006, ApJ, 637, 214
- Menéndez-Delmestre et al. (2007) Menéndez-Delmestre, K., Sheth, K., Schinnerer, E., Jarrett, T. H., & Scoville, N. Z. 2007, ApJ, 657, 790
- Moreno et al. (2013) Moreno, J., Bluck, A. F. L., Ellison, S. L., et al. 2013, MNRAS
- Naab & Burkert (2003) Naab, T. & Burkert, A. 2003, ApJ, 597, 893
- Nicholson et al. (1992) Nicholson, R. A., Bland-Hawthorn, J., & Taylor, K. 1992, ApJ, 387, 503
- Peterson & Huntley (1980) Peterson, C. J. & Huntley, J. M. 1980, ApJ, 242, 913
- Roth et al. (2005) Roth, M. M., Kelz, A., Fechner, T., et al. 2005, PASP, 117, 620
- Rozas et al. (2002) Rozas, M., Relaño, M., Zurita, A., & Beckman, J. E. 2002, A&A, 386, 42
- Sánchez et al. (2012) Sánchez, S. F., Kennicutt, R. C., Gil de Paz, A., et al. 2012, åp, 538, A8
- Scannapieco & Athanassoula (2012) Scannapieco, C. & Athanassoula, E. 2012, MNRAS, 425, L10
- Scannapieco et al. (2010) Scannapieco, C., Gadotti, D. A., Jonsson, P., & White, S. D. M. 2010, MNRAS, 407, L41
- Schoenmakers et al. (1997) Schoenmakers, R. H. M., Franx, M., & de Zeeuw, P. T. 1997, MNRAS, 292, 349
- Sellwood (2006) Sellwood, J. A. 2006, ApJ, 637, 567
- Sellwood (2013) Sellwood, J. A. 2013, Dynamics of Disks and Warps, ed. T. D. Oswalt & G. Gilmore, 923
- Sellwood & Debattista (2006) Sellwood, J. A. & Debattista, V. P. 2006, ApJ, 639, 868
- Sofue & Rubin (2001) Sofue, Y. & Rubin, V. 2001, ARA&A, 39, 137
- Spekkens & Sellwood (2007) Spekkens, K. & Sellwood, J. A. 2007, ApJ, 664, 204
- Thielheim & Wolff (1982) Thielheim, K. O. & Wolff, H. 1982, MNRAS, 199, 151
- Valdes et al. (2004) Valdes, F., Gupta, R., Rose, J. A., Singh, H. P., & Bell, D. J. 2004, ApJS, 152, 251
- Varela et al. (2004) Varela, J., Moles, M., Márquez, I., et al. 2004, A&A, 420, 873
- Verdes-Montenegro et al. (2005) Verdes-Montenegro, L., Sulentic, J., Lisenfeld, U., et al. 2005, A&A, 436, 443
- Verley et al. (2007) Verley, S., Leon, S., Verdes-Montenegro, L., et al. 2007, A&A, 472, 121
- Villa-Vargas et al. (2009) Villa-Vargas, J., Shlosman, I., & Heller, C. 2009, ApJ, 707, 218
- Weinberg (1985) Weinberg, M. D. 1985, MNRAS, 213, 451
Appendix A Kinematic alignments versus apparent ellipticity
All the kinematic parameters presented in this study are determined on the plane of the sky. Therefore, it is expected that any intrinsic kinematic property would be affected by the inclination of the galaxy with respect to the plane of the sky. In this appendix we show the same kinematic misalignments presented in section 4 with respect to the apparent ellipticity as proxy of the apparent inclination of the galaxies.
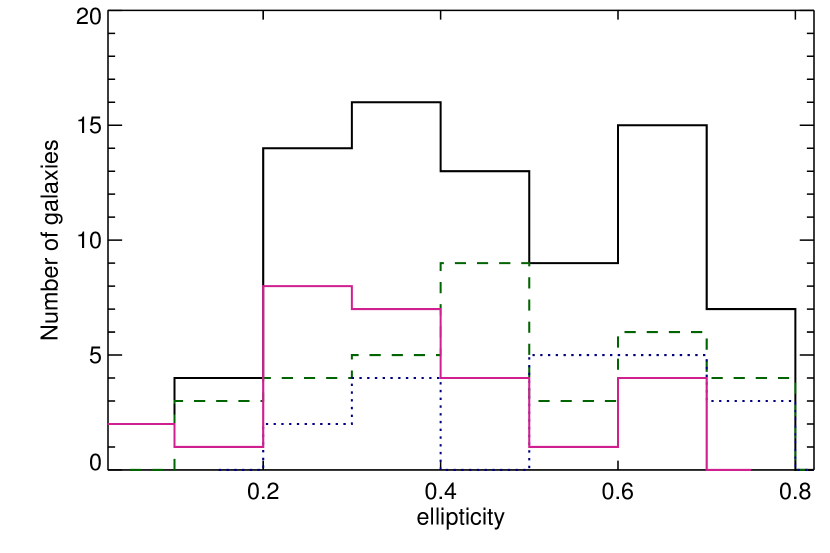
In Figure 7 we plot the distribution of the non-interacting galaxies with respect to the ellipticity. We have a fair coverage of galaxies at different inclinations , in particular for the low-inclined ones ( ¡ 0.5). In order to have consistent results, we also try to have the same fraction of barred vs unbarred galaxies at different ellipticity bins.
In Figure 8 we plot the morpho-kinematic misalignments explained in section 4.1 against the ellipticity for both components as well as the internal kinematic misalignment in each component ( Fig. 9) and the comparison of the kinematic PA between the stars and the gas ( Fig. 10). We find large morpho-kinematic misalignments in galaxies with low ellipticities ( ¡ 0.3, see Fig. 8).
For the kinematic parameters independent of the morphology (i.e., Figs. 9 and 10), we find rather similar values at different ellipticity bins. In each panel of these figures we plot an estimation of the projections effects as function of the ellipticity assuming a face-on misalignment of 60∘ (see Fig. 8) in any of the (morpho-) kinematic indicators. This value was chosen to approximately match the misalignments found at large ellipticities. Within uncertainties all the galaxies display internal kinematic misalignments smaller as the ones expected for their inclinations. In other words for these misalignments we do not find large scatters at low ellipticities as expected for a quantity heavily affected by projection effects.


Appendix B Tables
| CALIFA id | Name | Morphological | Bar | PA | PAbar | rbar | Stellar mass | |
|---|---|---|---|---|---|---|---|---|
| type | strength | (∘) | (∘) | (arcsec) | log(M/M⊙) | |||
| (1) | (2) | (3) | (4) | (5) | (6) | (7) | (8) | (9) |
| 1 | IC5376 | Sb | A | 0.69 | 50 | … | … | 10.57 |
| 2 | UGC00005 | Sbc | A | 0.53 | 50 | … | … | 10.72 |
| 7 | UGC00036 | Sab | AB | 0.61 | 50 | … | … | 10.88 |
| 8 | NGC0001 | Sbc | A | 0.32 | 50 | … | … | 10.71 |
| 10 | NGC0036 | Sb | B | 0.48 | 50 | 128 | 12 | 10.79 |
| 23 | NGC0171 | Sb | B | 0.05 | 50 | 122 | 33 | 10.62 |
| 25 | NGC0180 | Sb | B | 0.34 | 50 | 147 | 22 | 10.78 |
| 28 | NGC0214 | Sbc | AB | 0.26 | 50 | 59 | 14 | 10.74 |
| 30 | NGC0237 | Sc | B | 0.32 | 50 | 40 | 7 | 10.17 |
| 31 | NGC0234 | Sc | AB | 0.20 | 50 | … | … | 10.55 |
| 33 | NGC0257 | Sc | A | 0.36 | 50 | … | … | 10.69 |
| 41 | UGC00841 | Sbc | A | 0.77 | 50 | … | … | 9.71 |
| 43 | IC1683 | Sb | AB | 0.35 | 50 | 168 | 8 | 10.43 |
| 53 | UGC01057 | Sc | AB | 0.69 | 50 | … | … | 10.11 |
| 108 | NGC1093 | Sbc | B | 0.39 | 50 | 117 | 10 | 10.66 |
| 116 | UGC02405 | Sbc | A | 0.66 | 50 | … | … | 10.40 |
| 131 | NGC1542 | Sab | AB | 0.59 | 50 | … | … | 10.30 |
| 147 | NGC2253 | Sbc | B | 0.32 | 50 | … | … | 10.37 |
| 149 | NGC2347 | Sbc | AB | 0.36 | 50 | … | … | 10.62 |
| 151 | NGC2410 | Sb | AB | 0.68 | 50 | … | … | 10.78 |
| 152 | UGC03944 | Sbc | AB | 0.57 | 50 | 94 | 5 | 9.87 |
| 153 | UGC03969 | Sb | A | 0.78 | 50 | … | … | 10.61 |
| 273 | IC2487 | Sc | AB | 0.79 | 50 | … | … | 10.29 |
| 275 | NGC2906 | Sbc | A | 0.44 | 50 | … | … | 10.29 |
| 277 | NGC2916 | Sbc | A | 0.36 | 50 | … | … | 10.65 |
| 307 | UGC05359 | Sb | B | 0.70 | 50 | … | … | 10.54 |
| 364 | UGC06036 | Sa | A | 0.73 | 50 | … | … | 11.09 |
| 386 | UGC06312 | Sab | A | 0.64 | 50 | … | … | 10.93 |
| 414 | NGC3687 | Sb | B | 0.06 | 50 | 174 | 14 | 10.17 |
| 436 | NGC3811 | Sbc | B | 0.23 | 50 | 22 | 24 | 10.34 |
| 489 | NGC4047 | Sbc | A | 0.26 | 50 | … | … | 10.58 |
| 515 | NGC4185 | Sbc | AB | 0.33 | 50 | 167 | 20 | 10.61 |
| 518 | NGC4210 | Sb | B | 0.24 | 50 | 47 | 17 | 10.17 |
| 580 | NGC4711 | Sbc | A | 0.47 | 50 | … | … | 10.20 |
| 602 | NGC4956 | E1 | A | 0.17 | 50 | … | … | 10.99 |
| 610 | UGC08267 | Sb | AB | 0.75 | 50 | … | … | 10.68 |
| 624 | NGC5157 | Sab | B | 0.23 | 50 | 138 | 21 | 11.15 |
| 630 | NGC5205 | Sbc | B | 0.35 | 50 | 108 | 12 | 9.77 |
| 664 | UGC08778 | Sb | A | 0.70 | 50 | … | … | 10.15 |
| 684 | NGC5406 | Sb | B | 0.29 | 50 | 56 | 20 | 11.09 |
| 714 | UGC09067 | Sbc | AB | 0.54 | 50 | 27 | 5 | 10.36 |
| 715 | NGC5520 | Sbc | A | 0.49 | 50 | … | … | 9.75 |
| 743 | NGC5622 | Sbc | A | 0.48 | 50 | … | … | 10.11 |
| 748 | NGC5633 | Sbc | A | 0.26 | 50 | … | … | 10.16 |
| 753 | NGC5656 | Sb | A | 0.19 | 50 | … | … | 10.51 |
| 764 | NGC5720 | Sbc | B | 0.44 | 50 | 60 | 7 | 10.74 |
| 768 | NGC5732 | Sbc | A | 0.48 | 50 | … | … | 9.83 |
| 771 | NGC5735 | Sbc | B | 0.35 | 50 | 94 | 20 | 10.28 |
| 777 | NGC5772 | Sab | A | 0.44 | 50 | … | … | 10.84 |
| 779 | UGC09598 | Sbc | AB | 0.64 | 50 | … | … | 10.45 |
| 782 | UGC09629 | E7 | AB | 0.62 | 50 | … | … | 11.02 |
| CALIFA id | Name | Morphological | Barredness | PA | PAbar | rbar | Stellar mass | |
|---|---|---|---|---|---|---|---|---|
| type | (∘) | (∘) | (arcsec) | log(M/M⊙) | ||||
| (1) | (2) | (3) | (4) | (5) | (6) | (7) | (8) | (9) |
| 790 | UGC09777 | Sbc | A | 0.49 | 50 | … | … | 10.21 |
| 791 | NGC5908 | Sa | A | 0.36 | 50 | … | … | 11.12 |
| 804 | NGC5971 | Sb | AB | 0.56 | 50 | … | … | 10.22 |
| 810 | NGC5980 | Sbc | A | 0.60 | 50 | … | … | 10.62 |
| 813 | NGC6004 | Sbc | B | 0.20 | 50 | 15 | 16 | 10.60 |
| 823 | NGC6063 | Sbc | A | 0.44 | 50 | … | … | 9.95 |
| 824 | IC1199 | Sb | AB | 0.57 | 50 | … | … | 10.20 |
| 826 | NGC6081 | S0a | A | 0.59 | 50 | … | … | 11.04 |
| 831 | NGC6132 | Sbc | A | 0.64 | 50 | … | … | 10.15 |
| 834 | UGC10380 | Sb | AB | 0.79 | 50 | … | … | 10.92 |
| 836 | NGC6155 | Sc | A | 0.29 | 50 | … | … | 10.01 |
| 842 | NGC6186 | Sb | B | 0.23 | 50 | 54 | 35 | 10.44 |
| 853 | NGC6361 | Sab | A | 0.29 | 50 | … | … | 10.81 |
| 854 | UGC10811 | Sb | B | 0.66 | 50 | … | … | 10.75 |
| 856 | IC1256 | Sb | AB | 0.36 | 50 | 130 | 7 | 10.20 |
| 857 | NGC6394 | Sbc | B | 0.64 | 50 | … | … | 10.79 |
| 862 | NGC6478 | Sc | A | 0.63 | 50 | … | … | 10.90 |
| 869 | NGC6941 | Sb | B | 0.26 | 50 | 108 | 16 | 10.82 |
| 872 | UGC11649 | Sab | B | 0.22 | 50 | 162 | 17 | 10.54 |
| 876 | NGC7047 | Sbc | B | 0.45 | 50 | 115 | 20 | 10.68 |
| 886 | NGC7311 | Sa | A | 0.47 | 50 | … | … | 10.84 |
| 887 | NGC7321 | Sbc | B | 0.32 | 50 | 62 | 10 | 10.69 |
| 889 | NGC7364 | Sab | A | 0.32 | 50 | … | … | 10.79 |
| 890 | UGC12185 | Sb | B | 0.56 | 50 | 139 | 22 | 10.58 |
| 896 | NGC7466 | Sbc | A | 0.62 | 50 | … | … | 10.70 |
| 904 | NGC7591 | Sbc | B | 0.46 | 50 | 1 | 11 | 10.64 |
| 924 | NGC7716 | Sb | A | 0.19 | 50 | … | … | 10.20 |
| 929 | UGC12810 | Sbc | B | 0.61 | 50 | … | … | 10.61 |
| 938 | NGC5947 | Sbc | B | 0.15 | 50 | 26 | 11 | 10.23 |
| id | Vsys | rmax | rmin | PAmorph (rmax) | PA approaching | PA receding | ||||
|---|---|---|---|---|---|---|---|---|---|---|
| PAkin | PAkin | PAkin | PAkin | |||||||
| (arcsec) | (arcsec) | (km s-1) | (arcsec) | (arcsec) | (∘) | (∘) | (∘) | (∘) | (∘) | |
| (1) | (2) | (3) | (4) | (5) | (6) | (7) | (8) | (9) | (10) | (11) |
| 1 | 0.6 0.6 | 1.7 0.5 | 4963 9 | 22 | – | 3.7 0.4 | 6.0 3.3 | 7.1 2.2 | 8.2 3.2 | 8.0 1.8 |
| 2 | … | … | 7209 1 | 22 | – | 45.2 0.9 | 49.9 2.7 | 10.5 2.7 | 45.0 0.2 | 15.2 2.7 |
| 7 | … | … | 6238 1 | 20 | – | 17.4 0.2 | 22.7 2.8 | 10.7 2.3 | 18.8 1.6 | 7.3 1.8 |
| 8 | -0.6 0.5 | -1.1 0.6 | 4515 9 | 20 | 7 | 106.0 1.1 | 114.6 4.2 | 15.0 4.9 | 118.2 6.2 | 20.1 3.7 |
| 10 | … | … | 5939 1 | 25 | 10 | 179.3 0.6 | 19.4 2.7 | 14.4 2.1 | 12.0 2.3 | 12.7 2.4 |
| 23 | 0.4 0.5 | -1.0 0.6 | 3857 1 | 20 | 10 | 126.0 0.7 | 88.8 7.2 | 29.2 7.6 | 92.0 4.9 | 37.9 10.2 |
| 25 | 0.4 0.5 | -0.7 0.4 | 5204 6 | 30 | 7 | 167.1 1.0 | 168.1 4.0 | 18.7 3.0 | 172.0 3.8 | 18.0 3.4 |
| 28 | 0.2 0.5 | 0.2 0.7 | 4500 12 | 12 | 5 | 60.4 0.8 | 51.3 5.4 | 12.7 4.7 | 40.2 6.3 | 18.0 4.9 |
| 30 | … | … | 4142 1 | 20 | 7 | 177.3 0.8 | 17.0 5.8 | 24.3 5.8 | 165.3 5.2 | 30.6 7.4 |
| 31 | 1.9 0.7 | -1.1 0.8 | 4391 6 | 30 | 5 | 82.2 4.9 | 66.5 7.3 | 37.6 5.5 | 76.4 6.7 | 30.3 9.4 |
| 33 | -1.1 0.7 | 1.2 0.8 | 5183 12 | 20 | 7 | 93.7 1.5 | 91.0 6.3 | 25.7 5.6 | 94.4 4.8 | 25.8 7.6 |
| 41 | 1.3 0.5 | -1.4 0.6 | 5524 9 | 15 | – | 53.9 0.2 | 58.6 7.1 | 37.8 9.9 | 60.3 5.1 | 25.4 7.5 |
| 43 | … | … | 4839 9 | 12 | 7 | 156.4 1.0 | 19.0 9.7 | 20.4 8.1 | 31.8 7.2 | 19.4 6.4 |
| 53 | -0.8 0.5 | 0.1 0.6 | 6294 12 | 20 | – | 152.2 0.5 | 152.6 4.7 | 22.1 4.7 | 155.1 3.8 | 12.4 2.9 |
| 108 | … | … | 5224 1 | 20 | 5 | 96.5 1.2 | 92.9 3.0 | 13.0 5.0 | 101.4 1.8 | 13.7 4.2 |
| 116 | -0.8 0.4 | 0.1 0.8 | 7676 21 | 10 | – | 172.4 1.4 | 164.5 6.3 | 20.8 7.8 | 171.7 7.2 | 16.7 7.1 |
| 131 | 0.2 0.5 | -1.8 0.6 | 3689 10 | 18 | – | 128.0 0.4 | 123.4 3.6 | 11.7 2.6 | 129.2 2.8 | 11.0 2.7 |
| 147 | … | … | 3549 0 | 25 | 7 | 141.7 1.9 | 117.0 5.7 | 25.5 3.5 | 122.1 3.3 | 21.1 5.0 |
| 149 | -0.3 0.5 | -0.0 0.4 | 4396 12 | 20 | 5 | 3.9 0.8 | 8.5 4.3 | 13.0 3.1 | 7.2 4.0 | 10.0 3.7 |
| 151 | 1.4 0.5 | 0.5 0.5 | 4662 9 | 29 | – | 37.0 0.3 | 32.4 2.5 | 9.1 1.8 | 41.7 2.3 | 7.9 1.4 |
| 152 | 0.6 0.6 | 1.3 0.7 | 3881 9 | 20 | – | 121.9 0.5 | 116.9 5.9 | 21.7 5.3 | 125.2 10.0 | 41.2 14.8 |
| 153 | -3.1 0.7 | -1.6 0.8 | 7984 18 | 20 | – | 134.9 0.3 | 137.7 2.2 | 11.2 3.0 | 130.2 2.4 | 9.8 3.8 |
| 273 | 1.3 0.7 | 1.9 0.8 | 4326 11 | 33 | – | 162.9 0.2 | 162.6 2.7 | 12.6 2.1 | 164.5 2.5 | 12.1 2.3 |
| 275 | -1.0 0.4 | -0.3 0.4 | 2169 5 | 27 | 5 | 82.1 0.6 | 79.6 4.6 | 13.9 2.6 | 80.2 4.9 | 20.6 4.6 |
| 277 | -0.3 0.4 | -0.8 0.5 | 3690 6 | 25 | 9 | 22.3 0.7 | 19.7 5.9 | 22.4 3.4 | 19.6 6.4 | 19.4 2.9 |
| 307 | … | … | 8344 16 | 15 | – | 95.2 0.5 | 101.8 6.3 | 23.9 13.3 | 95.5 5.6 | 22.7 7.2 |
| 364 | … | … | 6474 1 | 25 | – | 99.8 0.4 | 102.6 1.4 | 6.2 0.8 | 101.8 0.8 | 5.9 1.0 |
| 386 | 0.5 0.6 | 0.4 0.5 | 6297 10 | 17 | – | 48.9 0.9 | 44.9 3.9 | 14.0 3.2 | 58.1 4.7 | 17.4 3.9 |
| 414 | … | … | 2521 0 | 25 | 7 | 107.9 3.2 | 135.6 12.8 | 36.8 7.8 | 141.5 11.0 | 38.7 6.4 |
| 436 | 0.3 0.7 | 0.5 0.7 | 3106 9 | 20 | 5 | 24.3 1.1 | 145.1 39.0 | 31.2 8.0 | 173.2 5.9 | 37.8 11.5 |
| 489 | -0.2 0.4 | -0.9 0.7 | 3392 5 | 25 | 10 | 104.1 1.0 | 102.4 3.7 | 16.6 3.9 | 106.6 3.8 | 16.1 3.4 |
| 515 | … | … | 3868 1 | 25 | 10 | 0.2 1.1 | 159.5 2.3 | 12.1 3.0 | 171.8 5.4 | 21.0 3.1 |
| 518 | … | … | 2712 0 | 30 | 5 | 88.5 1.0 | 99.2 4.4 | 24.2 3.5 | 93.0 3.5 | 23.4 4.4 |
| 580 | … | … | 4082 1 | 23 | 5 | 43.3 0.5 | 40.6 4.4 | 21.4 3.9 | 36.1 5.1 | 19.8 3.7 |
| 602 | -0.4 0.2 | -1.0 0.3 | 4737 5 | 15 | – | 75.2 0.8 | 72.9 3.2 | 11.5 3.0 | 82.4 4.4 | 10.9 4.7 |
| 610 | 1.4 0.8 | -1.2 1.0 | 7125 19 | 20 | – | 39.4 0.3 | 40.2 3.2 | 16.7 5.0 | 38.7 3.6 | 15.1 4.5 |
| 624 | 0.5 0.4 | 0.5 0.3 | 7255 7 | 25 | 6 | 116.4 1.5 | 92.9 3.5 | 18.3 2.8 | 85.2 4.8 | 16.8 3.2 |
| 630 | … | … | 1768 1 | 20 | 9 | 146.4 0.7 | 157.6 8.0 | 35.3 8.0 | 170.1 7.6 | 33.3 6.5 |
| 664 | … | … | 3220 0 | 25 | – | 118.7 0.2 | 109.4 2.6 | 13.0 2.0 | 111.5 2.9 | 18.7 2.7 |
| 684 | -1.5 0.3 | -0.2 0.3 | 5331 6 | 27 | 7 | 141.2 2.1 | 119.9 2.3 | 14.1 2.5 | 107.5 4.6 | 13.7 2.6 |
| 714 | 0.4 0.7 | -0.4 0.6 | 7793 18 | 20 | – | 16.7 0.5 | 12.7 5.0 | 13.0 2.9 | 13.0 4.3 | 16.7 4.1 |
| 715 | -0.7 0.8 | 0.0 0.7 | 1885 9 | 30 | 7 | 66.5 0.4 | 68.7 3.9 | 17.0 3.4 | 62.4 5.0 | 21.7 3.6 |
| 743 | -0.1 0.6 | 1.3 0.7 | 3868 8 | 25 | 5 | 85.9 0.5 | 92.1 7.5 | 32.4 5.2 | 81.0 6.4 | 25.7 6.5 |
| 748 | 0.3 0.7 | -0.4 0.4 | 2355 4 | 25 | 10 | 192.5 0.5 | 17.8 6.2 | 24.0 4.8 | 17.6 4.1 | 28.3 6.3 |
| 753 | -0.3 0.4 | -0.5 0.5 | 3175 4 | 25 | 7 | 56.1 0.6 | 57.4 3.0 | 15.6 2.8 | 57.0 3.2 | 10.1 1.8 |
| 764 | 1.0 0.7 | -1.1 0.8 | 7704 11 | 20 | 7 | 128.4 0.7 | 121.3 4.0 | 16.0 4.8 | 136.1 7.8 | 22.5 4.2 |
| 768 | -1.0 0.5 | -0.2 0.6 | 3735 8 | 15 | 7 | 42.4 0.9 | 50.0 20.6 | 37.6 12.1 | 41.7 13.8 | 41.7 7.4 |
| 771 | -1.1 0.8 | -1.8 0.9 | 3762 9 | 20 | 7 | 98.7 0.9 | 29.5 6.6 | 29.5 7.6 | 46.5 9.7 | 39.5 14.3 |
| 777 | 0.5 0.4 | -1.0 0.4 | 4836 9 | 30 | 10 | 36.1 0.4 | 35.7 2.0 | 10.1 1.6 | 38.4 3.1 | 12.3 1.9 |
| 779 | -1.8 0.5 | -1.1 0.6 | 5527 8 | 23 | – | 121.8 0.3 | 129.4 4.4 | 22.1 5.0 | 117.9 3.7 | 16.7 5.7 |
| 782 | 0.9 0.3 | 0.9 0.3 | 7803 10 | 12 | – | 152.9 0.5 | 147.6 3.0 | 10.3 3.3 | 152.9 3.6 | 21.0 8.2 |
| id | Vsys | rmax | rmin | PAmorph (rmax) | PA approaching | PA receding | ||||
| PAkin | PAkin | PAkin | PAkin | |||||||
| (arcsec) | (arcsec) | (km s-1) | (arcsec) | (arcsec) | (∘) | (∘) | (∘) | (∘) | (∘) | |
| (1) | (2) | (3) | (4) | (5) | (6) | (7) | (8) | (9) | (10) | (11) |
| 790 | … | … | 4677 1 | 12 | 5 | 143.6 1.3 | 142.4 5.6 | 16.1 4.3 | 144.5 5.9 | 12.4 4.5 |
| 791 | 1.2 0.3 | 0.4 0.3 | 3316 5 | 30 | – | 152.3 0.3 | 149.7 1.2 | 3.2 0.7 | 154.5 1.3 | 3.7 0.6 |
| 804 | -2.2 0.5 | -0.5 0.5 | 3388 7 | 15 | – | 126.8 0.5 | 130.5 4.4 | 19.3 4.8 | 127.7 4.7 | 18.6 5.8 |
| 810 | -0.3 0.5 | -0.1 0.5 | 4117 9 | 25 | – | 15.3 0.5 | 8.6 3.0 | 10.0 2.4 | 19.6 3.1 | 16.6 3.0 |
| 813 | … | … | 3836 1 | 28 | 7 | 113.1 8.8 | 101.1 5.5 | 33.8 5.3 | 90.0 4.4 | 32.4 6.1 |
| 823 | … | … | 2838 1 | 25 | 7 | 159.2 0.6 | 152.2 4.5 | 31.4 6.5 | 168.5 7.8 | 26.0 4.3 |
| 824 | -0.4 0.5 | -1.7 0.6 | 4730 14 | 27 | – | 159.8 0.2 | 161.6 3.0 | 10.5 1.8 | 152.7 4.0 | 13.6 2.2 |
| 826 | -0.4 0.5 | -1.2 0.5 | 5070 9 | 25 | – | 127.9 0.3 | 133.4 2.3 | 10.3 2.2 | 122.5 2.2 | 7.5 1.3 |
| 831 | -0.3 0.8 | 0.4 0.7 | 4957 12 | 15 | – | 123.4 0.6 | 123.8 9.4 | 30.1 9.9 | 133.8 7.1 | 28.2 8.4 |
| 834 | … | … | 8694 1 | 15 | – | 114.2 0.5 | 106.3 1.9 | 8.9 2.6 | 95.0 5.8 | 22.0 3.4 |
| 836 | 0.6 0.8 | 0.8 0.8 | 2424 4 | 29 | – | 148.9 0.9 | 140.5 5.3 | 28.1 7.3 | 133.4 6.1 | 31.1 5.0 |
| 842 | 0.3 0.5 | -2.2 0.5 | 2970 6 | 30 | 7 | 54.7 0.4 | 66.9 5.6 | 41.6 4.5 | 70.4 5.3 | 32.0 4.6 |
| 853 | … | … | 3788 1 | 30 | 10 | 53.0 5.0 | 53.6 2.9 | 10.8 2.1 | 49.5 2.2 | 5.7 1.4 |
| 854 | … | … | 8625 1 | 20 | – | 90.9 0.4 | 90.0 4.3 | 8.8 3.0 | 90.0 4.5 | 12.3 2.9 |
| 856 | … | … | 4696 1 | 22 | 5 | 91.6 0.7 | 90.0 4.3 | 24.7 7.1 | 93.7 3.7 | 20.2 3.9 |
| 857 | … | … | 8453 1 | 15 | – | 36.1 0.4 | 47.8 3.9 | 12.4 3.5 | 45.0 0.2 | 11.9 2.8 |
| 862 | … | … | 6704 1 | 25 | – | 32.1 0.4 | 30.2 3.4 | 13.2 2.1 | 31.7 2.2 | 10.1 1.9 |
| 869 | -0.6 0.5 | 0.9 0.5 | 6157 7 | 22 | 7 | 121.8 1.8 | 130.8 4.2 | 25.8 3.8 | 141.4 3.9 | 12.5 2.8 |
| 872 | -0.2 0.7 | -1.3 0.7 | 3767 11 | 20 | 7 | 85.4 3.0 | 64.2 6.3 | 21.5 3.8 | 56.3 6.9 | 23.1 4.3 |
| 876 | -0.6 0.8 | 1.4 0.8 | 5740 13 | 20 | 5 | 106.9 1.3 | 94.2 4.6 | 19.6 5.0 | 95.6 9.2 | 29.9 5.4 |
| 886 | -1.4 0.3 | -0.1 0.2 | 4488 5 | 27 | 7 | 12.8 0.3 | 4.2 1.8 | 8.0 1.6 | 20.0 2.2 | 9.0 2.0 |
| 887 | 0.3 0.4 | 0.4 0.3 | 7065 9 | 25 | 5 | 25.2 1.4 | 12.6 2.9 | 9.7 2.1 | 16.7 4.4 | 17.6 2.5 |
| 889 | -1.2 0.4 | -0.9 0.4 | 4852 7 | 20 | 10 | 64.4 0.7 | 73.4 3.9 | 9.9 2.1 | 58.6 2.9 | 14.8 3.1 |
| 890 | 0.4 0.5 | -0.1 0.4 | 6541 10 | 15 | – | 142.6 0.5 | 157.5 4.2 | 11.0 2.6 | 162.8 5.4 | 14.1 2.8 |
| 896 | 0.3 0.5 | 1.7 0.6 | 7439 11 | 18 | – | 19.6 0.5 | 18.7 6.9 | 20.0 5.5 | 29.6 5.6 | 23.0 4.6 |
| 904 | -0.5 0.5 | -0.0 0.5 | 4913 13 | 30 | 6 | 148.2 1.1 | 149.8 2.5 | 14.2 2.6 | 145.1 2.6 | 12.7 2.6 |
| 924 | -1.0 0.0 | -1.0 0.0 | 2571 1 | 22 | 7 | 24.6 0.8 | 37.4 1.8 | 12.0 1.7 | 51.4 3.2 | 14.7 3.7 |
| 929 | 1.4 0.8 | 0.1 0.7 | 7977 17 | 20 | – | 43.4 0.8 | 54.9 4.6 | 16.8 3.6 | 58.2 4.0 | 15.5 3.6 |
| 938 | 1.0 0.6 | 1.7 0.5 | 5896 4 | 15 | 7 | 51.1 5.9 | 75.3 10.7 | 34.0 6.3 | 73.2 8.1 | 26.1 5.4 |
| id | Vsys | rmax | rmin | PAmorph (rmax) | PA approaching | PA receding | ||||
| PAkin | PAkin | PAkin | PAkin | |||||||
| (arcsec) | (arcsec) | (km s-1) | (arcsec) | (arcsec) | (∘) | (∘) | (∘) | (∘) | (∘) | |
| (1) | (2) | (3) | (4) | (5) | (6) | (7) | (8) | (9) | (10) | (11) |
| 1 | … | … | 4990 2 | 22 | … | 3.7 0.4 | 4.5 1.2 | 3.1 1.0 | 3.5 1.6 | 3.5 1.3 |
| 2 | 0.2 0.1 | -2.3 0.1 | 7247 1 | 22 | … | 45.2 0.9 | 55.0 1.4 | 6.1 0.7 | 44.6 1.0 | 6.5 1.5 |
| 7 | -1.4 0.3 | -0.5 0.4 | 6299 18 | 20 | … | 17.4 0.2 | 27.8 2.7 | 8.6 2.1 | 10.3 2.4 | 6.8 1.7 |
| 8 | 0.1 0.1 | 0.9 0.1 | 4534 0 | 20 | 7 | 106.0 1.1 | 116.2 2.1 | 7.4 1.0 | 115.7 1.7 | 7.3 1.0 |
| 10 | 0.1 0.2 | -0.7 0.3 | 5974 8 | 25 | 10 | 179.3 0.6 | 16.4 1.4 | 8.3 1.5 | 18.9 2.3 | 13.9 2.5 |
| 23 | -0.5 0.6 | -0.9 0.6 | 3859 6 | 20 | 10 | 126.0 0.7 | 69.9 16.1 | 91.4 9.2 | 108.2 33.0 | 91.4 21.9 |
| 25 | -1.8 0.5 | -1.2 0.6 | 5239 10 | 30 | 7 | 167.1 1.0 | 174.6 2.4 | 14.5 3.2 | 165.6 1.8 | 19.8 2.7 |
| 28 | -0.4 0.2 | 0.0 0.3 | 4486 4 | 12 | 5 | 60.4 0.8 | 56.2 2.3 | 11.0 2.6 | 47.3 2.4 | 8.6 2.5 |
| 30 | 0.1 0.1 | 1.4 0.1 | 4111 2 | 20 | 7 | 177.3 0.8 | 5.7 1.9 | 6.8 1.7 | 179.6 0.6 | 6.9 3.0 |
| 31 | -0.8 0.2 | 1.5 0.2 | 4438 2 | 30 | 5 | 82.2 4.9 | 65.4 1.1 | 7.2 1.3 | 75.9 1.9 | 10.5 2.2 |
| 33 | -0.2 0.2 | 0.5 0.2 | 5213 6 | 20 | 7 | 93.7 1.5 | 91.5 2.1 | 7.5 1.1 | 87.7 1.2 | 6.9 1.3 |
| 41 | … | … | 5547 0 | 15 | … | 53.9 0.2 | 45.9 2.2 | 9.6 2.4 | 60.6 2.2 | 6.1 1.3 |
| 43 | -0.1 0.3 | 1.0 0.4 | 4811 7 | 12 | 7 | 156.4 1.0 | 7.9 4.0 | 12.3 3.8 | 16.1 4.5 | 11.5 4.3 |
| 53 | -1.2 0.3 | -1.8 0.3 | 6356 4 | 20 | … | 152.2 0.5 | 148.0 1.4 | 4.8 1.0 | 151.7 1.6 | 5.8 1.2 |
| 108 | 0.1 0.2 | -0.1 0.3 | 5235 2 | 20 | 5 | 96.5 1.2 | 100.6 2.2 | 8.5 2.0 | 100.4 2.3 | 9.0 2.4 |
| 116 | -0.7 0.4 | 1.4 0.4 | 7696 12 | 10 | … | 172.4 1.4 | 159.9 4.9 | 8.3 2.7 | 167.3 7.0 | 12.3 5.0 |
| 131 | -0.1 0.5 | -0.4 0.5 | 3693 7 | 18 | … | 128.0 0.4 | 130.3 3.5 | 8.2 2.5 | 132.9 2.9 | 7.0 1.9 |
| 147 | 0.1 0.1 | 2.2 0.2 | 3568 2 | 25 | 7 | 141.7 1.9 | 117.7 1.4 | 8.1 1.4 | 116.4 4.3 | 14.3 2.6 |
| 149 | 0.6 0.2 | -0.6 0.2 | 4359 10 | 20 | 5 | 3.9 0.8 | 5.3 1.7 | 4.7 0.9 | 13.8 1.7 | 5.9 1.5 |
| 151 | 0.7 0.3 | -0.3 0.2 | 4574 18 | 29 | … | 37.0 0.3 | 36.6 1.3 | 4.3 0.8 | 37.3 3.0 | 10.8 3.7 |
| 152 | -0.1 0.3 | -1.1 0.3 | 3916 4 | 20 | … | 121.9 0.5 | 122.8 1.9 | 8.2 2.2 | 113.9 2.2 | 8.1 1.8 |
| 153 | -0.6 0.4 | -0.7 0.3 | 8081 10 | 20 | … | 134.9 0.3 | 135.7 2.1 | 7.3 1.8 | 134.0 1.9 | 4.8 1.1 |
| 273 | 2.4 0.9 | -1.9 0.6 | 4270 5 | 33 | … | 162.9 0.2 | 150.0 2.9 | 10.7 2.1 | 174.1 2.6 | 6.2 1.5 |
| 275 | 1.2 0.2 | 0.6 0.1 | 2086 6 | 27 | 5 | 82.1 0.6 | 83.2 0.9 | 3.9 0.8 | 82.3 1.3 | 8.1 1.9 |
| 277 | 0.9 0.4 | 0.4 0.6 | 3649 6 | 25 | 9 | 22.3 0.7 | 12.8 2.5 | 16.1 2.8 | 32.5 4.0 | 26.6 3.1 |
| 307 | -0.2 0.3 | 0.2 0.3 | 8439 10 | 15 | … | 95.2 0.5 | 97.2 4.3 | 9.1 3.4 | 92.0 3.2 | 6.3 2.5 |
| 364 | 0.2 0.6 | 1.1 0.6 | 6582 22 | 25 | … | 99.8 0.4 | 108.6 4.3 | 14.3 2.7 | 98.6 2.8 | 6.4 1.7 |
| 386 | -0.7 0.5 | -0.1 0.6 | 6332 10 | 17 | … | 48.9 0.9 | 46.6 3.4 | 8.8 2.6 | 44.2 2.9 | 10.6 2.6 |
| 414 | -0.4 0.3 | 0.1 0.3 | 2497 3 | 25 | 7 | 107.9 3.2 | 143.4 2.3 | 13.8 2.6 | 150.5 2.8 | 17.1 3.7 |
| 436 | 0.1 0.3 | -1.5 0.3 | 3158 6 | 20 | 5 | 24.3 1.1 | 171.5 3.1 | 12.1 4.7 | 173.7 2.7 | 7.7 1.9 |
| 489 | 0.8 0.1 | -0.6 0.2 | 3409 1 | 25 | 10 | 104.1 1.0 | 100.8 1.5 | 8.8 1.3 | 104.2 2.0 | 8.1 1.2 |
| 515 | 0.1 0.4 | 0.1 0.3 | 3866 7 | 25 | 10 | 0.2 1.1 | 166.6 3.3 | 10.5 1.9 | 165.4 3.2 | 10.1 1.8 |
| 518 | -0.6 0.5 | -0.5 0.2 | 2690 11 | 30 | 5 | 88.5 1.0 | 98.1 2.9 | 13.7 1.9 | 97.3 2.5 | 14.2 3.1 |
| 580 | 0.0 0.2 | -0.0 0.2 | 4063 2 | 23 | 5 | 43.3 0.5 | 40.1 1.5 | 6.6 1.6 | 35.5 1.6 | 7.8 1.2 |
| 602 | … | … | 4799 12 | 15 | … | 75.2 0.8 | 67.0 3.7 | 23.9 6.9 | 59.3 6.5 | 19.8 4.8 |
| 610 | 0.5 0.4 | 1.1 0.5 | 7223 12 | 20 | … | 39.4 0.3 | 39.9 2.0 | 5.6 1.3 | 47.0 2.6 | 7.1 1.5 |
| 624 | 0.9 0.6 | -0.3 0.4 | 7309 7 | 25 | 6 | 116.4 1.5 | 87.4 4.6 | 25.9 5.1 | 78.1 7.9 | 38.4 4.2 |
| 630 | -0.1 0.4 | 0.0 0.5 | 1727 7 | 20 | 9 | 146.4 0.7 | 159.5 4.0 | 18.5 4.4 | 163.9 3.7 | 18.1 4.3 |
| 664 | … | … | 3204 5 | 25 | … | 118.7 0.2 | 113.3 3.2 | 19.8 3.3 | 103.6 3.2 | 13.6 3.5 |
| 684 | 0.4 0.4 | 1.2 0.4 | 5439 10 | 27 | 7 | 141.2 2.1 | 109.5 3.8 | 15.3 4.5 | 111.3 4.2 | 15.0 2.0 |
| 714 | -0.2 0.2 | 0.4 0.2 | 7831 10 | 20 | … | 16.7 0.5 | 12.1 2.4 | 5.6 1.3 | 13.5 1.9 | 4.3 1.0 |
| 715 | -1.0 0.1 | 0.7 0.0 | 1884 1 | 30 | 7 | 66.5 0.4 | 64.9 0.5 | 4.3 0.6 | 66.7 0.8 | 7.3 1.6 |
| 743 | 0.3 0.2 | -0.3 0.1 | 3865 5 | 25 | 5 | 85.9 0.5 | 83.0 1.6 | 6.0 0.9 | 84.9 1.3 | 8.5 1.0 |
| 748 | -0.9 0.1 | -2.7 0.1 | 2350 2 | 25 | 10 | 192.5 0.5 | 10.7 0.7 | 6.1 1.0 | 21.4 1.4 | 10.3 1.4 |
| 753 | 0.8 0.1 | -0.6 0.1 | 3222 4 | 25 | 7 | 56.1 0.6 | 58.4 0.7 | 8.4 0.7 | 55.7 0.6 | 4.0 0.4 |
| 764 | -0.9 0.3 | 0.7 0.2 | 7726 12 | 20 | 7 | 128.4 0.7 | 129.4 2.8 | 10.2 2.4 | 128.4 2.3 | 12.4 3.9 |
| 768 | 0.4 0.2 | -0.0 0.2 | 3765 3 | 15 | 7 | 42.4 0.9 | 36.8 1.5 | 8.5 1.8 | 53.7 1.8 | 7.7 1.8 |
| 771 | 2.2 0.3 | -0.5 0.4 | 3741 9 | 20 | 7 | 98.7 0.9 | 40.7 3.9 | 15.8 2.7 | 44.3 2.8 | 11.5 2.9 |
| 777 | -0.5 0.2 | 0.6 0.2 | 4877 9 | 30 | 10 | 36.1 0.4 | 37.4 1.0 | 4.7 0.9 | 36.4 1.2 | 6.0 1.0 |
| 779 | -0.1 0.3 | -1.1 0.3 | 5559 5 | 23 | … | 121.8 0.3 | 124.9 2.1 | 6.5 1.3 | 122.5 2.0 | 8.4 1.7 |
| 782 | 0.3 0.5 | 0.5 0.5 | 7878 29 | 12 | … | 152.9 0.5 | 153.0 3.6 | 10.4 2.9 | 149.0 4.6 | 11.9 3.1 |
| id | Vsys | rmax | rmin | PAmorph (rmax) | PA approaching | PA receding | ||||
|---|---|---|---|---|---|---|---|---|---|---|
| PAkin | PAkin | PAkin | PAkin | |||||||
| (arcsec) | (arcsec) | (km s-1) | (arcsec) | (arcsec) | (∘) | (∘) | (∘) | (∘) | (∘) | |
| (1) | (2) | (3) | (4) | (5) | (6) | (7) | (8) | (9) | (10) | (11) |
| 790 | 1.8 0.3 | 0.9 0.3 | 4717 6 | 12 | 5 | 143.6 1.3 | 145.5 3.7 | 11.1 1.9 | 160.7 5.9 | 12.7 3.3 |
| 791 | -0.5 0.2 | -0.3 0.2 | 3276 4 | 30 | … | 152.3 0.3 | 154.1 1.1 | 3.8 0.7 | 148.9 1.0 | 3.2 0.4 |
| 804 | -3.1 0.4 | -2.4 0.5 | 3486 7 | 15 | … | 126.8 0.5 | 124.7 4.7 | 25.2 6.7 | 109.5 15.9 | 71.6 12.6 |
| 810 | 0.7 0.1 | 1.1 0.1 | 4093 1 | 25 | … | 15.3 0.5 | 15.4 0.7 | 4.1 0.8 | 15.1 0.6 | 5.7 0.8 |
| 813 | -0.6 0.1 | 0.0 0.2 | 3818 1 | 28 | 7 | 113.1 8.8 | 101.9 2.0 | 15.8 2.7 | 90.5 3.0 | 13.8 3.8 |
| 823 | -1.0 0.2 | 1.9 0.3 | 2825 2 | 25 | 7 | 159.2 0.6 | 149.6 2.1 | 8.3 1.4 | 158.6 2.1 | 10.7 2.0 |
| 824 | -0.4 0.1 | -0.6 0.2 | 4732 3 | 27 | … | 159.8 0.2 | 159.3 1.0 | 5.4 1.2 | 161.7 1.2 | 5.5 1.1 |
| 826 | … | … | 5014 2 | 25 | … | 127.9 0.3 | 123.9 1.8 | 12.4 2.2 | 129.9 2.2 | 17.9 3.3 |
| 831 | 0.2 0.1 | 0.5 0.2 | 4968 4 | 15 | … | 123.4 0.6 | 124.2 1.5 | 6.6 1.2 | 127.1 1.2 | 5.3 0.9 |
| 834 | -0.4 0.5 | 1.3 0.5 | 8764 14 | 15 | … | 114.2 0.5 | 101.9 3.7 | 11.8 4.3 | 106.8 3.7 | 7.5 2.1 |
| 836 | 1.1 0.2 | 1.9 0.2 | 2407 0 | 29 | … | 148.9 0.9 | 120.9 1.7 | 10.9 1.9 | 135.6 2.2 | 17.5 2.6 |
| 842 | 0.0 0.3 | -0.2 0.3 | 2955 6 | 30 | 7 | 54.7 0.4 | 56.8 2.4 | 9.6 1.5 | 63.2 2.6 | 15.6 1.8 |
| 853 | 0.8 0.2 | -1.0 0.2 | 3809 3 | 30 | 10 | 53.0 5.0 | 50.3 0.9 | 2.9 0.3 | 47.3 1.2 | 3.3 0.4 |
| 854 | 0.9 0.4 | 0.2 0.2 | 8654 16 | 20 | … | 90.9 0.4 | 87.4 2.3 | 10.1 2.8 | 86.2 3.1 | 9.7 2.9 |
| 856 | 0.7 0.1 | 2.1 0.2 | 4700 3 | 22 | 5 | 91.6 0.7 | 94.3 2.6 | 10.4 2.5 | 91.8 2.6 | 6.9 1.8 |
| 857 | -2.0 0.6 | -1.5 0.4 | 8539 8 | 15 | … | 36.1 0.4 | 60.5 3.7 | 12.6 5.6 | 38.2 4.3 | 11.7 3.1 |
| 862 | -1.3 0.2 | 1.0 0.2 | 6720 4 | 25 | … | 32.1 0.4 | 27.8 1.2 | 4.9 1.0 | 37.8 1.7 | 7.3 0.7 |
| 869 | 1.3 0.6 | 3.0 0.4 | 6139 18 | 22 | 7 | 121.8 1.8 | 125.9 3.0 | 13.4 3.7 | 133.0 2.7 | 12.3 2.5 |
| 872 | 2.0 0.7 | 1.1 0.6 | 3813 22 | 20 | 7 | 85.4 3.0 | 64.3 5.3 | 36.8 3.2 | 45.3 6.7 | 30.3 5.8 |
| 876 | 0.1 0.3 | -1.2 0.2 | 5743 4 | 20 | 5 | 106.9 1.3 | 98.1 2.4 | 8.8 1.7 | 96.7 3.2 | 14.2 3.8 |
| 886 | -0.3 0.1 | 0.1 0.2 | 4455 5 | 27 | 7 | 12.8 0.3 | 10.3 1.2 | 6.0 1.4 | 17.2 1.1 | 7.0 1.2 |
| 887 | 0.8 0.1 | 0.9 0.1 | 7056 3 | 25 | 5 | 25.2 1.4 | 15.3 1.8 | 8.6 1.2 | 15.0 1.6 | 7.3 1.5 |
| 889 | -0.5 0.0 | 0.5 0.1 | 4883 0 | 20 | 10 | 64.4 0.7 | 61.7 1.2 | 6.3 0.9 | 70.7 1.2 | 5.4 1.2 |
| 890 | 2.1 0.4 | -1.2 0.4 | 6533 5 | 15 | … | 142.6 0.5 | 144.5 3.0 | 13.9 4.0 | 167.8 4.2 | 9.7 3.8 |
| 896 | 0.9 0.2 | 0.0 0.3 | 7461 6 | 18 | … | 19.6 0.5 | 18.2 2.7 | 7.7 1.4 | 28.1 1.8 | 6.8 1.7 |
| 904 | -0.6 0.1 | 1.5 0.1 | 4892 0 | 30 | 6 | 148.2 1.1 | 145.1 1.5 | 8.4 1.1 | 147.2 0.7 | 5.9 1.1 |
| 924 | -0.2 0.4 | -0.3 0.4 | 2525 12 | 22 | 7 | 24.6 0.8 | 49.3 3.9 | 13.4 2.9 | 52.0 2.7 | 13.8 3.7 |
| 929 | -2.0 0.3 | 1.4 0.3 | 8103 6 | 20 | … | 43.4 0.8 | 52.4 1.3 | 7.1 1.5 | 50.7 1.9 | 7.6 1.8 |
| 938 | 0.6 0.2 | 0.7 0.2 | 5913 3 | 15 | 7 | 51.1 5.9 | 64.6 3.9 | 14.6 3.4 | 68.4 5.2 | 12.3 3.4 |
| id | Stars | Ionized gas | ||||||||||
| rin | rout | rin | rout | |||||||||
| r | r | r | r | PAapp | PArec | PAapp | PArec | PAapp | PArec | PAapp | PArec | |
| (arcsec) | (arcsec) | (arcsec) | (arcsec) | (degrees) | (degrees) | (degrees) | (degrees) | (degrees) | (degrees) | (degrees) | (degrees) | |
| (1) | (2) | (3) | (4) | (5) | (6) | (7) | (8) | (9) | (10) | (11) | (12) | (13) |
| 8 | 10 | 20 | 14 | 28 | 114 | 117 | 114 | 112 | 114 | 114 | 114 | 117 |
| 10 | 12 | 25 | 12 | 27 | 27 | 15 | 12 | 12 | 18 | 13 | 15 | 17 |
| 23 | 15 | 25 | 27 | 30 | 81 | 84 | 103 | 89 | 77 | 102 | 76 | 76 |
| 25 | 22 | 30 | 22 | 30 | 170 | 166 | 155 | 171 | 170 | 166 | 168 | 155 |
| 28 | 14 | 17 | 14 | 28 | 52 | 42 | 72 | 52 | 55 | 48 | 49 | 51 |
| 30 | 7 | 20 | 7 | 30 | 183 | 162 | 189 | 168 | 12 | 162 | 6 | 91 |
| 31 | 15 | 30 | 16 | 32 | 57 | 74 | 72 | 64 | 67 | 72 | 65 | 73 |
| 33 | 10 | 20 | 16 | 32 | 93 | 90 | 88 | 95 | 91 | 86 | 90 | 95 |
| 43 | 8 | 17 | 8 | 17 | 22 | 29 | 9 | 20 | 7 | 19 | 99 | 10 |
| 108 | 10 | 20 | 10 | 27 | 86 | 90 | 96 | 107 | 94 | 95 | 100 | 97 |
| 147 | 10 | 20 | 10 | 30 | 117 | 116 | 112 | 125 | 117 | 115 | 117 | 115 |
| 149 | 12 | 25 | 12 | 28 | 10 | 10 | 6 | 4 | 5 | 18 | 5 | 12 |
| 275 | 13 | 27 | 16 | 32 | 78 | 76 | 79 | 94 | 83 | 80 | 82 | 86 |
| 277 | 12 | 25 | 16 | 30 | 15 | 20 | 23 | 13 | 49 | 46 | 12 | 21 |
| 414 | 14 | 25 | 14 | 30 | 137 | 136 | 147 | 144 | 133 | 137 | 146 | 152 |
| 436 | 14 | 25 | 23 | 25 | 164 | 181 | 178 | 175 | 172 | 173 | 178 | 178 |
| 489 | 13 | 27 | 16 | 32 | 102 | 110 | 95 | 102 | 98 | 106 | 105 | 99 |
| 515 | 15 | 25 | 16 | 32 | 162 | 168 | 163 | 172 | 164 | 162 | 166 | 169 |
| 518 | 17 | 30 | 17 | 30 | 105 | 93 | 90 | 98 | 104 | 97 | 95 | 98 |
| 580 | 11 | 23 | 13 | 27 | 35 | 37 | 47 | 33 | 35 | 31 | 42 | 35 |
| 602 | 11 | 22 | 5 | 10 | 68 | 81 | 75 | 84 | 71 | 80 | 65 | 63 |
| 624 | 21 | 25 | 21 | 30 | 90 | 82 | 105 | 100 | 74 | 70 | 92 | 89 |
| 630 | 12 | 22 | 12 | 32 | 160 | 97 | 155 | 158 | 167 | 163 | 159 | 157 |
| 684 | 15 | 27 | 20 | 30 | 119 | 111 | 121 | 105 | 114 | 114 | 107 | 108 |
| 715 | 15 | 30 | 16 | 32 | 72 | 59 | 66 | 61 | 65 | 67 | 64 | 58 |
| 743 | 12 | 25 | 16 | 32 | 80 | 84 | 94 | 78 | 81 | 84 | 81 | 83 |
| 748 | 12 | 25 | 16 | 30 | 12 | 20 | 18 | 19 | 12 | 24 | 13 | 22 |
| 753 | 12 | 25 | 16 | 32 | 54 | 57 | 55 | 54 | 53 | 57 | 62 | 56 |
| 764 | 7 | 20 | 7 | 30 | 132 | 124 | 119 | 138 | 120 | 113 | 130 | 128 |
| 768 | 7 | 15 | 14 | 28 | 38 | 25 | 42 | 42 | 35 | 53 | 38 | 47 |
| 771 | 10 | 20 | 21 | 30 | 21 | 33 | 35 | 38 | 39 | 41 | 48 | 33 |
| 777 | 15 | 30 | 18 | 35 | 36 | 38 | 32 | 38 | 38 | 34 | 36 | 34 |
| 790 | 6 | 12 | 10 | 20 | 137 | 143 | 144 | 146 | 144 | 162 | 149 | 155 |
| 791 | 15 | 30 | 15 | 30 | 151 | 154 | 149 | 154 | 156 | 149 | 153 | 149 |
| 813 | 16 | 28 | 16 | 35 | 106 | 88 | 93 | 88 | 101 | 83 | 99 | 95 |
| 823 | 12 | 25 | 16 | 32 | 156 | 165 | 160 | 161 | 149 | 162 | 152 | 154 |
| 836 | 14 | 29 | 14 | 29 | 144 | 135 | 131 | 129 | 127 | 138 | 119 | 129 |
| 842 | 18 | 30 | 15 | 30 | 90 | 73 | 57 | 60 | 58 | 70 | 55 | 52 |
| 853 | 15 | 30 | 15 | 30 | 53 | 46 | 56 | 50 | 49 | 45 | 50 | 48 |
| 856 | 7 | 22 | 7 | 30 | 84 | 98 | 95 | 89 | 76 | 88 | 94 | 93 |
| 869 | 16 | 22 | 16 | 30 | 130 | 142 | 116 | 132 | 134 | 136 | 124 | 133 |
| 872 | 17 | 20 | 17 | 30 | 63 | 55 | 75 | 65 | 61 | 39 | 73 | 71 |
| 876 | 10 | 20 | 15 | 25 | 94 | 79 | 96 | 110 | 102 | 89 | 92 | 101 |
| 886 | 13 | 27 | 16 | 32 | 2 | 24 | 4 | 18 | 15 | 16 | 7 | 15 |
| 887 | 10 | 25 | 10 | 35 | 10 | 10 | 15 | 24 | 11 | 15 | 14 | 13 |
| 889 | 11 | 22 | 11 | 28 | 71 | 58 | 74 | 58 | 57 | 66 | 63 | 69 |
| 904 | 11 | 30 | 11 | 30 | 143 | 138 | 152 | 146 | 142 | 143 | 145 | 148 |
| 924 | 11 | 22 | 16 | 32 | 39 | 48 | 33 | 51 | 43 | 53 | 46 | 48 |
| 938 | 11 | 20 | 11 | 30 | 78 | 72 | 67 | 74 | 64 | 69 | 66 | 66 |
Appendix C Stellar and Ionized velocity fields
In this appendix we present the velocity field of the 80 non-interacting galaxies. Each row present one galaxy similar as in Fig.1. From left to right: SDSS r-band image of the galaxy. White solid line represents the photometric PA measured at the same galactocentric distance as the kinematic PA (, see section 3). Dashed line represents the photometric PA measured at the outermost isophote of the image (PA, see section 4.3). Next two panels show the stellar and ionised gas velocity maps, respectively. Green points highlight the locations where the maximum velocity is located at given radius, determined from the position-velocity diagram. Black lines for each kinematic side represent the average kinematic PA (PAkin), while white thin lines along the zero-velocity curve show the average minor kinematic PA. Next panel shows the distance from the galactic centre versus the maximum for the stellar (blue) and ionised gas (red) components. The curve along 0 km s-1 represent the velocities along the zero-velocity curve. Uncertainty in velocity are determined from Monte Carlo simulations. Last panel shows the dependence of the different PA with respect to the radius. , and are represented by open circles, filled blue diamonds and filled red squares, respectively. For barred galaxies we highlight with dashed lines the length of the bar and its orientation.