The Decomposed Bulge and Disk Size-Mass Relations of Massive Galaxies at in CANDELS
Abstract
We have constructed a mass-selected sample of galaxies at in the CANDELS UDS and COSMOS fields and have decomposed these systems into their separate bulge and disk components according to their -band morphologies. By extending this analysis to multiple bands we have been able to conduct individual bulge and disk component SED fitting which has provided us with stellar-mass and star-formation rate estimates for the separate bulge and disk components. These have been combined with size measurements to explore the evolution of these massive high-redshift galaxies. By utilising the new decomposed stellar-mass estimates, we confirm that the bulge components display a stronger size evolution than the disks. This can be seen from both the fraction of bulge components which lie below the local relation and the median sizes of the bulge components, where the bulges are a median factor of times smaller than similarly massive local galaxies at and smaller at ; for the disks the corresponding factors are smaller at and smaller at . Moreover, by splitting our sample into the passive and star-forming bulge and disk sub-populations and examining their sizes as a fraction of their present-day counter-parts, we find that the star-forming and passive bulges are equally compact, star-forming disks are larger, while the passive disks have intermediate sizes. This trend is not evident when classifying galaxy morphology on the basis of single-Sérsic fits (ie. or ) and adopting the overall star-formation rates. Finally, by evolving the star-formation histories of the passive disks back to the redshifts when the passive disks were last active, we show that the passive and star-forming disks have consistent sizes at the relevant epoch. These trends need to be reproduced by any mechanisms which attempt to explain the morphological evolution of galaxies.
keywords:
galaxies: evolution - galaxies: structure - galaxies: spiral - galaxies: elliptical and lenticular - cD, galaxies: high-redshift1 Introduction
In recent years, increasingly detailed high-resolution morphological studies of massive galaxies at have provided strong evidence for evolution in the sizes of high-redshift galaxies, which are observed to be up to a factor of ( e.g. Daddi et al. 2005; Trujillo et al. 2006; Toft et al. 2007; Trujillo et al. 2007; Buitrago et al. 2008; Cimatti et al. 2008; Franx et al. 2008; van Dokkum et al. 2008; Damjanov et al. 2009 and Cassata et al. 2010) more compact than similarly massive present-day systems, with the most compact high-redshift systems also being seen to be the most passive (Toft et al., 2007; Kriek et al., 2009; Newman et al., 2012; McLure et al., 2013).
Despite early suggestions that the sizes of these systems were under-predicted due to selection effects and measurement uncertainties in both mass and size (van der Wel et al., 2009; Muzzin et al., 2009; Mancini et al., 2010), several spectroscopic campaigns (van der Wel et al., 2008; Newman et al., 2010; van de Sande et al., 2011, 2013; McLure et al., 2013) have subsequently provided more robust dynamical mass measurements. Additionally, tests of the sizes of simulated galaxies recovered by commonly adopted fitting procedures, such as GALFIT (Peng et al., 2010) and GALAPAGOS (Barden et al., 2012), by Häussler et al. (2007), van der Wel et al. (2012), Newman et al. (2012), and more recently by Davari et al. (2014) for more complex morphological systems equivalent to local ellipticals, have shown that these size estimates are not significantly biased or under-estimated. These results, coupled with the deep morphological studies of small samples by Szomoru et al. (2010, 2012) and Trujillo et al. (2012) confirm the genuine compactness of high-redshift galaxies.
However, in spite of mounting evidence for the evolution in the median size of the massive galaxy population with redshift, there remains debate over whether a significant fraction of the compact systems survive to the present day and, moreover, if the increase in the median size of galaxies is driven by the growth of individual systems or by the addition of newly quenched, larger, galaxies to the passive population.
Recent studies such as those by Valentinuzzi et al. (2010a) and Poggianti et al. (2013a) for cluster and field environments, respectively, have found that a significant fraction of local systems () are compact. These results, coupled with co-moving number density redshift evolution studies of compact, passive, galaxies (Cassata et al., 2011; Carollo et al., 2013; Cassata et al., 2013; Poggianti et al., 2013b), and the associated suggestions that the reported size evolution of massive galaxies may be over-estimated due to the effects of progenitor bias, have argued that the observed evolution in the median sizes of the massive galaxy population may not be primarily driven by the growth of individual systems (e.g. via minor merging or adiabatic expansion as proposed by Khochfar & Silk 2006; Naab et al. 2007; Hopkins et al. 2009; Shankar et al. 2011; Fan et al. 2008, 2010), but instead by the addition of newly quenched, larger, galaxies to this population with time (Carollo et al., 2013; Krogager et al., 2013; Poggianti et al., 2013b).
However, the newly reported prevalence of low redshift compact galaxies is in conflict with previous studies with SDSS, which found that as little as of the local population can be classified as compact (Trujillo et al., 2009; Taylor et al., 2010). Moreover, the latest co-moving number density study of passive (ETGs) over within the full CANDELS+3D-HST fields by van der Wel et al. (2014) shows that, whilst the overall co-moving number density of “compact” systems (defined simply as kpc) does not appear to evolve strongly with redshift, the size distribution of galaxies within this “compact” classification does, such that the co-moving number density of small galaxies decreases with decreasing redshift. In addition to this, there is new evidence provided by the velocity dispersion study of Belli et al. (2014), which reveals that by accounting for progenitor bias by considering systems at fixed velocity dispersions with redshift, the dominant contribution to the growth in sizes of passive galaxies between is the increase in the size of individual systems, rather than the addition of newly-quenched, larger galaxies.
Existing studies of galaxy size evolution at have almost exclusively been conducted by fitting single-Sérsic light profiles to galaxies in order to measure their effective radii. However, it is becoming increasingly clear that within the regime massive galaxies are undergoing dramatic structural transformations from disk-dominated and visually disturbed morphological systems at to bulge dominated at lower redshifts (Buitrago et al., 2013; van der Wel et al., 2011; McLure et al., 2013; Mortlock et al., 2013; Mozena et al., 2013; Wuyts et al., 2012; Bruce et al., 2012). Therefore, in order to best conduct studies of the morphological evolution of galaxies at high redshift it is vital to trace both the bulge and disk components separately by decomposing galaxy morphologies into these two components. Previously, such bulge-disk decompositions have generally been conducted in the local Universe (e.g. de Jong 1996; Allen et al. 2006; Cameron et al. 2009; Simard et al. 2011 and Lackner & Gunn 2012), where high-resolution imaging is more readily available. By contrast, bulge-disk decompositions at high redshifts have been limited to small samples (van der Wel et al., 2011). However, with the advent of large, high-resolution surveys such as CANDELS with HST WFC3 it is now possible to conduct the first decompositions at rest-frame wavelengths longer than the 4000 break (tracing the assembled stellar mass) for statistically significant mass-selected samples of high-redshift galaxies (Bruce et al. 2012 and also Lang et al. 2014 who conduct similar decompositions on stellar-mass maps). The results from our previous analysis (Bruce et al., 2012) explicitly revealed that the bulge components display a much stronger size evolution with redshift than the disk components. However, this study was limited by the use of stellar-mass estimates determined for the entire galaxy which were sub-divided for the bulge and disk components based purely on the fraction of the -band light which was attributed to each component. In the new study presented here we have further utilised the bulge-disk morphological decomposition approach to extend our analysis to the additional three photometric bands covered by CANDELS in order to conduct separate-component SED fitting. As described in Bruce et al. (2014a) this analysis has allowed separate stellar masses and, additionally, star-formation rates to be estimated for the individual bulge and disk components. Here, we use this new information to explore the size evolution of the bulge and disk components by separating them into star-forming and passive sub-populations based on their specific star-formation rates.
The structure of this paper is as follows. In Section 2 we provide a summary of our data-sets and the sample properties. This is followed in Section 3 by a brief overview of our decomposed multi-band morphological fitting and SED fitting procedure. In Section 4 we present the results from our analysis and explore the relation between single-Sérsic index fits and bulge-to-total light fractions, the decomposed size-mass relations of the galaxies in our sample and any trends with decomposed star-formation rates. We also use our decompositions to probe the fractional size evolutional of galaxies split into the decomposed disk and bulge, passive and star-forming sub-samples. These results are compared to those from existing studies in Section 5, after which we conclude with a discussion of our findings within the context of current galaxy size growth and quenching models. Finally, in Section 6 we summarise our main results.
Throughout this work we quote magnitudes in the AB system, and calculate all physical quantities assuming a CDM universe with , and .
2 Data
We have used the high-resolution near-infrared HST WFC3/IR data from the CANDELS multi-cycle treasury programme (Grogin et al., 2011; Koekemoer et al., 2011) centred on the UKIDSS Ultra Deep Survey (UDS; Lawrence et al. 2007) and the COSMOS (Scoville et al., 2007; Koekemoer et al., 2007) fields. Both the CANDELS UDS and COSMOS near-infrared data comprise WFC3/IR tiles covering a total area of 187 arcmin2 in each field, in both the F125W and F160W filters with 5- point-source depths of 27.1 and 27.0 (AB mag) respectively. In addition to near-infrared data, we have also made use of the accompanying CANDELS HST ACS parallels in the F814W and F606W filters (hereafter and ). The 5- point-source depths are 28.4 for both the and bands in UDS and 28.5 in COSMOS. Approximately of the area of the UDS and COSMOS fields is covered by both ACS and WFC3 pointings.
2.1 Supporting multi-wavelength data
In addition to the near-infrared and optical imaging provided by HST, we have also utilised the multi-wavelength data-sets available in each field to constrain SED fitting and determine the physical properties for the galaxies in our sample. For the UDS these include: CFHT -band imaging; deep optical , , , and -band imaging from the Subaru XMM-Newton Deep Survey (SXDS; Sekiguchi et al. 2005; Furusawa et al. 2008); , and -band UKIRT WFCAM imaging from Data Release 8 (DR8) of the UKIDSS UDS; and Spitzer 3.6 m, 4.5 m IRAC and 24 m MIPS imaging from the SpUDS legacy programme (PI Dunlop). For COSMOS they include: optical imaging in , , , and -bands from MegaCam CFHTLS-D2; -band from Subaru; ,, & from Ultra-VISTA (PI Dunlop); and Spitzer 3.6 m, 4.5 m IRAC and 24 m MIPS imaging from the S-COSMOS survey (PI Sanders).
2.2 Sample selection
We have adopted the sample of Bruce et al. (2014a), which comprises a refined sub-sample from the and CANDELS UDS sample of Bruce et al. (2012) (now making use of an updated stellar-mass fitting technique) and a similarly-selected sample in the CANDELS COSMOS field. Photometric redshifts were estimated using a code based on HYPERZ from Bolzonella et al. (2000), following Cirasuolo et al. (2007) and were subsequently used to determine stellar-mass estimates. The stellar-mass estimates were based on the Bruzual & Charlot (2003) models with single-component exponentially-decaying star-formation histories with e-folding times in the range and with a minimum model age limit of 50 Myr. Our final sample contains 205 galaxies in the UDS and 191 galaxies in COSMOS with and . As the sample sizes and areas in the UDS and COSMOS fields are comparable and there is good agreement between the co-moving number densities of the two fields (Bruce et al. 2014a), in the following sections the science results are based on the combined UDS and COSMOS sample unless otherwise stated.
2.3 Star-formation rates
Finally, the star-formation rates for the UDS and COSMOS samples were estimated from the best-fit SED models and m fluxes by adopting the convention of Wuyts et al. (2011) where, if any of the objects in the sample have a m counterpart within a 2-arcsecond radius in the SpUDS and S-COSMOS catalogues, their star-formation rate is given by: where and the contribution to is taken over the wavelength range m. For objects which do not have m counterparts, a value of: is adopted (Kennicutt, 1998).
For completeness, we have also compared our distinction of passive and star-forming galaxies based on to those from UVJ colour-cuts following Williams et al. (2009) and find that the two methods agree well.
3 Multiple-Component Morphology Fitting
Following Bruce et al. (2014a), the morphologies of the 396 objects in our combined sample have been fitted with both single and multiple-Sérsic light profiles using GALFIT (Peng et al., 2010). This procedure makes use of an empirical PSF generated from a median stack of the brightest (unsaturated) stars in the individual fields and adopts a consistent object-by-object background determination, which has been calculated as the median value within an annular aperture centred on each source with an inner radius of 3 arcsec and an outer radius of 5 arcsec. GALFIT is then run on arcsec image stamps.
In addition to more basic single-Sérsic light-profile fits, we have also conducted a multiple-component Sérsic light-profile decomposition by fitting two sets of nested models to each object in our sample: 2 single-Sérsic models; n=free and n=free + PSF; and 6 multiple-component models; n=4 bulge, n=1 disk, n=4 + PSF, n=1 + PSF, n=4 + n=1 and n=4 + n=1 + PSF, where the PSF is included to account for any centrally concentrated light profile components such as nuclear starbursts or AGN. These multiple component models were run with a grid of different initial conditions to ensure that the fitting was robust against the -minimisation routine becoming confined to local minima.
The best-fit multiple-component models within each of these nested sets were then determined by adopting the simplest model unless a more complex model fit was deemed statistically acceptable, as defined by: , and if it satisfied , where represents the number of degrees of freedom in the model (in effect the number of parameters), and is the 3- value for the given difference in the degrees of freedom between the two competing fits. In addition to these criteria several additional constraints were applied to ensure that the best-fit models were physically realistic. This approach provided statistically acceptable multiple-component models for of the combined sample.
3.1 Mock galaxy simulations
In order to estimate the random and systematic uncertainties on our fitted morphological parameters we have conducted tests using simulated galaxies. Full details of the simulations and accompanying results are presented in Bruce et al. (2014a). In summary, we find that the we are able to recover ratios to within accuracy for of objects, without any significant systematic bias. We also report that component sizes are robust to an accuracy of , including systematic errors. However, we note that these are conservative estimates of uncertainties; disk components can be recovered more accurately and there is also a trend for models with smaller component sizes to be fitted with lower random and systematic uncertainties. It should also be noted that the accuracy with which we have been able to determine these fitted parameters relies heavily on the high of the imaging data for our galaxy sample (typically ).
We have also utilised the mock galaxy simulations in Bruce et al. (2014a) to explore the effects of allowing a PSF component in the fitting. Here we discuss the cases where our best-fit single-Sérsic fits have (with or without a fitted PSF component) in order to ascertain when GALFIT fits these un-physically high values.
Out of 174 of these galaxies, we find that have one component with an effective radius of 1 pixel and the other with effective radius 20 pixels (the two extreme sizes modelled). By construction, only of all our models have this configuration. Within this subset are from input models where the disk and the remaining have bulge . Given the relatively small number statistics it is difficult to make robust statements, but it does not appear that these fits have any preferential light fraction, axis ratios, relative position angles or an increased probability of being fitted with a single-Sérsic+PSF model. Thus, it appears as though the unphysically high fits are a result of systems with large differentials in component sizes, which cannot be well-fit with a single Sérsic light profile.
Given that we retain all the single and multiple-component fits, it is also interesting to look at all the models which had an initial single-Sérsic fit, but where the best-fit then adopted a PSF component. Out of 312 of these initial single-Sérsic fits, (151 objects) were then best-fit by Sérsic+PSF, and only 13 objects with these Sérsic+PSF best-fits retained an .
Thus, our simulations confirm our assertion (Bruce et al., 2012) that the adoption of Sérsic+PSF best-fit models are motivated by the inability of single-Sérsic fits to fully account for multiple components. The significance of the multiple-Sérsic+PSF best-fit models are discussed in detail in Bruce et al. (2014a).
3.2 Extension to additional bands and decomposed SED fitting
Having established bulge-disk decomposed morphological fits for all the objects in the combined UDS and COSMOS sample, in Bruce et al. (2104a) we were then able to extend this analysis to the other three bands available within CANDELS: , and and conduct separate component SED fitting on the decomposed photometry (where the SED fits were further constrained at the extreme blue and red ends by the overall photometry for the objects) . The full details of this procedure are presented in Bruce et al. (2014a) and here we highlight that this technique does not rely on the adoption of any functional forms to describe how the morphologies of these massive galaxies vary as a function of redshift, but instead, fixes all morphological parameters at the -band best-fit values. This simplified approach accounts for colour gradients within the bulge+disk systems by allowing the bulge and disk component magnitudes to trade-off against each other and yields realistic colours for the bulge and disk components without any further constraints.
This decomposition technique provides several clear advantages. By providing individual stellar-mass and star-formation rates for the separate components (where burst and exponentially decaying star-formation history templates with can now be fitted due to the additional degrees of freedom included from the bulge-disk decomposition) we are able to: i) explore the fully decomposed bulge and disk size-mass relations; ii) study the trends with star-formation rate for the separate bulge and disk components, which has provided new insight into the links between quenching and size evolution; iii) given our sample selection, the decomposition also allows us to probe the lower mass envelopes of the individual components.
4 Results
4.1 Correlation Between Single and Multiple-Component Model Morphologies
Having conducted the detailed morphological decomposition described above, and extended this analysis across the four-band wavelength range available from CANDELS, we were then able to compare the overall morphologies fitted by the single-component and the multiple-component fitting techniques. This comparison is shown in Fig. 1, which demonstrates the good correlation between the Sérsic indices fitted from the single-component models and the bulge/total () light fraction ratios from the -band multiple-component decompositions. Overall there is a reasonable one-to-one correlation between the light fractions from the multiple-component decompositions and the fitted single-Sérsic indices (although there is significant scatter), and the Sérsic index cut at to distinguish between bulge and disk-dominated galaxies closely corresponds to a cut at , with only a few cases where galaxies have and or but .


In fact, part of this scatter can be explained by the fact that the light fractions are plotted as the bulge/total fraction, where the total light can contain contributions from a PSF. In this case total=(bulge+disk+PSF), which is not the same as bulge+disk light. For comparison, bulge/bulge+disk fractions are plotted in Fig. 2, where objects which have a best-fit multiple-component model with a PSF component are highlighted in blue. Adopting this bulge/bulge+disk ratio helps to remove some of the scatter towards high Sérsic indices but low bulge fractions. In the cases where best-fits contained a PSF, the bulge/total ratios fall as the PSF component has replaced some of the contribution which would otherwise be modelled by the bulge, and the Sérsic indices are higher because a simple de Vaucouleurs profile no longer provides an adequate fit to these centrally concentrated objects. Thus, for these systems plotting bulge/bulge+disk light ratios arguably provides a characterisation of bulge dominance which is easier to interpret. By highlighting those objects with a significant PSF component (), Fig. 2 also reconciles the single and multiple-component fits for the 2 objects which have with as it can now be easily seen that these fits have a PSF component. Hence, whilst they have no bulge component these are not “pure” disk systems, but have a centrally concentrated light component modelled in the multiple-component analysis by a PSF and in the single-component fits by a high Sérsic index. For completeness, we have also examined the correlation between the mass fractions and . In this case, adopting fractions based on stellar-mass estimates generally increases the contribution from the bulge component, as expected given the different stellar populations comprising the bulge and disk components, but otherwise does not lessen the agreement between the single-Sérsic index light-based morphological indicator and the decomposed mass-based discriminator.
The examination of the correlation between single-Sérsic indices and bulge/total light fractions and decomposed stellar-mass estimates, confirms that in the majority of cases the single-Sérsic index discriminator at describes the overall morphologies of these most massive galaxies relatively well, as it provides a good proxy for both light and mass-based measures of .
4.2 Size-Mass Relations
The results from the multiple-component decomposition have allowed us to explore how the size-mass relations for the separate bulge and disk components evolve with redshift by accurately decomposing their masses from the multiple-component SED fitting. However, before this is discussed, it is first interesting to explore how the size-mass relations constructed by splitting the mass of each galaxy into each of its separate components according to their contributions to the -band light compare to the results presented in Bruce et al. (2012), which used the CANDELS UDS sample alone. The combination of the UDS and COSMOS samples is plotted in Fig. 3 and, following the convention in Bruce et al. (2012), these plots show the size-mass relations for all bulge components in the top panels and disk components in the bottom panels. They are further split by redshift, where the full redshift range () is displayed in the far left panels, in the middle and in the right-hand panels. The bulge relations have been over-plotted with the local Shen et al. (2003) ETG relation in red, with its scatter, and the disk components by the local LTG relation and its scatter, where these relations have been corrected to un-circularised values following the prescriptions outlined in Bruce et al. (2012). In these plots we only display components with , as below this mass the components become sufficiently faint that they may introduce potential biases to the morphological properties fitted, therefore they have been removed from these plots to avoid over-interpretation of sub-components.
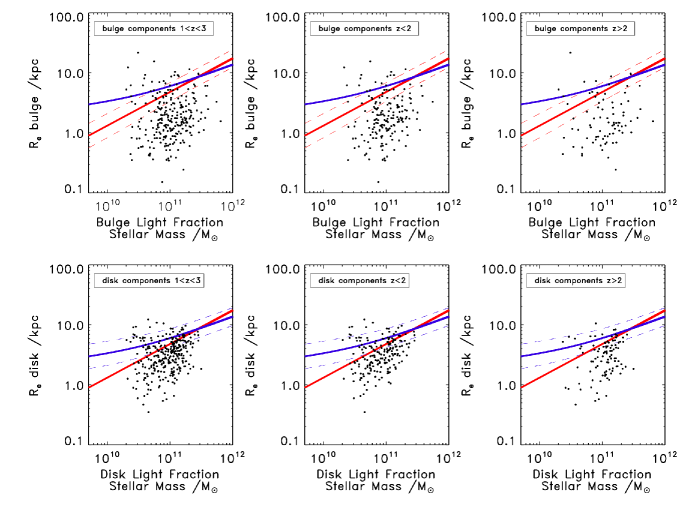
It is clear from Fig. 3 that the trends reported for the UDS sample are also in place in the COSMOS field, where again we find that the bulge components of massive galaxies display a stronger size evolution with redshift than the disk components. The majority of bulge components have sizes which place them well-below their corresponding local relation, whereas the disk components show a smaller scatter in size with an increased fraction of disks displaying sizes consistent with similarly massive local systems. These results also support the claim of a lower envelope of sizes which scales with mass broadly parallel to the local relation.
The scatter in the size-mass relation of the bulge and disk components is higher than would be expected from the estimated uncertainties in our size and mass measurements, thus implying a significant intrinsic scatter.
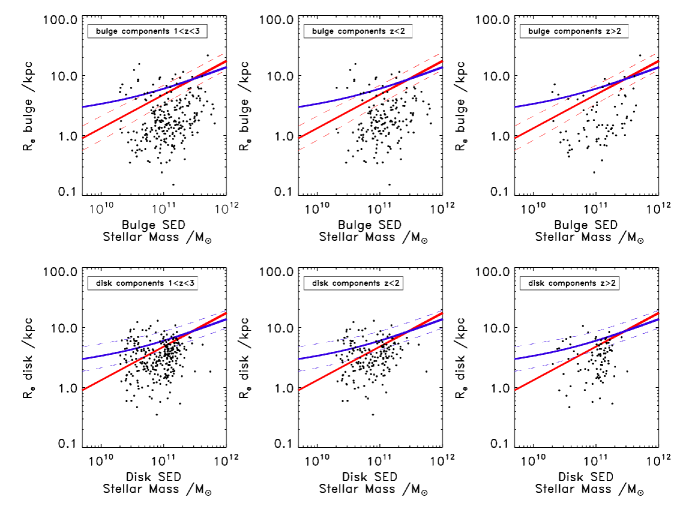
We now move on to consider the size-mass relations based on the separate component masses estimated from SED fitting. These results are presented in Fig. 4. Comparison between these size-mass relations and those plotted in e.g. Fig. 3 reveals no significant change in the reported relations for either the bulge or disk components. This suggests that the simplified approach of attributing masses to each component based on their contributions to the -band light fractions provides, at least on average, a good proxy for SED fitted stellar-mass decompositions.
This stellar mass decomposition confirms all of the morphological trends revealed by the previous light-fraction decomposed size-mass relations, including the stronger evolution witnessed for bulge components over disks, both in terms of the number of bulges which fall below their respective local relations, and in the median sizes of the populations in both the and redshift bins. These results are summarised in Table 1, which shows that, within the errors, these trends are consistent across both fields, and are in agreement with the statistics quoted in Bruce et al. (2012) for the size-mass relations from masses based on -band light fractions for the UDS field alone. Again, the uncertainties on these values do not allow us to draw any robust conclusions about the change in these fractions with redshift, although we do note that the CANDELS-COSMOS sample contains a larger number of bulge-dominated objects at which is responsible for the rise of bulges with sizes comparable to local ETGs within this redshift bin. This could be produced by a systematic error (focussing) in the determination of the photometric redshifts. However, the effects of redshift focussing have been studied in both fields with the (albeit low numbers of) spectroscopic redshifts available, but we find no strong evidence for this effect amongst the bulges and conclude that this larger abundance of high-redshift bulges in the CANDELS-COSMOS field may be due to an interception of genuine structure in the COSMOS field (although no obvious spatial clustering of these objects is seen).
| COSMOS | bulges on | |||
| bulges below | ||||
| disks on | ||||
| disks below | ||||
| UDS | bulges on | |||
| bulges below | ||||
| disks on | ||||
| disks below | ||||
| Combined | bulges on | |||
| bulges below | ||||
| disks on | ||||
| disks below |
From this discussion it is evident that the adoption of the more rigorous SED decomposed component masses, over the -band light fraction mass decompositions, has not significantly influenced the positions of components in their respective size-mass relations, nor altered the basic trends reported. However, the full SED stellar-mass decomposition not only provides robust individual component masses, but also delivers estimates of the star-formation activity of each object.
4.3 Star-formation trends
Early size-mass studies (e.g. Kriek et al. 2006; Toft et al. 2007) reported a correlation between compactness and passivity which has since gained substantial support in the literature, but these studies are not only limited to morphological classifications based on single-Sérsic index fits but also (with the exception of IFU spectroscopic studies) global star-formation rates. In this respect, the advantage of our full SED multi-band decomposition technique becomes clear, as it has allowed us to estimate the SFR for each individual bulge and disk component.
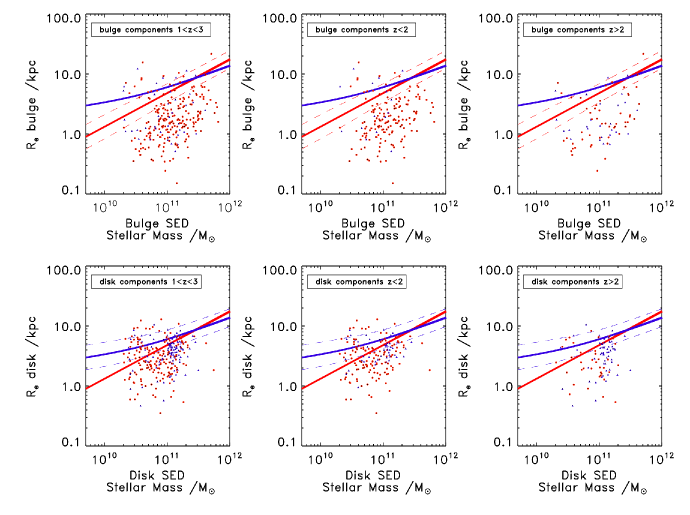
In Fig. 5, we now show the size-mass relations plotted with the SED-fitted decomposed stellar masses are now coloured by their individual component star-formation rates, where for simplicity we have adopted the discrimination between star-forming and passive components and plot the passive components in red and the star-forming components in blue. These size-mass plots, containing separate component star-formation information, are shown in Fig. 5. These plots do not immediately display a clear division between the sizes of passive and star-forming components, but instead reveal that a fraction of the most compact bulges and disks display signs of continued star-formation, while some of the largest bulges and disks are classified as passive. The evolution of bulge and disk components split into their star-forming and passive populations is studied in more detail in the following section by exploring how the median sizes of each sub-population, given as a fractional size of their local counter-parts, evolve with redshift.
| sf bulges on | |||
| sf bulges below | |||
| sf disks on | |||
| sf disks below | |||
| passive bulges on | |||
| passive bulges below | |||
| passive disks on | |||
| passive disks below |
4.4 Fractional Size Evolution
In order to better explore the evolution of bulge and disk components split into their star-forming and passive populations, the fractions of each population which display sizes consistent with or below their respective local relations are given in Table 2, along with the offsets of the median sizes of these populations from their local relations in Table 3. For clarity all bulges have been compared with the local ETG relation, and disks with the local LTG relation (Shen et al., 2003).
These results reveal that the sizes of passive and star-forming bulges are consistently compact, within the errors, and that star-forming disks are significantly larger. However, they also show that passive disks have intermediate sizes, larger than their passive bulge counterparts, but smaller than the disks which remain active. To better explore these results we have calculated the sizes of these sub-divided populations as a fraction of the present-day sizes of similarly massive galaxies, using the median fractional sizes of all objects. This assumes that the slope of the size-mass relation is constant over (e.g. McLure et al. 2013; van der Wel et al. 2014). These fractional sizes for the bulge and disk components from the full SED-fitting decomposition are shown in Fig. 7. This confirms the trends determined from the size-mass relation plots, but also allows for a more direct and intuitive comparison of component sizes split into star-forming and passive populations at different redshifts. In Fig. 6 we have also included the fractional size evolution as determined from the single-Sérsic fitting, as all previous light-profile fitting size-mass studies have relied on this parameter to distinguish between bulge and disk-dominated systems. Thus, it allows not only a direct comparison with previous literature results, but also with the multiple-component SED-fitting decomposition results and so serves to highlight the additional insight which can be gained from adopting the decomposition method for galaxy size measurements.
| 3 | 2 | 3 | |
|---|---|---|---|
|
bulge
components |
|||
|
star-forming
bulges |
|||
|
passive
bulges |
|||
|
disk
components |
|||
|
star-forming
disks |
|||
|
passive
disks |
Starting with Fig. 6 for the single-Sérsic fitting technique, where disk-dominated galaxies are classified as following the convention of Shen et al. (2003) and bulges as , we found that the size of passive bulges, passive disks and active bulges are all consistent within their errors and are similarly compact, but that star-forming disks are significantly larger. This can clearly be seen in Fig. 6, where we have over-plotted as the dotted line the size evolution for ETGs as fitted by van der Wel et al. (2008), given by , and as the dashed line the fitted size-evolution of the decomposed star-forming disks (top-right panel of Fig. 7) , as given by .
These trends are consistent with previous studies such as McLure et al. (2013), but raise questions over the mechanisms by which star-forming galaxies quench and also significantly reduce in size to form the passive-disk population. One possible reason for this apparent discrepancy may be that the passive-disk galaxies are more bulge-dominated than the star-forming disks, and are therefore biased to smaller sizes in this comparison.
In order to test this we have explored the Sérsic index distributions of both the passive and star-forming disks and do find that using a cut at , the passive disks are centred on a higher n values than the star-forming disks. As a result, we have experimented with decreasing the Sérsic index value used as the discriminator between bulges and disks, in an attempt to ensure that in order to be classified as passive disks these galaxies are as disk-dominated as possible. By decreasing the Sérsic index cut to and we find a better agreement between the Sérsic index distributions for the passive and star-forming disks (although the passive disks are still centred on slightly higher values of ), but this does not affect the derived fractional sizes of this population. Thus, from the single-Sérsic fitting technique one would always find that the star-forming disks are substantially larger than the passive disks, and in fact that the passive disks have sizes comparable to the star-forming and passive bulges.
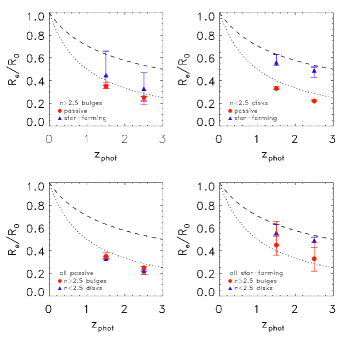

Adopting the multiple-component SED-fitting decompositions yields the fractional size evolutions displayed in Fig. 7, which have again been over-plotted with the van der Wel et al. (2008) ETG () and the fitted star-forming disk () relations. This shows similar size evolution for the bulge components and star-forming disks, but now reveals that the passive disks now have an intermediate size, between the passive and star-forming bulges and the star-forming disks.
It is possible that the inclusion of all passive disk components in this sample introduces some effects associated with the lower masses that are being probed, as for the single-Sérsic index fits all bulges or disks have stellar masses , but the decomposed component masses can range as low as . For these low-mass components we then compared their sizes to similarly massive local galaxies via the Shen et al. (2003) LTG relation, but in this case we are comparing the size of a low-mass disk component of a much more massive bulge-dominated galaxy to a low-mass disk-dominated system at low redshift, which may bias the fractional size measurements of these galaxies to higher values. However, to account for this we examined these relations using only the bulge component of bulge-dominated galaxies and the disk component of disk-dominated galaxies. Whilst the adoption of this subset does not significantly affect the fractional sizes of the bulges or star-forming disks, it does reduce the size of the passive disks, although not by an amount which makes them consistent with the single-Sérsic index passive galaxies. Hence, even though there may be some effect from low-mass sub-components which drives the passive disks to larger sizes, it is not the dominant reason for the increase in passive disk sizes from the multiple-component SED-fitting decomposition, and we are left to conclude that the more accurate decomposition of both individual component stellar masses and star-formation rates reveals a potential bias in the results from the single-Sérsic index fitting technique, with passive disk components genuinely having an intermediate size.
5 Discussion
5.1 Comparison to results in the literature
Despite the profusion of morphological studies of massive galaxies over the past 5-10 years, these studies have adopted a number of different selection criteria and are often biased towards selecting passive or early-type systems. As a result, it has been difficult to disentangle the trends for galaxies with early-type (ETG) morphologies to be more compact than late-type (LTG) systems, and for passive galaxies to be more compact than those which display on-going star-formation. In order to conduct a robust and direct comparison between the size evolution of bulge and disk-dominated galaxies, sub-divided further into their passive and star-forming populations, it is important to adopt an unbiased, mass-selected sample, as has been done for this work. Here we limit comparison of our results to several of the most notable studies which have well-defined samples and stellar-mass and size determination procedures most directly comparable with our own.
We first draw a comparison between our single-Sérsic fits and the study of Buitrago et al. (2008) conducted at for 82 galaxies with NICMOS HST imaging. In this study, Buitrago et al. split their sample into bulge and disk-dominated systems using a Sérsic index cut at and find that, on average: the disks have a fractional size ; and bulge systems with have . Within the errors, these results are consistent with our sample using the similarly modelled single-Sérsic fits, where as discussed previously, cutting our sample at the lower limit does not affect the median fractional sizes that we determine.
We can also compare with the study of McLure et al. (2013) for , galaxies in the UDS covered in the K-band by UKIDSS UDS, and with spectra from FORS2. McLure et al. (2013) split their mass-selected sample by both morphology, above and below , and in terms of the overall galaxy star-formation activity. They report that, at this redshift, disks have a median and bulges have . Whereas, splitting by star-formation activity, their passive galaxies have a median and the star-forming sample have a median .
McLure et al. (2013) comment that the apparent difference in size between their star-forming and disk samples may be due to the contribution of a significant fraction of passive disks to the median size offsets. In comparison, both our single-Sérsic and multiple-component fits are roughly consistent with the results from this study, although we note that the fractional sizes of the McLure et al. (2013) star-forming and passive samples are more consistent with our multiple-component fits than our single-Sérsic results. This may in part be due to the fact that although McLure et al. adopt the same passivity criterion, their adoption of “double-burst” star-formation histories during SED fitting, may account for the better agreement between their passive and star-forming fractional size measurements and our decomposed fits (which have also allowed multiple star-formation history components for each galaxy).
We next compare our results to the study of Toft et al. (2007), which was among the first to note the correlation between galaxy passivity and compactness. The Toft et al. (2007) study was conducted at using HST NICMOS and ACS imaging, and classified galaxies as active or passive depending on whether or not the SED fits to the galaxies were better modelled by constant or burst star-formation histories, and were then cross-checked with m data. Toft et al. (2007) report that : at passive galaxies have and star-forming galaxies have .
Again, these results are broadly consistent with the passive and star-forming fractional size estimates from both our single-Sérsic and decomposed fits within the errors, especially given the different classifications adopted for star-forming and passive galaxies and that the Toft et al. (2007) sample spans a much wider, and lower mass range (). It should also be noted that the Toft et al. (2007) passive sample has a Sérsic index distribution centred on , with of objects being better fit with rather than light profiles.
Finally, in order to complete the literature comparison we consider the study of Cimatti et al. (2008) at for a spectroscopically confirmed passive GMASS sample imaged with HST NICMOS and ACS.Cimatti et al. (2008) split their sample into two redshift bins and report that at their passive galaxies have a median and at . Again, these results are in general agreement with our single-Sérsic fits, but in this case, as to some extent with the study of Toft et al. (2007), a departure between the size of passive disks and those of the passive bulges begins to become more apparent.
From this comparison with previous studies which have split their sample according to (or various combinations of): i) ; ii) ; iii) photometrically or spectroscopically determined star-formation rates, there is clear evidence for the trends for: i) passive galaxies at any redshift to be more compact than star-forming galaxies, ii) ETGs () at any redshift to be more compact than LTGs (); iii) star-forming galaxies to display a shallower size evolution with redshift than passive galaxies. However, the intermediate sizes of passive disks only become fully apparent from the morphological decompositions presented in this work.
As a consequence, this suggests that compactness may correlate with some combination of passivity and the presence of a significant bulge component in the galaxy.
5.2 Insights into galaxy evolution
By extending our multiple-component light-profile fitting to multi-band photometry and SED fitting to provide individual component masses and star-formation rates, we have directly shown that the median sizes of passive disks are smaller than those of star-forming disks, which raises questions of how these star-forming disks evolve into the passive population. In order to better understand this evolution, it is important to note that it is not necessarily physically meaningful to compare the sizes of passive and star-forming disks at the same redshifts. In a secular evolution scenario we expect the star-forming disks to evolve into the passive population, therefore it is more meaningful to compare the star-forming disks at higher redshifts to passive disks at lower redshifts. In order to conduct this comparison we have used the SED fits of the passive disks to reverse engineer their fitted star-formation histories back to the point at which they would last be classified as star-forming, given our criterion, and determine the time that the component has been quenched as the difference between the age of the galaxy at the best-fit redshift and the time when it was last active. We find that the majority of components were last active Gyr before the epoch of observation. Therefore, in order to best compare between the sizes of passive disks and their star-forming progenitors, the comparison should be conducted between passive disks at their current redshift and star-forming disks at redshifts which correspond to Gyr earlier. This is shown in Fig. 8, where the fitted star-forming disk relation has been re-plotted for redshifts corresponding to Gyr earlier and can be directly compared to the sizes of the passive disks. From this plot it can be concluded that the sizes of the passive disks at are consistent with their star-forming progenitors. It is also worth noting that the most recently quenched disks, (last active Gyr earlier), have a median size of kpc, which is larger than the median of kpc for the whole passive disk population. This lends further support to the assertion that the size offset between the passive and star-forming disks can be accounted for by the relation between size and the redshift of quenching.


The distributions of the masses in the disk components of these disk-dominated passive galaxies and their star-forming progenitors are shown in Fig. 9, alongside the distributions of the total galaxy masses. The disk component masses of the passive and star-forming disks have a rather low probability of being drawn from the same distribution ( from a K-S test), with the star-forming disks appearing to have a distribution centred on slightly higher stellar masses, while the total galaxy mass distributions are more comparable (). Any potential evidence for the star-forming disk components being more massive than the passive disk components which they evolve into is in fact consistent with the secular quenching scenario as the evolution of these systems may be accompanied by a transfer of mass from the disk to the bulge components (e.g. Bournaud et al. 2011), which would reduce the mass in the disk components but leave the total galaxy mass unchanged. Whether the processes which quench star-formation are secular or merger driven, these observations challenge models to account for this mass evolution and both the presence of massive, quenched disks and their sizes.
When considering the size evolution of all the individual components it is interesting to address the current claims in the literature that the size evolution of passive galaxies from to the present day can be better explained by the addition of newly-quenched, larger galaxies to this population with time (where the size of newly-quenched, younger, galaxies scales with the average density of the Universe at the epoch when they quenched) (e.g. Valentinuzzi et al. 2010b; Cassata et al. 2011; Poggianti et al. 2013a, b; Cassata et al. 2013; Carollo et al. 2013; Krogager et al. 2013), than by the evolution in size of individual galaxies. One of the natural predictions of this scenario is the star-formation dependent size of both bulge and disk components, as at any given epoch the star-forming components are expected to be larger, given the fact that they have not yet quenched but do so at later times. While there is evidence for this trend in the disk components, we do not find strong evidence for a size offset between the passive and active bulges, as has been previously reported by, for example, Carollo et al. (2013), albeit for lower-mass systems. However, as discussed in Bruce et al. (2014a), the star-forming bulge population is subject to significant contamination from sub-dominant active disks, and the scatter in the sizes of these components is large.
Finally, we discuss the sizes of our passive disks and star-forming bulges within the context of the evolution scenario suggested by Barro et al. (2013a, b) and Dekel & Burkert (2014). These studies propose that extended star-forming disks at high redshifts first undergo gas rich dissipational major mergers or experience violent disk instabilities, which both shrink their sizes and transform them from disk to bulge systems, and are then subsequently quenched (with passive bulges later growing in size via e.g. minor mergers). The compact sizes of our star-forming bulges are compatible with this scenario if these systems having undergone disk-bulge transformations, have shrunk, but have not yet quenched. However, while this basic model resulting in size shrinking followed by quenching, which by extension proposes that all quenched systems are equally compact, can, at least qualitatively, explain the existence and sizes of star-forming bulges, this is not true for passive disks, which have not undergone morphological or size transformations. This disk population can instead only be explained by secular quenching processes such e.g. halo quenching or ram pressure stripping, which do not transform the underlying morphology or sizes of the systems. This further highlights the necessity of models to account for the fact that compactness is here observed to correlate with both passivity and the presence of a bulge if they are to build a fully consistent scenario.
6 Conclusions
We have made use of the extended multiple-component bulge+disk morphological decomposition technique presented in Bruce et al. (2014a), which allowed us to conduct multiple-component SED fitting and has provided us with stellar-mass and star-formation rate estimates for the separate components. By combining these estimates with the decomposed morphological information we have explored the evolution of the most massive () galaxies at in terms of the trends witnessed in the size-mass relation and from the median sizes of these systems split by both morphology and star-formation activity.
Having conducted this analysis we have been able to examine the size-mass relations from the combined UDS and COSMOS samples and the relations which utilised the new decomposed stellar-mass estimates, and have found continued evidence that the bulge components display a stronger evolution in the size of the population compared to similarly massive local galaxies than the disk components. This can be seen from both the fraction of bulge components which lie below the local relation and the median sizes of the bulge components split above and below .
We have also found that, at , of bulges have sizes consistent with the local ETG relation within its scatter, with the median bulge component sizes being a factor of smaller than similarly massive local ETGs. At this fraction of bulges with sizes comparable to the local ETG relation becomes and median bulge component size is a factor of smaller than local ETGs. In comparison, at , of the disk components have sizes consistent with the local LTG relation and its scatter, and the median size is a factor of smaller. In the high-redshift bin these numbers become and the median size is a factor of smaller. The scatter in both the bulge and disk relations is larger than the measurement error and thus reflects the intrinsic scatter in the size-mass relations. However, by incorporating the new star-formation rate estimates from the decomposed SED fitting we do not find a clear distinction in the position of the passive and star-forming components on the size-mass relations.
In order to further explore how the star-formation activity correlates with galaxy size we have examined the sizes of the galaxies in our sample as a fraction of the sizes of local similarly massive galaxies, split into the passive and star-forming bulge and disk sub-populations and plotted above and below . By constructing these samples based on both the single-Sérsic fits with the overall star-formation rates, and using the decomposed morphologies and star-formation rates, we have highlighted the advantages in decomposing these galaxy properties. This analysis reveals that, while the single-Sérsic fits would indicate that the star-forming and passive bulges, and passive disks are equally compact in size (although the robustness of the star-forming bulge sample is questionable due to the high level of contamination from star-forming disk components; Bruce et al. 2014a) with the star-forming disks having larger sizes, the decomposed fits show that the passive disks have intermediate sizes. As the single-Sérsic fractional sizes are in broad agreement with results from previous studies, this clearly demonstrates that adopting the single-Sérsic fits presents a simplified view of the evolutionary processes involved, where for bulge-dominated systems morphology is the main indicator of compactness and for disks the main indicator is star-formation. In comparison, the decomposed fits reveal that compactness correlates with some combination of passivity and the presence of a significant bulge component.
Moreover, by assuming that the star-forming disks are the direct progenitors of the passive disks, and by evolving the star-formation histories of the passive disks back to the redshifts Gyr earlier, when the passive disks were still active, we have shown that the passive disks and their star-forming progenitor disks have consistent sizes.
7 Acknowledgments
VAB acknowledges the support of the Science and Technology Facilities Council (STFC) via the award of an STFC Studentship. VAB and JSD acknowledge the support of the EC FP7 Space project ASTRODEEP (Ref. No: 312725). JSD, RAAB, FB, TAT acknowledge the support of the European Research Council via the award of an Advanced Grant. JSD and RJM acknowledge the support of the Royal Society via a Wolfson Research Merit Award and a University Research Fellowship respectively. RJM acknowledges the support of the Leverhulme Trust via the award of a Philip Leverhulme Research Prize. MC acknowledges the support of the Science and Technology Facilities Council (STFC) via the award of an STFC Advanced Fellowship. US authors acknowledge support from NASA grants for HST Program GO-12060. SMF, DCK, DDK, and EJM also acknowledge support from NSF grant AST-08-08133.
This work is based in part on observations made with the NASA/ESA Hubble Space Telescope, which is operated by the Association of Universities for Research in Astronomy, Inc, under NASA contract NAS5-26555. This work is based in part on observations made with the Spitzer Space Telescope, which is operated by the Jet Propulsion Laboratory, California Institute of Technology under NASA contract 1407.
References
- Allen et al. (2006) Allen P. D., Driver S. P., Graham A. W., Cameron E., Liske J., de Propris R., 2006, MNRAS, 371, 2
- Barden et al. (2012) Barden M., Häußler B., Peng C. Y., McIntosh D. H., Guo Y., 2012, MNRAS, 422, 449
- Barro et al. (2013a) Barro G. et al., 2013a, ApJ, 765, 104
- Barro et al. (2013b) Barro G. et al., 2013b, ApJ, submitted (arXiv:1311.5559)
- Belli et al. (2014) Belli S., Newman A. B., Ellis R. S., 2014, ApJ, 783, 117
- Bolzonella et al. (2000) Bolzonella M., Miralles J., Pelló R., 2000, A&A, 363, 476
- Bournaud et al. (2011) Bournaud F., Dekel A., Teyssier R., Cacciato M., Daddi E., Juneau S., Shankar F., 2011, ApJL, 741, L33
- Bruce et al. (2012) Bruce V. A. et al., 2012, MNRAS, 427, 1666
- Bruce et al. (2014) Bruce V. A. et al., 2014, MNRAS, submitted (arXiv:1405.1736)
- Bruzual & Charlot (2003) Bruzual G., Charlot S., 2003, MNRAS, 344, 1000
- Buitrago et al. (2008) Buitrago F., Trujillo I., Conselice C. J., Bouwens R. J., Dickinson M., Yan H., 2008, ApJL, 687, L61
- Buitrago et al. (2013) Buitrago F., Trujillo I., Conselice C. J., Häußler B., 2013, MNRAS, 428, 1460
- Cameron et al. (2009) Cameron E., Driver S. P., Graham A. W., Liske J., 2009, ApJ, 699, 105
- Carollo et al. (2013) Carollo C. M. et al., 2013, ApJ, 773, 112
- Cassata et al. (2010) Cassata P. et al., 2010, ApJL, 714, L79
- Cassata et al. (2011) Cassata P. et al., 2011, ApJ, 743, 96
- Cassata et al. (2013) Cassata P. et al., 2013, ApJ, 775, 106
- Cimatti et al. (2008) Cimatti A. et al., 2008, A&A, 482, 21
- Cirasuolo et al. (2007) Cirasuolo M. et al., 2007, MNRAS, 380, 585
- Daddi et al. (2005) Daddi E. et al., 2005, ApJ, 626, 680
- Damjanov et al. (2009) Damjanov I. et al., 2009, ApJ, 695, 101
- Davari et al. (2014) Davari R., Ho L. C., Peng C. Y., Huang S., 2014, ApJ, 787, 69
- de Jong (1996) de Jong R. S., 1996, A&A, 313, 45
- Dekel & Burkert (2014) Dekel A., Burkert A., 2014, MNRAS, 438, 1870
- Fan et al. (2010) Fan L., Lapi A., Bressan A., Bernardi M., De Zotti G., Danese L., 2010, ApJ, 718, 1460
- Fan et al. (2008) Fan L., Lapi A., De Zotti G., Danese L., 2008, ApJL, 689, L101
- Franx et al. (2008) Franx M., van Dokkum P. G., Schreiber N. M. F., Wuyts S., Labbé I., Toft S., 2008, ApJ, 688, 770
- Furusawa et al. (2008) Furusawa H. et al., 2008, ApJS, 176, 1
- Grogin et al. (2011) Grogin N. A. et al., 2011, ApJS, 197, 35
- Häussler et al. (2007) Häussler B. et al., 2007, ApJS, 172, 615
- Hopkins et al. (2009) Hopkins P. F., Cox T. J., Younger J. D., Hernquist L., 2009, ApJ, 691, 1168
- Kennicutt (1998) Kennicutt, Jr. R. C., 1998, ARA&A, 36, 189
- Khochfar & Silk (2006) Khochfar S., Silk J., 2006, ApJL, 648, L21
- Koekemoer et al. (2007) Koekemoer A. M. et al., 2007, ApJS, 172, 196
- Koekemoer et al. (2011) Koekemoer A. M. et al., 2011, ApJS, 197, 36
- Kriek et al. (2009) Kriek M., van Dokkum P. G., Franx M., Illingworth G. D., Magee D. K., 2009, ApJL, 705, L71
- Kriek et al. (2006) Kriek M. et al., 2006, ApJL, 649, L71
- Krogager et al. (2013) Krogager J.-K., Zirm A. W., Toft S., Man A., Brammer G., 2013, ApJ, submitted (arXix:1309.6316)
- Lackner & Gunn (2012) Lackner C. N., Gunn J. E., 2012, MNRAS, 421, 2277
- Lang et al. (2014) Lang P. et al., 2014, ApJ, accepted (arXiv:1402.0866)
- Lawrence et al. (2007) Lawrence A. et al., 2007, MNRAS, 379, 1599
- Mancini et al. (2010) Mancini C. et al., 2010, MNRAS, 401, 933
- McLure et al. (2013) McLure R. J. et al., 2013, MNRAS, 428, 1088
- Mortlock et al. (2013) Mortlock A. et al., 2013, MNRAS, 433, 1185
- Mozena et al. (2013) Mozena M., Faber S. M., Koo D. C., Primack J. R., Dekel A., Moody C. E., Ceverino D., CANDELS, 2013, in American Astronomical Society Meeting Abstracts, Vol. 221, American Astronomical Society Meeting Abstracts, p. 112
- Muzzin et al. (2009) Muzzin A., van Dokkum P., Franx M., Marchesini D., Kriek M., Labbé I., 2009, ApJL, 706, L188
- Naab et al. (2007) Naab T., Johansson P. H., Ostriker J. P., Efstathiou G., 2007, ApJ, 658, 710
- Newman et al. (2012) Newman A. B., Ellis R. S., Bundy K., Treu T., 2012, ApJ, 746, 162
- Newman et al. (2010) Newman A. B., Ellis R. S., Treu T., Bundy K., 2010, ApJL, 717, L103
- Peng et al. (2010) Peng C. Y., Ho L. C., Impey C. D., Rix H.-W., 2010, AJ, 139, 2097
- Poggianti et al. (2013a) Poggianti B. M. et al., 2013a, ApJ, 762, 77
- Poggianti et al. (2013b) Poggianti B. M., Moretti A., Calvi R., D’Onofrio M., Valentinuzzi T., Fritz J., Renzini A., 2013b, ApJ, 777, 125
- Scoville et al. (2007) Scoville N. et al., 2007, ApJS, 172, 1
- Sekiguchi et al. (2005) Sekiguchi K., Akiyama M., Furusawa H., Simpson C., Takata T., Ueda Y., Watson M. W., Sxds Team, 2005, in Multiwavelength Mapping of Galaxy Formation and Evolution, A. Renzini & R. Bender, ed., p. 82
- Shankar et al. (2011) Shankar F., Marulli F., Bernardi M., Mei S., Meert A., Vikram V., 2011, MNRAS, submitted (arXiv:1105.6043)
- Shen et al. (2003) Shen S., Mo H. J., White S. D. M., Blanton M. R., Kauffmann G., Voges W., Brinkmann J., Csabai I., 2003, MNRAS, 343, 978
- Simard et al. (2011) Simard L., Mendel J. T., Patton D. R., Ellison S. L., McConnachie A. W., 2011, ApJS, 196, 11
- Szomoru et al. (2012) Szomoru D., Franx M., van Dokkum P. G., 2012, ApJ, 749, 121
- Szomoru et al. (2010) Szomoru D. et al., 2010, ApJL, 714, L244
- Taylor et al. (2010) Taylor E. N., Franx M., Glazebrook K., Brinchmann J., van der Wel A., van Dokkum P. G., 2010, ApJ, 720, 723
- Toft et al. (2007) Toft S. et al., 2007, ApJ, 671, 285
- Trujillo et al. (2012) Trujillo I., Carrasco E. R., Ferré-Mateu A., 2012, ApJ, 751, 45
- Trujillo et al. (2009) Trujillo I., Cenarro A. J., de Lorenzo-Cáceres A., Vazdekis A., de la Rosa I. G., Cava A., 2009, ApJL, 692, L118
- Trujillo et al. (2007) Trujillo I., Conselice C. J., Bundy K., Cooper M. C., Eisenhardt P., Ellis R. S., 2007, MNRAS, 382, 109
- Trujillo et al. (2006) Trujillo I. et al., 2006, ApJ, 650, 18
- Valentinuzzi et al. (2010a) Valentinuzzi T. et al., 2010a, ApJ, 712, 226
- Valentinuzzi et al. (2010b) Valentinuzzi T. et al., 2010b, ApJL, 721, L19
- van de Sande et al. (2013) van de Sande J. et al., 2013, ApJ, 771, 85
- van de Sande et al. (2011) van de Sande J. et al., 2011, ApJL, 736, L9
- van der Wel et al. (2012) van der Wel A. et al., 2012, ApJS, 203, 24
- van der Wel et al. (2009) van der Wel A., Bell E. F., van den Bosch F. C., Gallazzi A., Rix H.-W., 2009, ApJ, 698, 1232
- van der Wel et al. (2014) van der Wel A. et al., 2014, ApJ, in press (arXiv:1404.2844)
- van der Wel et al. (2008) van der Wel A., Holden B. P., Zirm A. W., Franx M., Rettura A., Illingworth G. D., Ford H. C., 2008, ApJ, 688, 48
- van der Wel et al. (2011) van der Wel A. et al., 2011, ApJ, 730, 38
- van Dokkum et al. (2008) van Dokkum P. G. et al., 2008, ApJL, 677, L5
- Williams et al. (2009) Williams R. J., Quadri R. F., Franx M., van Dokkum P., Labbé I., 2009, ApJ, 691, 1879
- Wuyts et al. (2012) Wuyts S. et al., 2012, ApJ, 753, 114
- Wuyts et al. (2011) Wuyts S. et al., 2011, ApJ, 738, 106