The structure of Abell 1351: a bimodal galaxy cluster with peculiar diffuse radio emission
Abstract
We aim to review the internal structure and dynamics of the Abell 1351 cluster, shown to host a radio halo with a quite irregular shape. Our analysis is based on radial velocity data for 135 galaxies obtained at the Telescopio Nazionale Galileo. We combine galaxy velocities and positions to select 95 cluster galaxy members and analyse the internal dynamics of the whole cluster. We also examine X-ray data retrieved from Chandra and XMM archives. We measure the cluster redshift, , the line-of-sight (LOS) velocity dispersion, km s-1, and the X-ray temperature, 9 keV. From both X-ray and optical data independently, we estimate a large cluster mass, in the 1–4 range. We attribute the extremely high value of to the bimodality in the velocity distribution. We find evidence of a significant velocity gradient and optical 3D substructure. The X-ray analysis also shows many features in favour of a complex cluster structure, probably supporting an ongoing merger of substructures in Abell 1351. The observational scenario agrees with the presence of two main subclusters in the northern region, each with its brightest galaxy (BCG1 and BCG2), detected as the two most important X-ray substructures with a rest-frame LOS velocity difference of km s-1and probably being in large part aligned with the LOS. We conclude that Abell 1351 is a massive merging cluster. The details of the cluster structure allow us to interpret the quite asymmetric radio halo as a ‘normal’ halo plus a southern relic, strongly supporting a previous suggestion based only on inspection of radio and preliminary X-ray data.
keywords:
Galaxies: clusters: general. Galaxies: cluster: individual.1 Introduction
Very few galaxy clusters show powerful diffuse radio emission on a large scale. In general, this emission may be classified as ‘radio haloes’ and ‘radio relics’. In the first case, the emission presents a compact morphology and comes from central cluster regions, while ‘relics’ are located in the peripheral zones (Ferrari et al., 2008; Giovannini et al., 2002; Feretti et al., 2012; Venturi, 2011). The synchrotron origin of this radio emission demonstrates the presence of large-scale magnetic fields and relativistic particles distributed throughout the whole cluster. Today, cluster mergers are accepted as the most suitable scenarios proposed to supply enough energy for accelerating electrons to relativistic velocities and for magnetic field amplification.
In this framework, radio relics seem to be directly linked with merger shocks (Hoeft et al., 2004; Ensslin & Gopal-Krishna, 2001; Roettiger et al., 1999; Ensslin et al., 1998). On the other hand, the remaining turbulence after cluster collision has been proposed as one of the most important mechanisms to produce giant radio haloes (Brunetti et al., 2001, 2009). Nevertheless, the precise mechanism for generating powerful radio haloes in clusters is still debated. In fact, there are two main theoretical approaches to the problem: re-acceleration vs. hadronic models (Brunetti et al. 2009 and references therein).
Traditionally, the dynamical state of clusters with diffuse radio emission is studied using X-ray observations. Moreover, all statistical analyses on properties of radio emission are derived in general from X-ray data (Rossetti et al., 2011; Cassano et al., 2010; Buote, 2002; Schuecker et al., 2001), and consist basically of temperature and luminosity (see e.g. Giovannini et al., 2002, and references therein). In fact, simulations based on turbulent re-acceleration models fit the observed radio haloes reasonably well (Cassano et al., 2006). Following the same line, Govoni et al. (2001) also find very good agreement between X-ray and radio emission when comparing, point by point, their respective surface brightnesses. Furthermore, Basu (2012) reports no evidence of bimodality in the radio-power–integrated SZ effect diagram whereas, on the contrary, Brunetti et al. (2007) find a bimodal distribution in the radio-power–X-ray luminosity plane. This controversy highlights the need to investigate the nature of radio haloes using other research techniques in addition to X-ray data.
The information on cluster members retrieved by radial velocities is an excellent way to study the kinematics and dynamics of mergers in clusters (Girardi & Biviano, 2002). This technique allows us to detect cluster substructures by distinguishing pre- and post-merging groups, thus making it possible to disentangle the dynamics of ongoing mergers and remnants. Moreover, optical data complement and add information to X-ray because, during a collision, the ICM and galactic component respond on different timescales. Numerical simulations by Roettiger et al. (1997) clearly support this fact, hence the importance of combining optical and X-ray data to study the interactions of different cluster constituents. This is also the technique carried out by the MUSIC (MUlti-Wavelength Sample of Interacting Clusters) project (Maurogordato et al., 2011) to study merging scenarios.
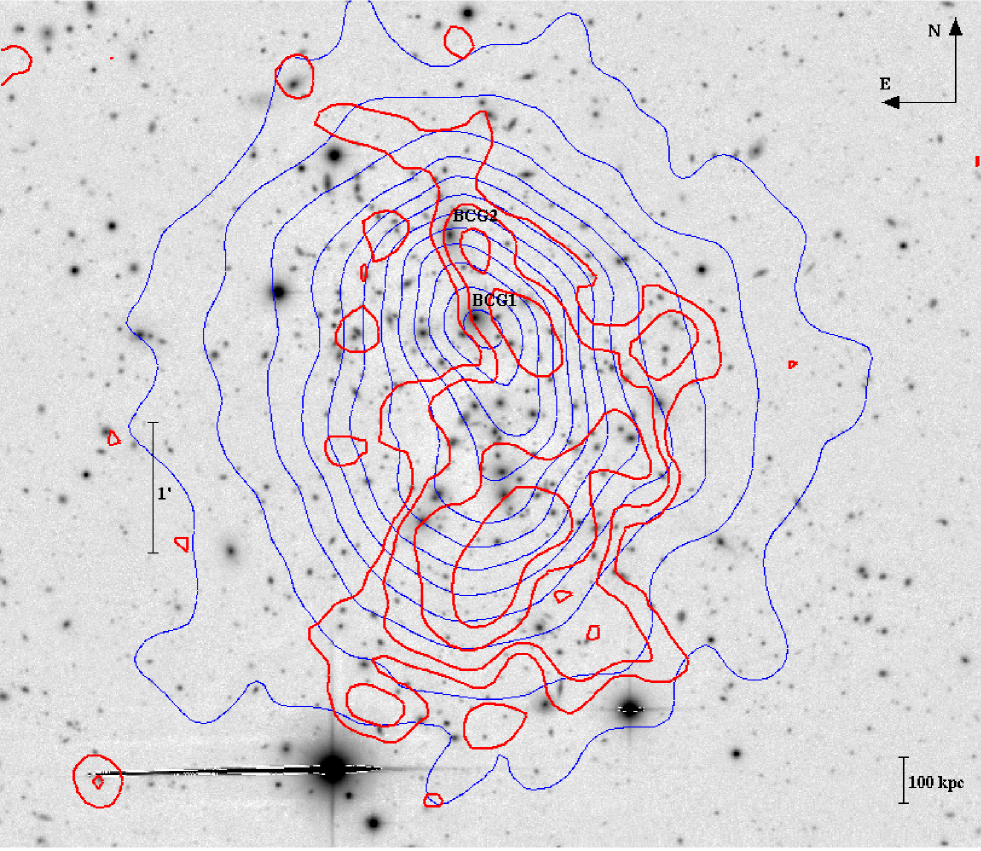
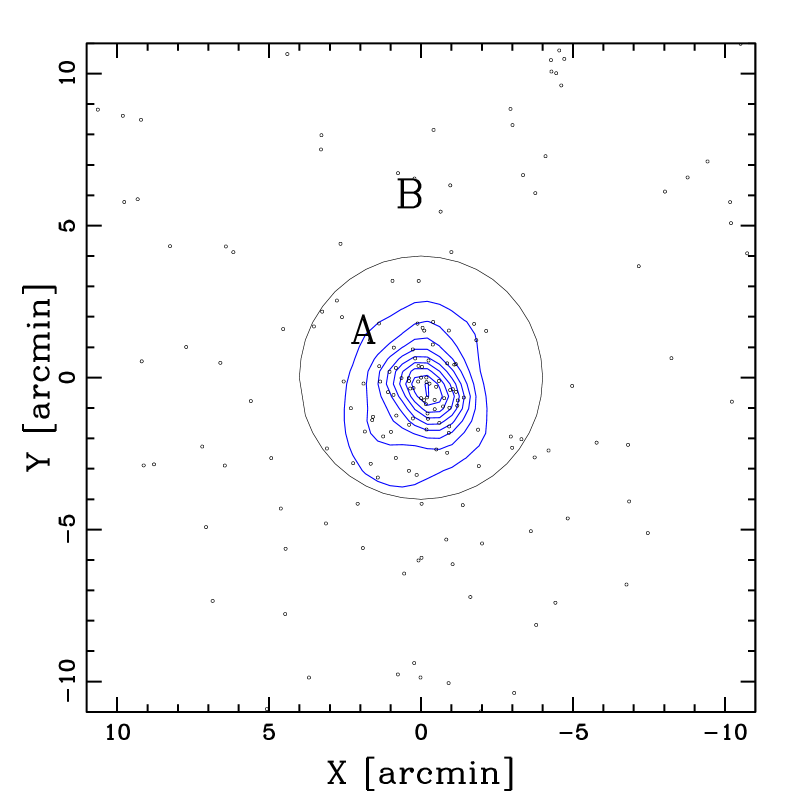
In the context described above, we are conducting an intensive observational and data analysis programme to study the internal dynamics of clusters with diffuse radio emission by using member galaxies (DARC – Dynamical Analysis of Radio Clusters – project, see Girardi et al. 2010.111See also http://wwwuser.oats.inaf.it/girardi/darc/, the web site of the DARC project.) As part of an ongoing programme to investigate the presence in complex X-ray cluster systems of halo emission from the sub-clusters in the merger, we have carried out a detailed and intensive study of the cluster Abell 1351 (hereafter A1351), also known as MACS J1142.4+5831. A1351 is a rich, X-ray luminous cluster: Abell richness class (Abell et al., 1989); (0.1–2.4 keV) = 8.31 erg s-1 (Böhringer et al., 2000). Böhringer et al. (2000) report a mass distribution elongated in the NNE–SSW direction (see also Dahle et al. 2002), but the available maps do not agree in detail. In fact, the primary peak of Holhjem et al. (2009) corresponds to the secondary one of Dahle et al. (2002) (cf. figure 3 – top-left panel – of Holjem et al. with figure 17 – top-right panel – of Dahle et al.). The ROSAT HRI image also reveals a clear elongation, roughly in the north–south direction (Giacintucci et al., 2009; Giovannini et al., 2009), thus suggesting ongoing merger activity (Allen et al., 2003).
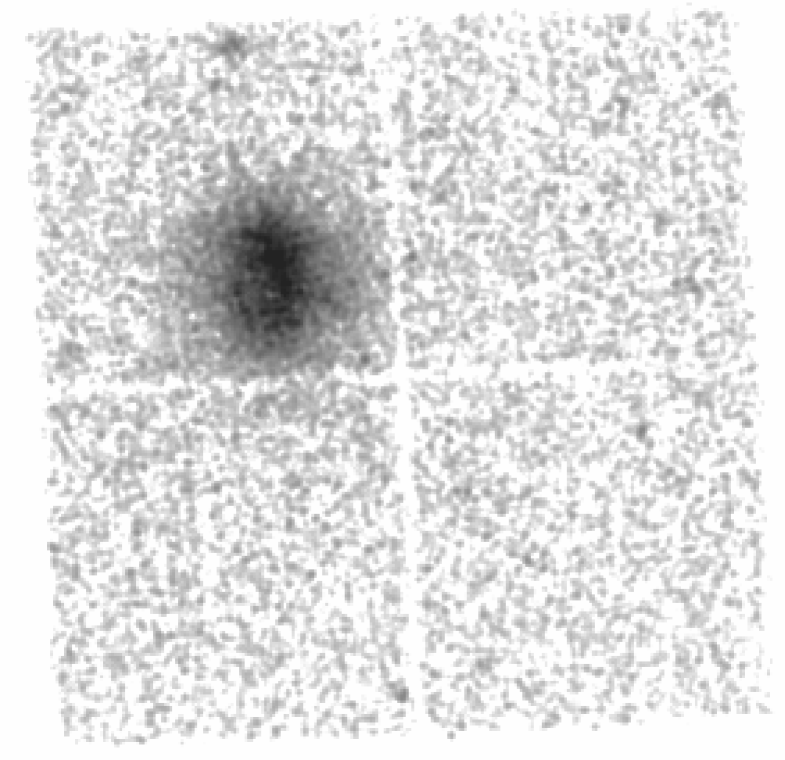
As for the radio emission, Owen et al. (1999) reported the first evidence of a diffuse, extended source in this cluster. The analysis of VLA data archive at 1.4 GHz shows the presence of a centrally located, Mpc-extended source classified as a giant radio halo with a power - W Hz-1 (Giacintucci et al., 2009; Giovannini et al., 2009). Despite the particular difficulty of the subtraction of discrete sources present in radio maps, both analyses of Giacintucci et al. (2009) and Giovannini et al. (2009) show that the radio diffuse emission is quite asymmetric with respect to the X-ray peak. In particular, Giacintucci et al. suggest that the ridge in the southern peripheral region of the halo is a relic projected on to the radio halo emission (see their figure 2 and our Figure 1). A1351 is also an atypical cluster for its very large velocity dispersion of km s-1. This value and the published cluster redshift () are based on 17 cluster members (Irgens et al., 2002).
We acquired new spectroscopic and photometric data on the 3.5 m Telescopio Nazionale Galileo (TNG) and the 2.5 m Isaac Newton Telescope (INT), respectively. The present work is mainly based on these optical data. We also used optical data from the Sloan Digital Sky Survey, Data Release 7 (hereafter SDSS-DR7). We also use X-ray data from Chandra and XMM-Newton public archive to study the intra-cluster medium of A1351 and analyse its global morphological and spectral properties.
This paper is organized as follows. We present optical data and the cluster catalogue in Section 2. Our results on the cluster structure based on optical and X-ray analyses are presented in Sects 3 and 4, respectively. We discuss the cluster structure in Sect. 5 and present our conclusions in Section 6. Unless otherwise stated, we indicate errors at the 68% confidence level (hereafter c.l.). Throughout this paper, we use km s-1 Mpc-1 and km s-1 Mpc-1) in a flat cosmology with and . In the adopted cosmology, 1corresponds to 282 kpc at the cluster redshift.
2 Optical observations
Multi-object spectroscopic (MOS) observations of A1351 were carried out at the TNG on 2010 March 10. We used DOLORES/MOS with the LR-B Grism 1, yielding a dispersion of 187 Å/mm. We used the pixel E2V CCD, with a pixel size of 13.5 m. In total, we observed four MOS masks including 143 slits. For each mask, the exposure time was s.
Reduction of spectra and radial velocity computation were performed using standard IRAF222IRAF is distributed by the National Optical Astronomy Observatories, which are operated by the Association of Universities for Research in Astronomy, Inc., under cooperative agreement with the National Science Foundation. tasks and the cross-correlation technique developed by Tonry & Davis (1979), as done with other clusters included in our DARC sample (for a detailed description see, for example, Boschin et al. 2012). Our spectroscopic catalogue lists 129 galaxies in the field of A1351 (see Table 1).
Comparing the velocity measurements for ten galaxies observed with multiple masks, we corrected the velocity errors provided by the cross-correlation technique by multiplying them for a factor 2.2 (see discussion in, e.g., Girardi et al. 2011, Boschin et al. 2004). Taking into account the above correction, the median value of the errors is 77 km s-1. Three galaxies have spectroscopic redshift in SDSS-DR7 in good agreement with our values. We used magnitudes corrected for galactic extinction, dereddened, in the , , and photometric bands.
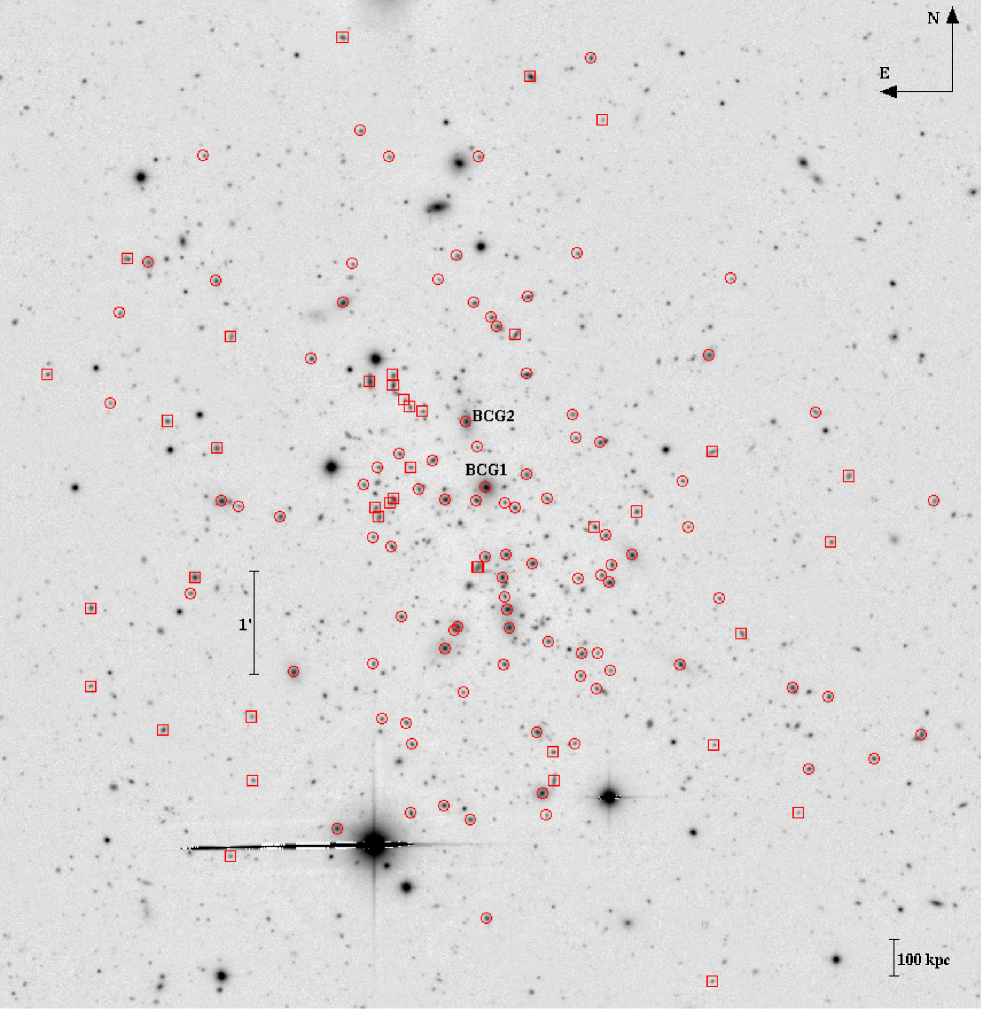
Table 1 lists the velocity catalogue (see also Fig. 2): identification number of each galaxy, ID (col. 1); right ascension and declination, and (J2000, col. 2); magnitude from SDSS-DR7 (col. 3); heliocentric radial velocities, (col. 4) with errors, (col. 5).
We had already observed A1351 field with the Wide Field Camera (WFC), mounted at the prime focus of the 2.5 m INT telescope. We took exposures of s and s in and Harris filters in photometric conditions and 1.2seeing. However, we used SDSS-DR7 data because a greater number of photometric bands are available, which allows an accurate colour analysis. INT and SDSS-DR7 photometric data are very similar. The completeness magnitude is .
The position of the brightest cluster member galaxy (ID. 66 with , hereafter BCG1) is very close to the peak of the X-ray emission and the peak of the mass distribution provided by Dahle et al. (2002). The second-brightest galaxy is ID. 66 with (hereafter BCG2), and then there are several other galaxies at similar brightness ().
3 Analysis of the optical data
3.1 Cluster member selection
To select cluster members among the 129 galaxies with redshifts we performed the 1D adaptive-kernel method (hereafter 1D-DEDICA, Pisani 1993 and Pisani 1996; see also Fadda et al. 1996; Girardi et al. 1996). This procedure detected A1351 as a quite asymmetric peak at populated by 100 galaxies. The re-running of the procedure rejected another two galaxies considered as ‘isolated’, leading to 98 galaxies and then to the detection of two peaks (see Figure 3). The second step in the member selection (which uses the combination of position and velocity information, i.e. the ‘shifting gapper’ method of Fadda et al. (1996; see also, e.g. Girardi et al. 2011 for details on the application of this technique) rejects three galaxies from the whole complex. We adopted as centre position the coordinates of the brightest cluster galaxy – BCG1 [R.A. = , Dec. = (J2000.0)], which coincides with the location of the peak of the X-ray emission. However, note that A1351 is an elongated cluster with BCG1 lying in the northern region (see in the following). Summarizing, we analysed the structure of A1351 using 95 fiducial cluster members.
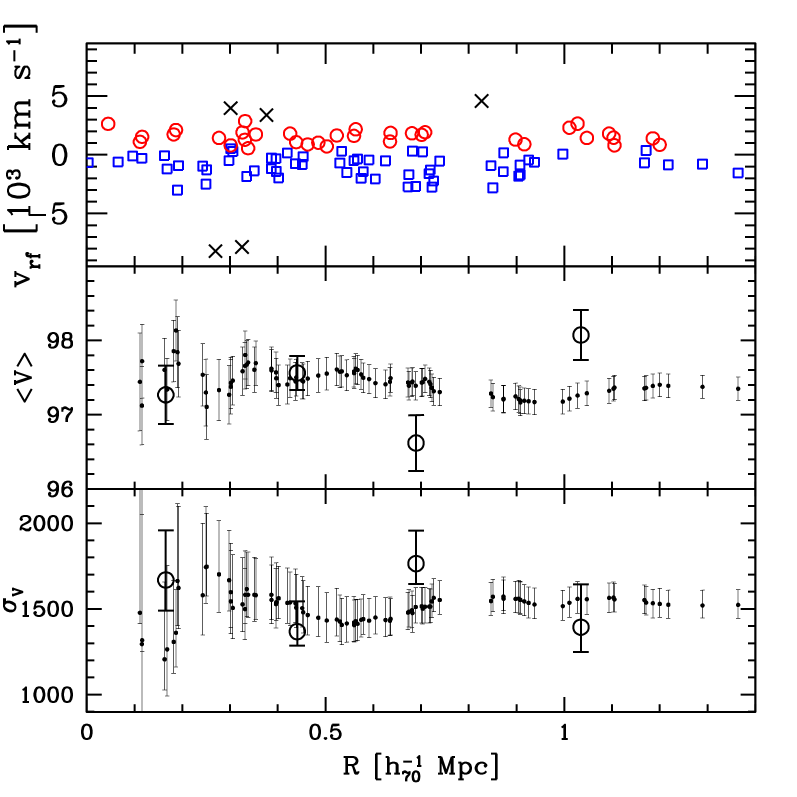
By applying the biweight estimator to the 95 cluster members (Beers et al. 1990, ROSTAT software), we computed a mean cluster redshift of 0.0005, i.e. 157) km s-1. We estimated the LOS velocity dispersion, , by using the biweight estimator and applying the cosmological and standard corrections for velocity errors (Danese et al., 1980), respectively. We obtained km s-1, where the errors are computed through a bootstrap technique. To verify the robustness of the estimate, we analysed the velocity dispersion profile, which is consistent with a flat shape (Fig. 4).

3.2 Substructure analysis
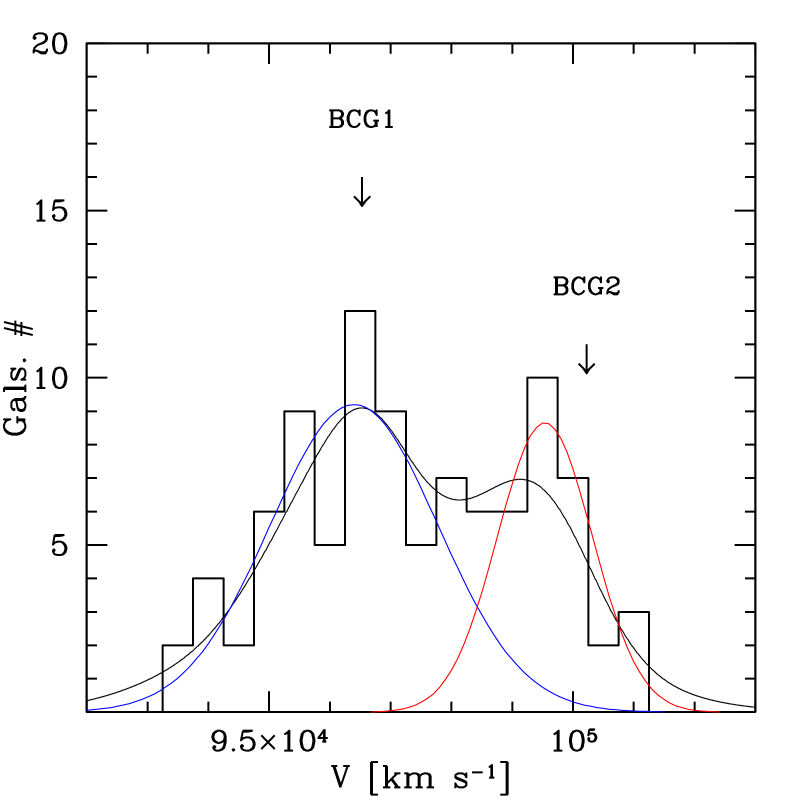
In the velocity distribution of the 95 member galaxies, the 1D-DEDICA procedure detects two significant peaks (DED1 and DED2) of 60 and 35 galaxies, at and km s-1. These peaks largely overlap with 22 (of DED1) and 19 (of DED2) galaxies with a high probability of belonging to the other peak too, see Fig. 5. BCG1 and BCG2 belong to the DED1 and DED2 subclusters, respectively. Mean velocities and velocity dispersions, as computed on subcluster members, are km sand km s-1and km sand km s-1. The distributions of galaxy positions of DED1 and DED2 are different at the 99.4% c.l. according to the the 2D Kolmogorov–Smirnov test (Fasano & Franceschini 1987, hereafter 2D-KS), see Figure 7.
The 1D-Kaye mixture model test (1D-KMM; Ashman et al. 1994; see also Boschin et al. 2012, Boschin et al. 2013 for recent applications), finds a two-Gaussian partition which is a better descriptor than a one-Gaussian profile at the 98.4% and 96.5% c.l.s for the homoscedastic and heteroscedastic cases (i.e. the cases assuming equal or different dispersions), respectively. The Gaussians corresponding to the heteroscedastic case, which is the more realistic approach, are shown in Figure 5. The two subsamples detected by 1D-KMM contain 62 and 33 members (KMM1 and KMM2), where several galaxies have a high probability of belonging to both the peaks. For the two Gaussians we obtain mean velocities, km sand km s-1, and velocity dispersions, km sand km s-1, where the galaxies are weighted according to their partial membership of both groups so as to avoid possible underestimates connected with an artificial truncation of the tails of the samples. The distributions of the galaxy positions of KMM1 and KMM2 are different at the 99.3% c.l. according to the the 2D-KS.
Concerning the spatial distribution of galaxies in the plane of the sky, we analysed the photometric SDSS catalogues extracted for a 30′radius region from the cluster centre thus to overcome redshift and spatial incompleteness of our spectroscopic catalogue. We performed a member selection based on both (– vs. ) and (– vs. ) colour–magnitude relations following, for example, the Boschin et al. (2012) prescriptions; here –=0.956-0.019 and –=2.841-0.244. The 2D-DEDICA analysis detects A1351 as only one isolated peak in the space of projected positions (see Figure 6).
We also applied a set of 3D tests combining velocity and position information. We applied the -statistics devised by Dressler & Schectman (1988, hereafter DS-test), also with the alternative kinematic estimators separating mean velocity and velocity dispersion (hereafter DS-test and DS-test, e.g. Ferrari et al., 2003; Girardi et al., 2010, 1997). We applied the -test (Bird & Beers, 1993) based on the projected mass estimator and the centroid shift or -test (West & Bothun, 1990). The presence of a velocity gradient was analysed performing a multiple linear regression fit to the observed velocities with respect to the galaxy positions in the plane of the sky (e.g. den Hartog & Katgert 1996). The significance of the results is based on 1000 Monte Carlo simulated clusters where original position and velocities are shuffled. We found that substructure is significant in the case of the the -test, which is sensitive to the combined values of local velocity dispersion and projected density at the c.l. The DS-test detects substructure significant at the c.l., in practice owing to the mean velocity estimator (for DS-test the significance is at the 99.7% c.l.). We also found a c.l. significant velocity gradient with a position angle degrees (measured counter-clockwise from the north), i.e. higher-velocity galaxies lie in the north (see Figure 7). Figure 7 shows that galaxies in the external cluster region are responsible for the position–velocity correlation.
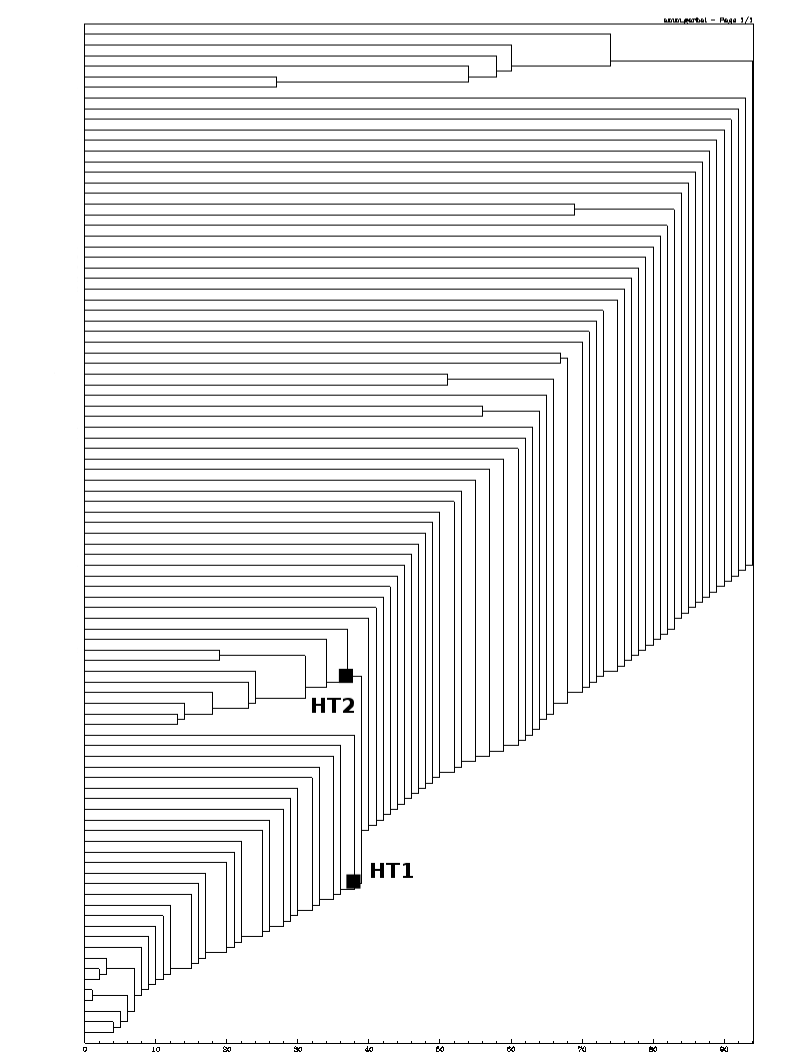
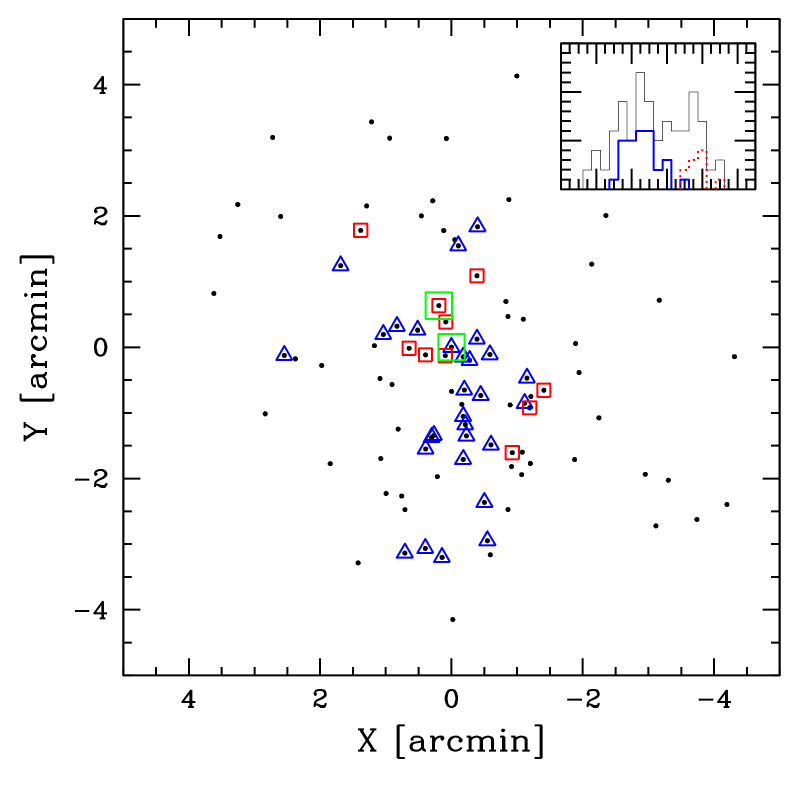
We also resorted to the Htree-method devised by Serna & Gerbal (1996); a similar technique is also used to determine cluster members (Serra & Diaferio, 2013). The method uses a hierarchical clustering analysis to determine the relationship between galaxies according to their relative binding energies where ignorance of the mass associated with each galaxy is overcome adopting for each galaxy halo the typical mass-to-light of galaxy cluster. The clustering sequence can be visualized in the form of a hierarchical tree diagram (dendogram). Figure 8 shows the resulting dendogram, where we used =150 , as suggested by broad statistical studies (e.g. Girardi et al. 2000; Popesso et al. 2005). From Fig. LABEL:a1351gerbal, it can be seen that A1351 contains two main subgroups (HT1 and HT2), with BCG1 and BCG2 in the respective potential well. The presence of the two subgroups is quite robust against the choice of the value of , although the number of identified members depends on the precise value of , i.e. it decreases with the increase in from 100 to 200 . HT1 and HT2 are well separated in velocity and superimposed in the sky in the central cluster region (see Fig. 9 and insert plot). Their mean velocities are km sand km s-1. Our interpretation is that they are the central, densest parts of the two subclusters detected through the KMM or the 1D-DEDICA method (see above).
4 X-ray morphological and spectral analysis
In order to complement our optical analysis, we used recent X-ray data taken with Chandra and XMM-Newton satellites to study the ICM of A1351 and infer its global morphological and spectral properties.
First, we considered archival data taken with the Chandra Advanced CCD Imaging Spectrometer (ACIS–I; exposure ID 15136). We reduced the data using the CIAO package333see http://asc.harvard.edu/ciao/ (version 4.2) on chips I0, I1, I2 and I3 (total field of view ) in a standard way (see Boschin et al. 2004)
A quick look at the reduced image suggests the ICM is somewhat elongated in the NNE–SSW direction (see Figure 10). A clear twisting of the isophotes is present (see Fig. 1), from the centre towards the more external regions, thus suggesting the ICM is not relaxed in a regular gravitational potential well.
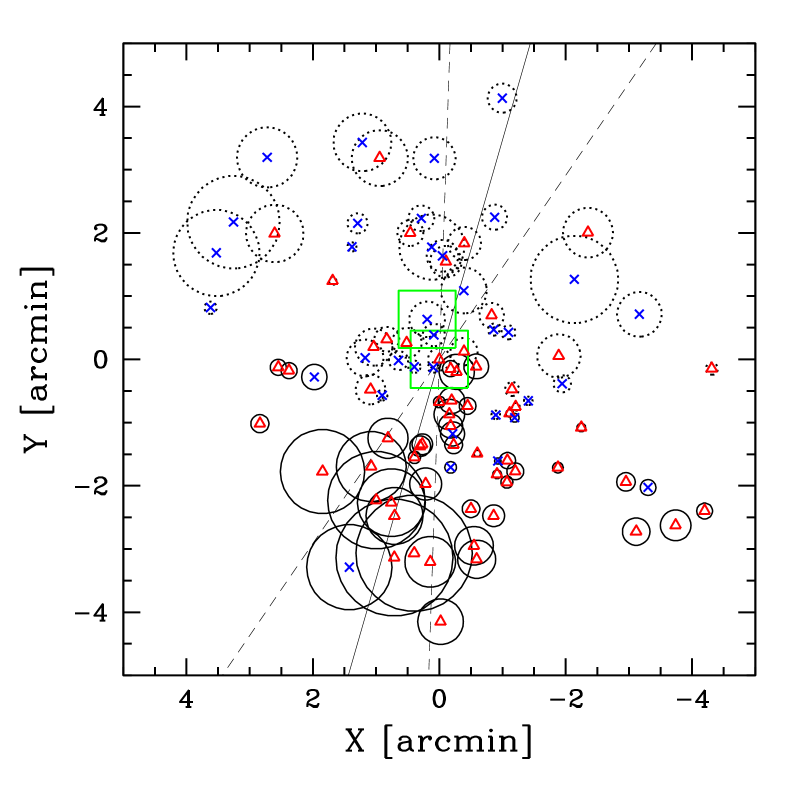
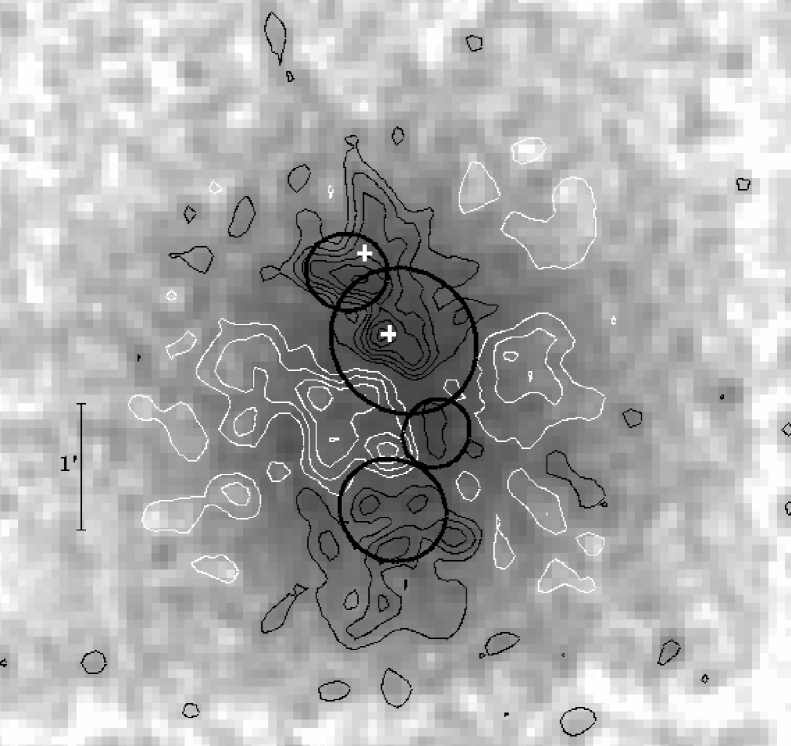
To better characterize the X-ray morphology of the cluster we performed a wavelet multiscale analysis on chip I3 with the CIAO/WAVDETECT task. On small scales (2–6 pixels), taking advantage of the high spatial resolution of Chandra images, WAVDETECT was effective in identifying the pointlike sources projected on the line of sight of the cluster. After removal of these sources, a run of WAVDETECT on larger scales (20–42 pixels) allowed us to identify four X-ray clumps (see Fig. 11), thus confirming the irregular morphology of the ICM.
These clumps are also evident when fitting a simple -model profile to the 2D X-ray photon distribution and analysing the model residuals. The model is defined to be (Cavaliere & Fusco-Femiano 1976):
| (1) |
where is the projected radial coordinate from the centroid position and the surface brightness background level. The fit only provides poorly constrained and unrealistic values of the slope parameter and the angular core radius Rc ( , R kpc at the cluster redshift), which is another hint of an irregular X-ray photon distribution. Moreover, the analysis of the -model residuals reveals a clear excess of X-ray emitting gas in correspondence with the four clumps detected by the wavelet multiscale analysis (see Figure 11).
As for the spectral properties of the cluster X-ray photon distribution, we computed global ICM temperature by analysing XMM-Newton data. We considered an observation of A1351 (ID 0650382201) stored in the public archive. We reprocessed the Observation Data Files (ODF) using the Science Analysis System (SAS; version 13.0), following the procedure described in De Grandi & Molendi (2009) to produce calibrated event list cleaned of soft protons. The net exposure time of the observation is 5.2 ks for MOS1, 6.7 ks for MOS2 and 2.5 ks for the pn.
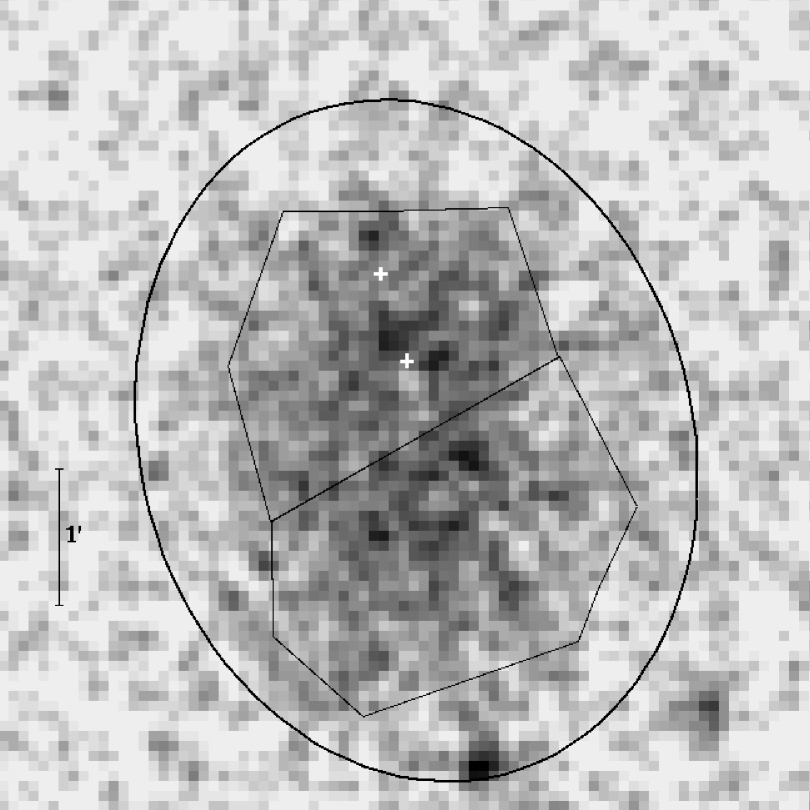
We applied the background subtraction using blank-sky fields for EPIC MOS and pn produced by Leccardi & Molendi (2008). Using the XSPEC package (version 11.3.2, Arnaud 1996), we analysed the EPIC spectrum of an elliptical region centred on coordinates = 11:42:24.28 and = +58:31:30.94, with , =1.25 (where and are the major and minor axes, respectively) and =15∘(measured from north to east; see Figure 12). We modelled the spectrum with a one-temperature thermal model with the plasma in collisional ionization equilibrium (apec model in XSPEC), multiplied by a wabs absorption model with the Galactic hydrogen column density fixed at cm-2 (Kalberla et al., 2005). We found that the ICM has a global temperature of keV.
5 Cluster structure
We present several proofs in favour of the previous first evidence of an ongoing merger activity in A1351. Our kinematic analysis is based on a factor more galaxies than previously. On the one hand, we confirm that A1351 is characterized by a high global value of velocity dispersion km s(see km s-1, Irgens et al. 2002) and, on the other hand, it shows a bimodal velocity distribution with two peaks separated by 2500 km sin the rest frame. As for the X-ray data, we confirm the N–S elongation of the X-ray emission and further features are detected. From north to south we detected three, maybe four, substructures (see Figure 11). The northern part, containing the two most important X-ray clumps, is particularly brighter and is NNE–SSW elongated. BCG2 and BCG1 bright galaxies are placed along the N–S direction. In addition, a few other quite luminous members (IDs. 55, 56, 76, 79) are aligned following the same axis. Moreover, we detected a velocity gradient in the galaxy velocity field roughly in S–N direction and the presence of 3D substructure at a very significant level.
The above results indicate that the cluster structure extends along the LOS but is not completely aligned with it. In particular, the two main subclusters, corresponding to BCG1 and BCG2 and detected as two northern X-ray clumps, cause the bimodality of the velocity distribution, low and high velocity peaks respectively (see Fig. 5). In spite of the very significant 3D substructure tests, we cannot detect two separate galaxy concentrations. This is probably because the two subclusters are so closely projected on the sky that we would need a much larger number of redshifts to sample the region better. The southern region, mostly populated by galaxies of the low velocity peak, is instead characterized by two less important substructures that contribute to trace the north–south direction.
The high value of the X-ray temperature, keV, indicates a high mass value, e.g. and (Lopeset al., 2009), as obtained from two published – relations. Alternatively, we used a kinematic approach, taking advantage of our redshift sample. We followed the prescriptions of Girardi & Mezzetti (2001, see also Girardi et al. 1998) by considering that A1351 is probably formed by two subclusters: the low velocity one, with - km s-1, and the high-velocity one, with - km s-1. We obtained and , and a global value of -4.2 . A1351 is thus quite a massive system, in agreement with typical mass values of other clusters hosting radio haloes (e.g. Girardi et al. 2008; Girardi et al. 2010) and in line with the expectations of the re-acceleration scenario in favouring more massive systems (e.g. Cassano et al. 2008).
The value of the velocity dispersion of the main subcluster, - km s-1, is consistent with the value of the singular isothermal sphere in the weak gravitational analysis (- km s-1, Dahle et al. 2002; Holjem et al. 2009). The lower limit of our mass estimate, –4.2 , is only slightly above the lensing mass of Holjem et al. (2009), -9 , when taking into account their smaller estimate of the value of (1.69 Mpc, see our above estimate of ). Instead, we disagree with the morphological details of the two previous gravitational lensing analyses of Dahle et al. (2002) and Holhjem et al. (2009), which, in fact, are in disagreement with each other (see Section 1). In particular, as for the northern minor peak ‘B’ detected by Holhjem et al. (2009), this is outside the field we sampled through TNG redshift data and it is not detected by our analysis of the SDSS photometric sample (see Fig. 6), where the presence of A1351 is outstanding. Indeed, Holhjem et al. (2009) have suggested the possibility that peak ‘B’ is only a chance alignment of galaxies. The important LOS elongation of the structure of A1351 might be the cause the difficulties in the weak gravitational lensing analysis, in particular in determining the concentration parameter (Holhjem et al., 2009).
The elongation and twisting of isophotes of the X-ray emission is strong evidence for an ongoing cluster merger. With the available XMM-Newton observation we did not find any X-ray temperature difference between northern and southern regions (see Figure 12).
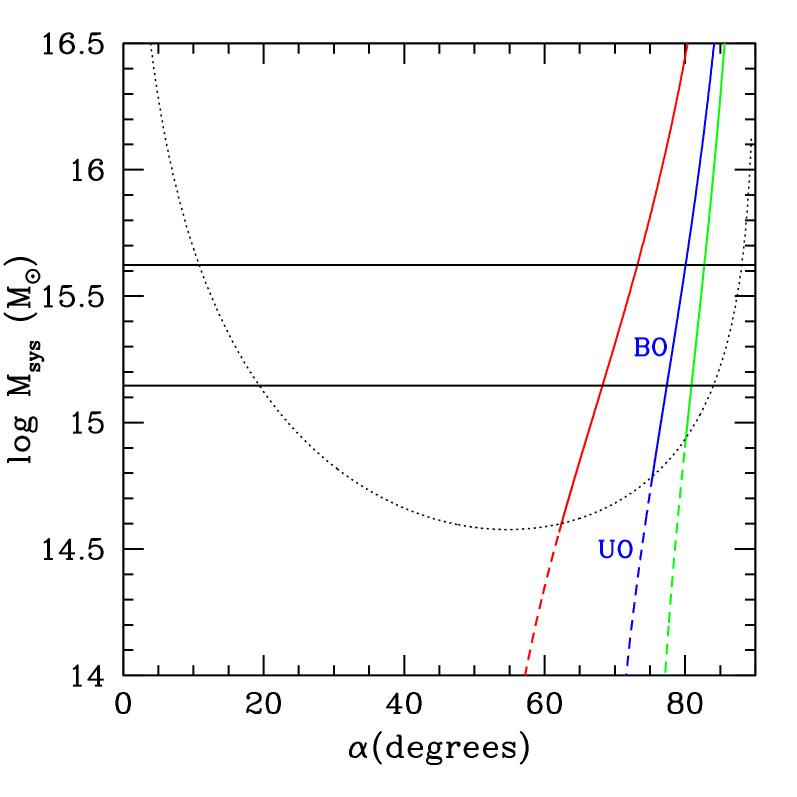
Reducing the complex structure of A1351 to the two main subclusters, we can apply a model to follow the merging kinematics. We applied the analytic method of the bimodal model (Beers et al. 1982; Thompson 1982; see also Girardi et al. 2008 for a recent application). As for the input values of the relevant parameters for this model, we used the above -4.2 and the rest-frame LOS velocity difference between the two subclusters that measured 2500 km s-1in both the DEDICA and KMM analyses . As for the projected distance between the two subclusters, our substructure analysis suggests a small value and does not allow a precise estimate. We then resorted to that measured between BCG1 and BCG2, Mpc. In other clusters hosting radio haloes the time, , elapsed from the core crossing is –0.3 Gyr (e.g. Markevitch et al. 2002; Girardi et al. 2008). For the cases with , 0.2 and 0.3 Gy, Figure 13 shows the outgoing solutions of the bimodal model as a function of , the projection angle between the plane of the sky and the line connecting the centres of the two clumps, with the observed mass of the system . The post core-crossing scenario represented by the bound outgoing solutions (BO) leads to a range of –80∘. This value agrees with observational evidence of two main subclusters aligned mostly, but not completely, along the LOS.
Regarding the diffuse radio emission and its peculiar asymmetry with respect to the X-ray peak, Giacintucci et al. (2009) have suggested that the southern X-ray emission, the ‘ridge’, might be a relic rather a southern extension of the radio halo. Our results strongly support the above hypothesis. In fact, the northern part of the radio emission coincides with the region where the two main subclusters are projected. Consequently, the northern part of the radio emission can be correctly interpreted as a radio halo centrally located and someway symmetric with respect to the X-ray central emission, in agreement with typical radio halos in clusters. Excluding the contribution of the ridge, A1351 is much closer to the relation between the radio power and X-ray luminosity, as traced by the clusters showing a giant radio halo, as is shown well in fig. 3 of Giacintucci et al. (2009). The southern part of the radio emission (the ridge) lies at the external border of the most southern X-ray clumps. Thus, it could most probably be a relic connected to a merger along the north–south direction involving minor galaxy clumps. The only (minor) point of their scenario we cannot agree with is the northern small radio filament (see their figure 2). In this respect, we found no extension in the X-ray emission and no evidence of an optical subcluster in that region.
6 Summary and conclusions
Our analysis of A1351 at , based on new spectra acquired at the TNG for 100 member galaxies, and X-ray data retrieved from Chandra and XMM archives, derives the following results:
-
•
the measured dispersion of galaxy velocities is so high, km s-1, owing to the bimodal structure of the velocity distribution;
-
•
the measured X-ray temperature, keV, is also high, and both X-ray and kinematic data lead to a high mass value (1–4 ), in agreement with observational estimates of most clusters hosting radio haloes and with theoretical expectations of the reacceleration/turbulence scenario;
-
•
A1351 is a very complex cluster, with two main subclusters projected in the northern region and connected with the two peaks in the velocity distribution, and other minor substructures, all tracing the N–S cluster elongation.
Therefore, we conclude that in the above scenario, the quite peculiar, diffuse radio emission can be reduced to a much more typical emission (halo plus relic), strongly supporting a previous suggestion based only on the inspection of radio data and preliminary X-ray data. We stress, however, that the study of so complex a cluster would be greatly advantageous with a substantial improvement of data. A much larger redshift dataset would allow the detection of individual subcluster cores. In addition, deeper X-ray observations would make it possible to construct X-ray temperature and metallicity maps.
More generally, considering our previous results about structure of DARC clusters, we conclude that peculiar features in the diffuse radio emission could be interpreted by considering the details of the complex cluster structure, for instance in Abell 520, hosting a very elongated radio halo (Girardi et al., 2008), and in Abell 2345, hosting two quite asymmetric radio relics (Boschin et al., 2010). In this context, the study of the galaxy kinematics represents an important ingredient, critical to our understand of the geometry of the merger and to detecting possible LOS aligned substructures.
Acknowledgements
We are indebted to Tiziana Venturi for the VLA radio image. RB acknowledges financial support from the Spanish Ministry of Economy and Competitiveness (MINECO) under the 2011 Severo Ochoa Programme MINECO SEV-2011-0187. MG acknowledges financial support from MIUR PRIN2010-2011 (J91J12000450001). This publication is based on observations made on the island of La Palma with the Italian Telescopio Nazionale Galileo (TNG) and the Isaac Newton Telescope (INT). The TNG is operated by the Fundación Galileo Galilei – INAF (Istituto Nazionale di Astrofisica). The INT is operated by the Isaac Newton Group. Both telescopes are located in the Spanish Observatorio del Roque de Los Muchachos of the Instituto de Astrofisica de Canarias. This research has made use of the NASA/IPAC Extragalactic Database (NED), which is operated by the Jet Propulsion Laboratory, California Institute of Technology, under contract with the National Aeronautics and Space Administration.
References
- Abell et al. (1989) Abell G. O., Corwin H. G. Jr., Olowin R. P., 1989, ApJS, 70, 1
- Allen et al. (2003) Allen S. W., Schmidt R. W., Fabian A. C., Ebeling H., 2003, MNRAS, 342, 287
- Arnaud (1996) Arnaud K. A., 1996, in “Astronomical Data Analysis Software and Systems V” (eds. G. Jacoby and J. Barnes), ASP Conf. Ser., 101, 17
- Ashman et al. (1994) Ashman K. M., Bird C. M., Zepf S. E., 1994, AJ, 108, 2348
- Basu (2012) Basu K., 2012, MNRAS, 421, L112
- Beers et al. (1990) Beers T. C., Flynn K., & Gebhardt K. 1990, AJ, 100, 32
- Beers et al. (1982) Beers T. C., Geller M. J., Huchra J. P., 1982, ApJ, 257, 23
- Bertin & Arnouts (1996) Bertin E., Arnouts S., 1996, A&As, 117, 393
- Bird & Beers (1993) Bird C. M., Beers T. C., 1993, AJ, 105, 1596
- Böhringer et al. (2000) Böhringer H., Voges W., Huchra J. P., et al., 2000, ApJS, 129, 435
- Boschin et al. (2013) Boschin W., Girardi M., Barrena R., 2013, MNRAS, 434, 772
- Boschin et al. (2004) Boschin W., Girardi M., Barrena R., et al., 2004, A&A, 416, 839
- Boschin et al. (2010) Boschin W., Barrena R., Girardi M., 2010, A&A, 521, A78
- Boschin et al. (2012) Boschin W., Girardi M., Barrena R., Nonino M., 2012, A&A, 540, A43
- Brunetti et al. (2009) Brunetti G., Cassano R., Dolag K., Setti G., 2009, A&A, 507, 661
- Brunetti et al. (2001) Brunetti G., Setti G., Feretti L., Giovannini G., 2001, MNRAS, 320, 365
- Brunetti et al. (2007) Brunetti G., Venturi T., Dallacasa D., Cassano R., Dolag K., Giacintucci S., Setti G., 2007, ApJ, 670, L5
- Buote (2002) Buote D. A., 2002, in Feretti L., Gioia I. M., Giovannini G., eds., Merging Processes in Galaxy Clusters, Kluwer, Dordrecht, p. 79
- Cassano et al. (2006) Cassano R., Brunetti G., Setti G., 2006, MNRAS, 369, 1577
- Cassano et al. (2008) Cassano R., Brunetti G., Venturi G., et al., 2008, A&A, 480, 687
- Cassano et al. (2010) Cassano R., Ettori S., Giacintucci S., Brunetti G., Markevitch M., Venturi T., Gitti M., 2010, ApJl, 721, 82
- Cavaliere & Fusco-Femiano (1976) Cavaliere A., Fusco-Femiano R., 1976, A&A, 49, 137
- Dahle et al. (2002) Dahle H., Kaiser N., Irgens R. J., Lilje P. B., Maddox S. J., 2002, ApJS, 139, 313
- Danese et al. (1980) Danese L., De Zotti C., di Tullio G., 1980, A&A, 82, 322
- De Grandi & Molendi (2009) De Grandi S., Molendi S., 2009, A&A, 508, 565
- den Hartog & Katgert (1996) den Hartog R., Katgert P., 1996, MNRAS, 279, 349
- Dressler & Schechtman (1988) Dressler A., Shectman S. A., 1988, AJ, 95, 985
- Ensslin et al. (1998) Ensslin T. A., Biermann P. L., Klein U., Kohle S., 1998, A&A, 332, 395
- Ensslin & Gopal-Krishna (2001) Ensslin T. A., Gopal-Krishna, 2001, A&A, 366, 26
- Ensslin et al. (2011) Ensslin T. A., Pfrommer C., Miniati F., Subramanian K., 2011, A&A, 527, A99
- Fadda et al. (1996) Fadda D., Girardi M., Giuricin G., Mardirossian F., Mezzetti M., 1996, ApJ, 473, 670
- Fasano & Franceschini (1987) Fasano G., Franceschini A., 1987, MNRAS, 225, 155
- Feretti et al. (2012) Feretti L., Giovannini G., Govoni F., Murgia M., 2012, A&ARv, 20, 54
- Ferrari et al. (2003) Ferrari C., Maurogordato S., Cappi A., Benoist C., 2003, A&A, 399, 813
- Ferrari et al. (2008) Ferrari C., Govoni F., Schindler S., Bykov A. M., Rephaeli Y., 2008, Space Sci. Rev., 134, 93
- Giacintucci et al. (2009) Giacintucci S., Venturi T., Cassano R., Dallacasa D., Brunetti G., 2009, A&A, 704, L54
- Giovannini et al. (2009) Giovannini G., Bonafede A., Feretti L., et al., 2009, A&A, 507, 1257
- Giovannini et al. (2002) Giovannini G., Feretti L., 2002, in Feretti L., Gioia I. M., Giovannini G., eds., Merging Processes in Galaxy Clusters, Kluwer, Dordrecht, p. 197
- Girardi et al. (2011) Girardi M., Bardelli S., Barrena R., Boschin W., Gastaldello F., Nonino M., 2011, A&A, 536, A89
- Girardi et al. (2010) Girardi M., Barrena R., Boschin W., 2010, Contribution to the conference “Galaxy clusters: observations, physics and cosmology”, p.38
- Girardi et al. (2008) Girardi M., Barrena R., Boschin W., Ellingson E., 2008, A&A, 491, 379
- Girardi & Biviano (2002) Girardi M., Biviano A., 2002, in Feretti L., Gioia I. M., Giovannini G., eds., Merging Processes in Galaxy Clusters, Kluwer, Dordrecht, p. 39
- Girardi et al. (2000) Girardi M., Borgani S., Giuricin G., Mardirossian F., Mezzetti F., 2000, ApJ, 530, 62
- Girardi et al. (2010) Girardi M., Boschin W., Barrena R., 2010, A&A, 517, 65
- Girardi et al. (1997) Girardi M., Escalera E., Fadda D., Giuricin G., Mardirossian F., Mezzetti M., 1997, ApJ, 482, 41
- Girardi et al. (1996) Girardi M., Fadda D., Giuricin G., Mardirossian F., Mezzetti, M., Biviano, A., 1996, ApJ, 457, 61
- Girardi et al. (1998) Girardi M., Giuricin G., Mardirossian F., Mezzetti M., Boschin W., 1998, ApJ, 505, 74
- Girardi & Mezzetti (2001) Girardi M., Mezzetti M., 2001, ApJ, 548, 79
- Govoni et al. (2001) Govoni F., Ensslin T. A., Feretti L., Giovannini G., 2001, A&A, 369, 441
- Hoeft et al. (2004) Hoeft M., Brüggen M., Yepes G., 2004, MNRAS, 347, 389
- Holhjem et al. (2009) Holhjem K., Schirmer M., & Dahle H., 2009, A&A, 504, 1
- Irgens et al. (2002) Irgens R. J., Lilje P. B., Dahle H., Maddox S. J., 2002, ApJ, 579, 227
- Kalberla et al. (2005) Kalberla P. M. W., Burton W. B., Hartmann D., et al., 2005, A&A, 440, 775 (LAB Map)
- Leccardi & Molendi (2008) Leccardi A., Molendi S., 2008, A&A, 486, 359
- Lopeset al. (2009) Lopes P. A. A., de Carvalho R. R., Kohl-Moreira J. L., Jones C., 2009, MNRAS, 399, 2201
- Markevitch et al. (2002) Markevitch M., Gonzalez A. H., David L., Vikhlinin A., Murray S., Forman W., Jones C., Tucker W., 2002, ApJ, 567, L27
- Maurogordato et al. (2011) Maurogordato S., Sauvageot J. L., Bourdin H., Cappi A., Benoist C., Ferrari C., Mars G., Houairi K., 2011, A&A, 525, A79
- Owen et al. (1999) Owen F., Morrison G., Voges W. 1999, proceedings of the workshop “Diffuse Thermal and Relativistic Plasma in Galaxy Clusters”, eds. H. Böhringer, L. Feretti, & P. Schuecker, MPE Report 271, pp. 9–11
- Patel et al. (2000) Patel S. K., Joy M., Carlstrom J. E., et al., 2000, ApJ, 541, 37
- Pisani (1993) Pisani A., 1993, MNRAS, 265, 706
- Pisani (1996) Pisani A., 1996, MNRAS, 278, 697
- Popesso et al. (2005) Popesso P., Biviano A., Böhringer H., Romaniello M., Voges W., 2005, A&A, 433, 431
- Roettiger et al. (1999) Roettiger K., Burns J. O., Stone J. M., 1999, ApJ, 518, 603
- Roettiger et al. (1997) Roettiger K., Loken C., Burns J. O., 1997, ApJS, 109, 307
- Rossetti et al. (2011) Rossetti M., Eckert D., Cavalleri B. M., Molendi S., Gastaldello F., Ghizzardi S., 2011, A&A, 532, 123
- Schuecker et al. (2001) Schuecker P., Böhringer H., Reiprich T. H., & Feretti L., 2001, A&A, 378, 408
- Serna & Gerbal (1996) Serna A., Gerbal D., 1996, A&A, 309, 65
- Serra & Diaferio (2013) Serra A. L., Diaferio A., 2013, ApJ, 768, 116
- Thompson (1982) Thompson L. A., 1982, in Early Evolution of the Universe and the Present Structure, Proc. IAU Symp. 104, Abell G. O., Chincarini G., eds., Reidel, Dodrecht, p. 63
- Tonry & Davis (1979) Tonry J., Davis M., 1979, AJ, 84, 1511
- Venturi et al. (2008) Venturi T., Giacintucci S., Macario G., et al., 2008, A&A, 484, 327
- Venturi (2011) Venturi T., 2011, Mem. Soc. Astron. Italiana, 82, 499
- West & Bothun (1990) West M. J., Bothun G. D., 1990, ApJ, 350, 36