Nanoscale phase separation in deep underdoped Bi2Sr2CuO6+δ and Ca2CuO2Cl2
Abstract
We demonstrate that tunneling spectra in deeply underdoped Bi2Sr2CuO6+δ (Bi2201) and Ca2CuO2Cl2 (CCOC) provide clear evidence for nanoscale phase separation (NPS), causing the gap to fill with doping rather than close. The phase separation extends over a doping range from half filling to approximately . Assuming the NPS is in the form of stripes, then the nodal gap – which we model as a Coulomb gap – arises from impurity pinning of the charged stripes, ultimately driving a metal-insulator transition.
pacs:
74.72.Gh, 74.72.Cj, 74.25.Dw, 74.25.JbJust how a correlated material evolves from a Mott insulator to a high- superconductor remains a highly contentious issue nearly three decades after the discovery of the cuprates, with important implications for the underlying mechanism of superconductivity. A major puzzle in cuprate physics is what happens on doping to the 2 eV-gap present in the half-filled Mott insulator state. Various theoretical models make clear predictions in this connection. In strong coupling theories ( model or Hubbard model) the gap remains large, but there is an anomalous spectral weight transfer (ASWT) from upper (UHB) to lower Hubbard band (LHB).EMS The width of the LHB gradually increases from to as the doping changes from to . For smaller- Hubbard models, the ASWT is actually faster, as electrons can lower their kinetic energy by hopping through occupied states. In intermediate coupling models, this is associated with a decrease of the magnetic gap with doping.ASWT
However, to explain the rapid changes found at low doping requires accounting for doping-dependent screening of the Hubbard , and in a two-dimensional system with magnetic gap, the screening should turn on discontinuously with doping away from half fillingMKII . In such a case, Mott showed that the transition would be first order.Mott This would lead to a very different scenario for the doping dependence of the gap, leading to a filling in rather than a closing as islands of doped phase appear in the sample. Here we will compare these two scenarios to recent scanning tunneling microscopy (STM) experiments on cuprates.
Experimental data in the deeply underdoped regime, which could help discriminate between different theoretical scenarios, however, have been difficult to obtain until recently. Photoemission sees only filled states, and it is unable to probe the Mott gap. Scanning tunneling microscopy (STM) found only a meV pseudogapDavis_STM , with no indication as to how this gap connected to the 2 eV optical gap at half-filing. Resonant inelastic x-ray scattering (RIXS) finds evidence for gap collapse, but since it measures a joint density of states (DOS), the analysis is model dependentMBRIXS . Very recent STM data from Ca2CuO2Cl2 (CCOC)CCOC_STM and Bi2Sr2CuO6+δ (Bi2201)SNS13 give new insight into this problem as these data show the presence of a large gap at half-filling, comparable to the optical gap. Remarkably, the gap in the STM spectra neither remains unchanged nor shrinks with doping, but instead it fills in. This observed behavior is not consistent with a uniform doping scenario. A possible explanation is provided by a model involving competing magnetic orders in which there can be a phase separation between the undoped insulator and an incommensurate magnetic phase near 1/8 doping.GML Since the positive ions are fixed in the lattice, this electronic phase separation cannot be macroscopic, but must be a nanoscale phase separation (NPS), possibly in the form of stripes.
Here we show how these results can be understood within an intermediate coupling model.JoukoDoping The band dispersion is taken from density functional theory calculations renormalized by correlationsmarkietb ; ASWT , while the magnetic order is calculated self consistently within the random phase approximation (RPA). For undoped Ca2CuO2Cl2 (CCOC) the model predicts a large, 3 eV gap, consistent with experimentCCOC_STM , as well as both the gap and the separation of the two Van Hove singularities (VHSs), Fig.2(c). Moreover, the same model reproduces the experimental dispersions and density of states (DOS) for , in both Bi2Sr2CuO6+δ (Bi2201)Peter1 and Bi2Sr2CaCu2O8+δ (Bi2212)JoukoDoping .
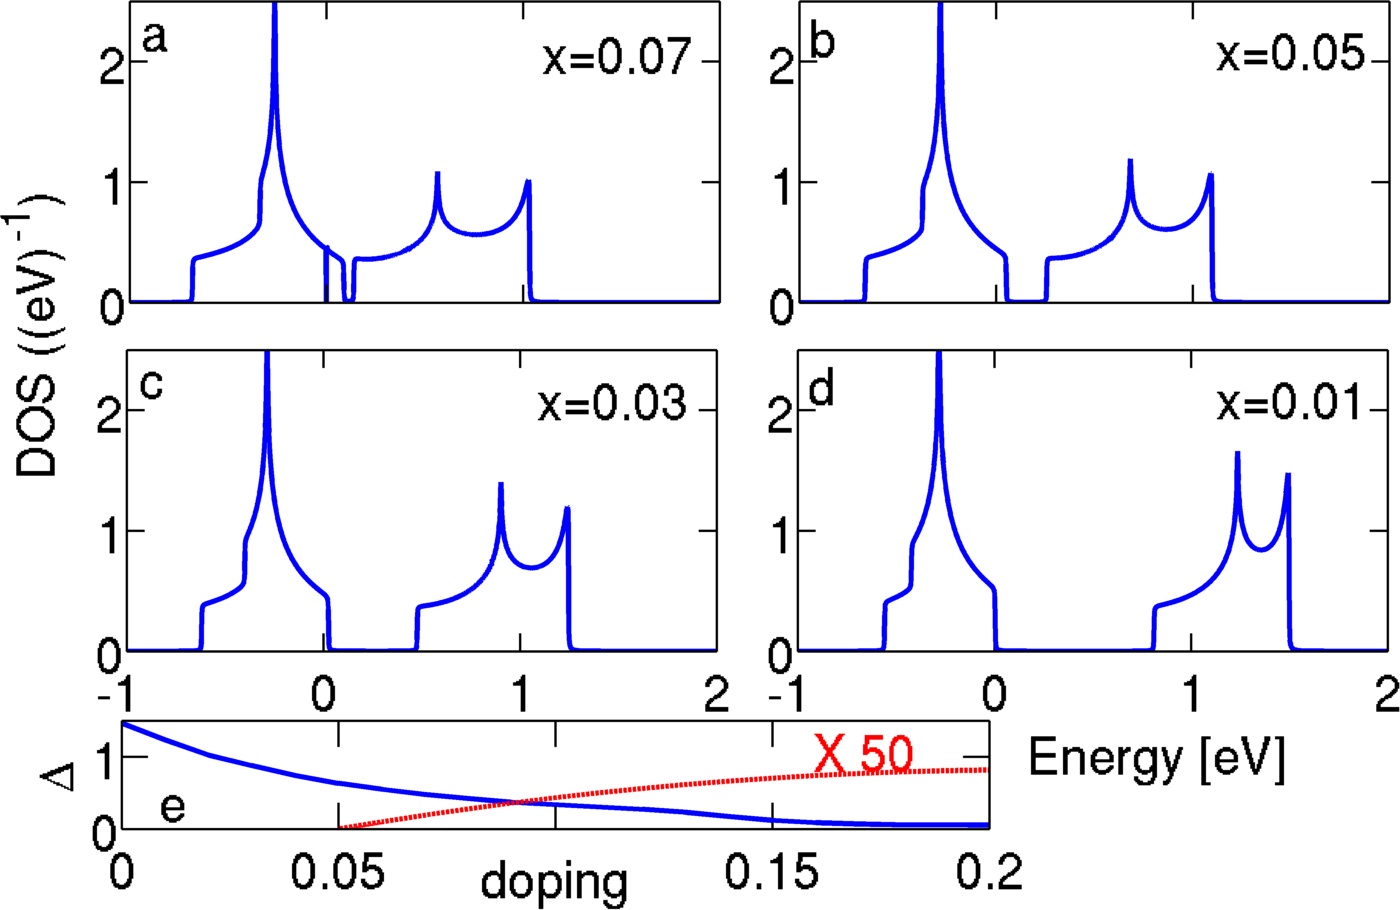
However, for a uniformly doped system, the 3 eV AF gap at half filling is found to decrease rapidly with doping, leaving only a 300 meV pseudogap at , Fig. 1(e). This would lead to a steady decrease of the gap with increasing doping, as illustrated in Fig. 1. In contrast, recent scanning tunneling microscopy (STM) experiments on deeply underdoped CCOC and Bi2201 reveal a more complicated doping evolution, with a strong growth of in-gap states in the local DOS (LDOS) spectra.CCOC_STM ; SNS13 Here we shall show that these results can be understood in terms of nanoscale phase separation (NPS).
In the cuprates, there are several sources of charge inhomogeneity that may act in parallel. First, a charge-density wave phase has been found in a number of cuprates.EHud ; YCDW1 ; YCDW2 ; YCDW3 ; YCDW4 ; YCDW5 ; YCDW6 Then, STM studies find patches of varying local density, which are correlated with oxygen interstitials and vacancies in the Bi-cuprates.Jenny Finally, phase separation has been predicted in Bi-cuprates, most notably between the insulating phase in the undoped cuprate and a doping near ,GML essentially the range we are modeling. As noted above, this leads to NPS. NPS differs from macroscopic phase separation in that in the latter case only two densities are involved, so that properties such as the AF or superconducting (SC) gaps are doping independent. In NPS, the individual domains are so small that properties evolve with doping in each domain type, due to proximity to the other domains.Kapitulnik ; RSMstripes For instance, in oxygen-doped La2CuO4+δ, the excess oxygen remains mobile to temperatures below room temperature. In this case, there is macroscopic phase separation, with a wide doping range where the SC transition temperature has a fixed value close to optimal doping, while the AF Néel temperature is nearly unchanged from its value at zero doping.LCO In contrast, for Sr-doped La2-xSrxCuO4 (LSCO), the ions are immobile, and macroscopic phase separation is replaced by spin-and-charge stripesKT , which can be a form of NPS.VHS00 Recent neutron scattering studies in Bi2201 find an incommensurate spin responseTran2201 very similar to the stripe response found in LSCO,Tranq suggesting that a very similar NPS is found in both LSCO and Bi2201.
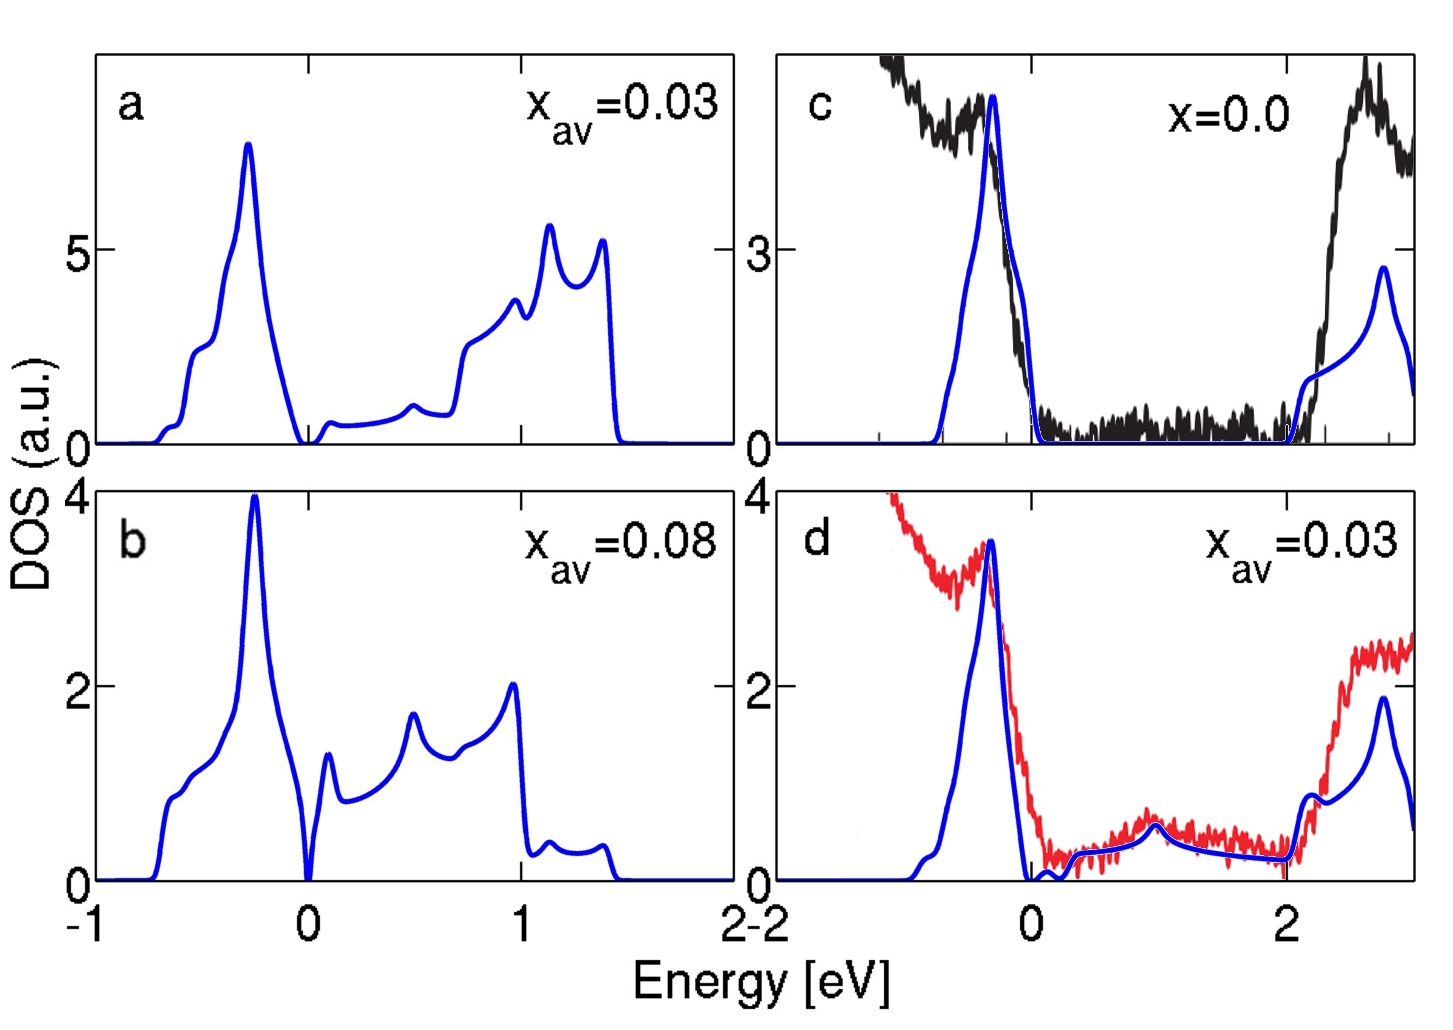
In an NPS model of stripes, the DOS is found to be similar to the superposition of the two separate end phases, and the main effect of nanoscale proximity is to produce small shifts in the density of these end phases – e.g., the undoped insulator phase will acquire a small hole dopingRSMstripes ; foot1 . We adopt this model here. Figure 2 displays the LDOS calculated in the NPS model for Bi2201, frames (a) and (b), and CCOCfoot2 , frames (c) and (d). The dopings for CCOC corresponding to the STM data of Ref. CCOC_STM, which is plotted along with the calculated curves. We assume that each patch contains a stripe-like mix of the two phases, so the resulting LDOS is approximately a superposition of the two components, with a weak Gaussian broadening. For Bi2201, Figure 2(a,b), we assume that the two stable phases have = 0.015 and = 0.09, and generate linear combinations of the respective LDOSs to represent = 0.03, Fig. 2(a) and 0.08, Fig. 2(b). For CCOC, Figure 2(c,d), the stable phases have = 0.0 and = 0.09. This simple picture reproduces the effect of gap filling as a function of doping, rather than the gap closing shown in Fig. 1. In Figs. 2(c,d) the model calculations are compared to experimental data (solid lines with noise). The agreement is quite good – the model captures both the gap edge and the DOS peak (subband VHS), and, for the doped sample, the in-gap dos. Note that at energies eV or eV there is additional DOS weight associated with bands not included in the theory.
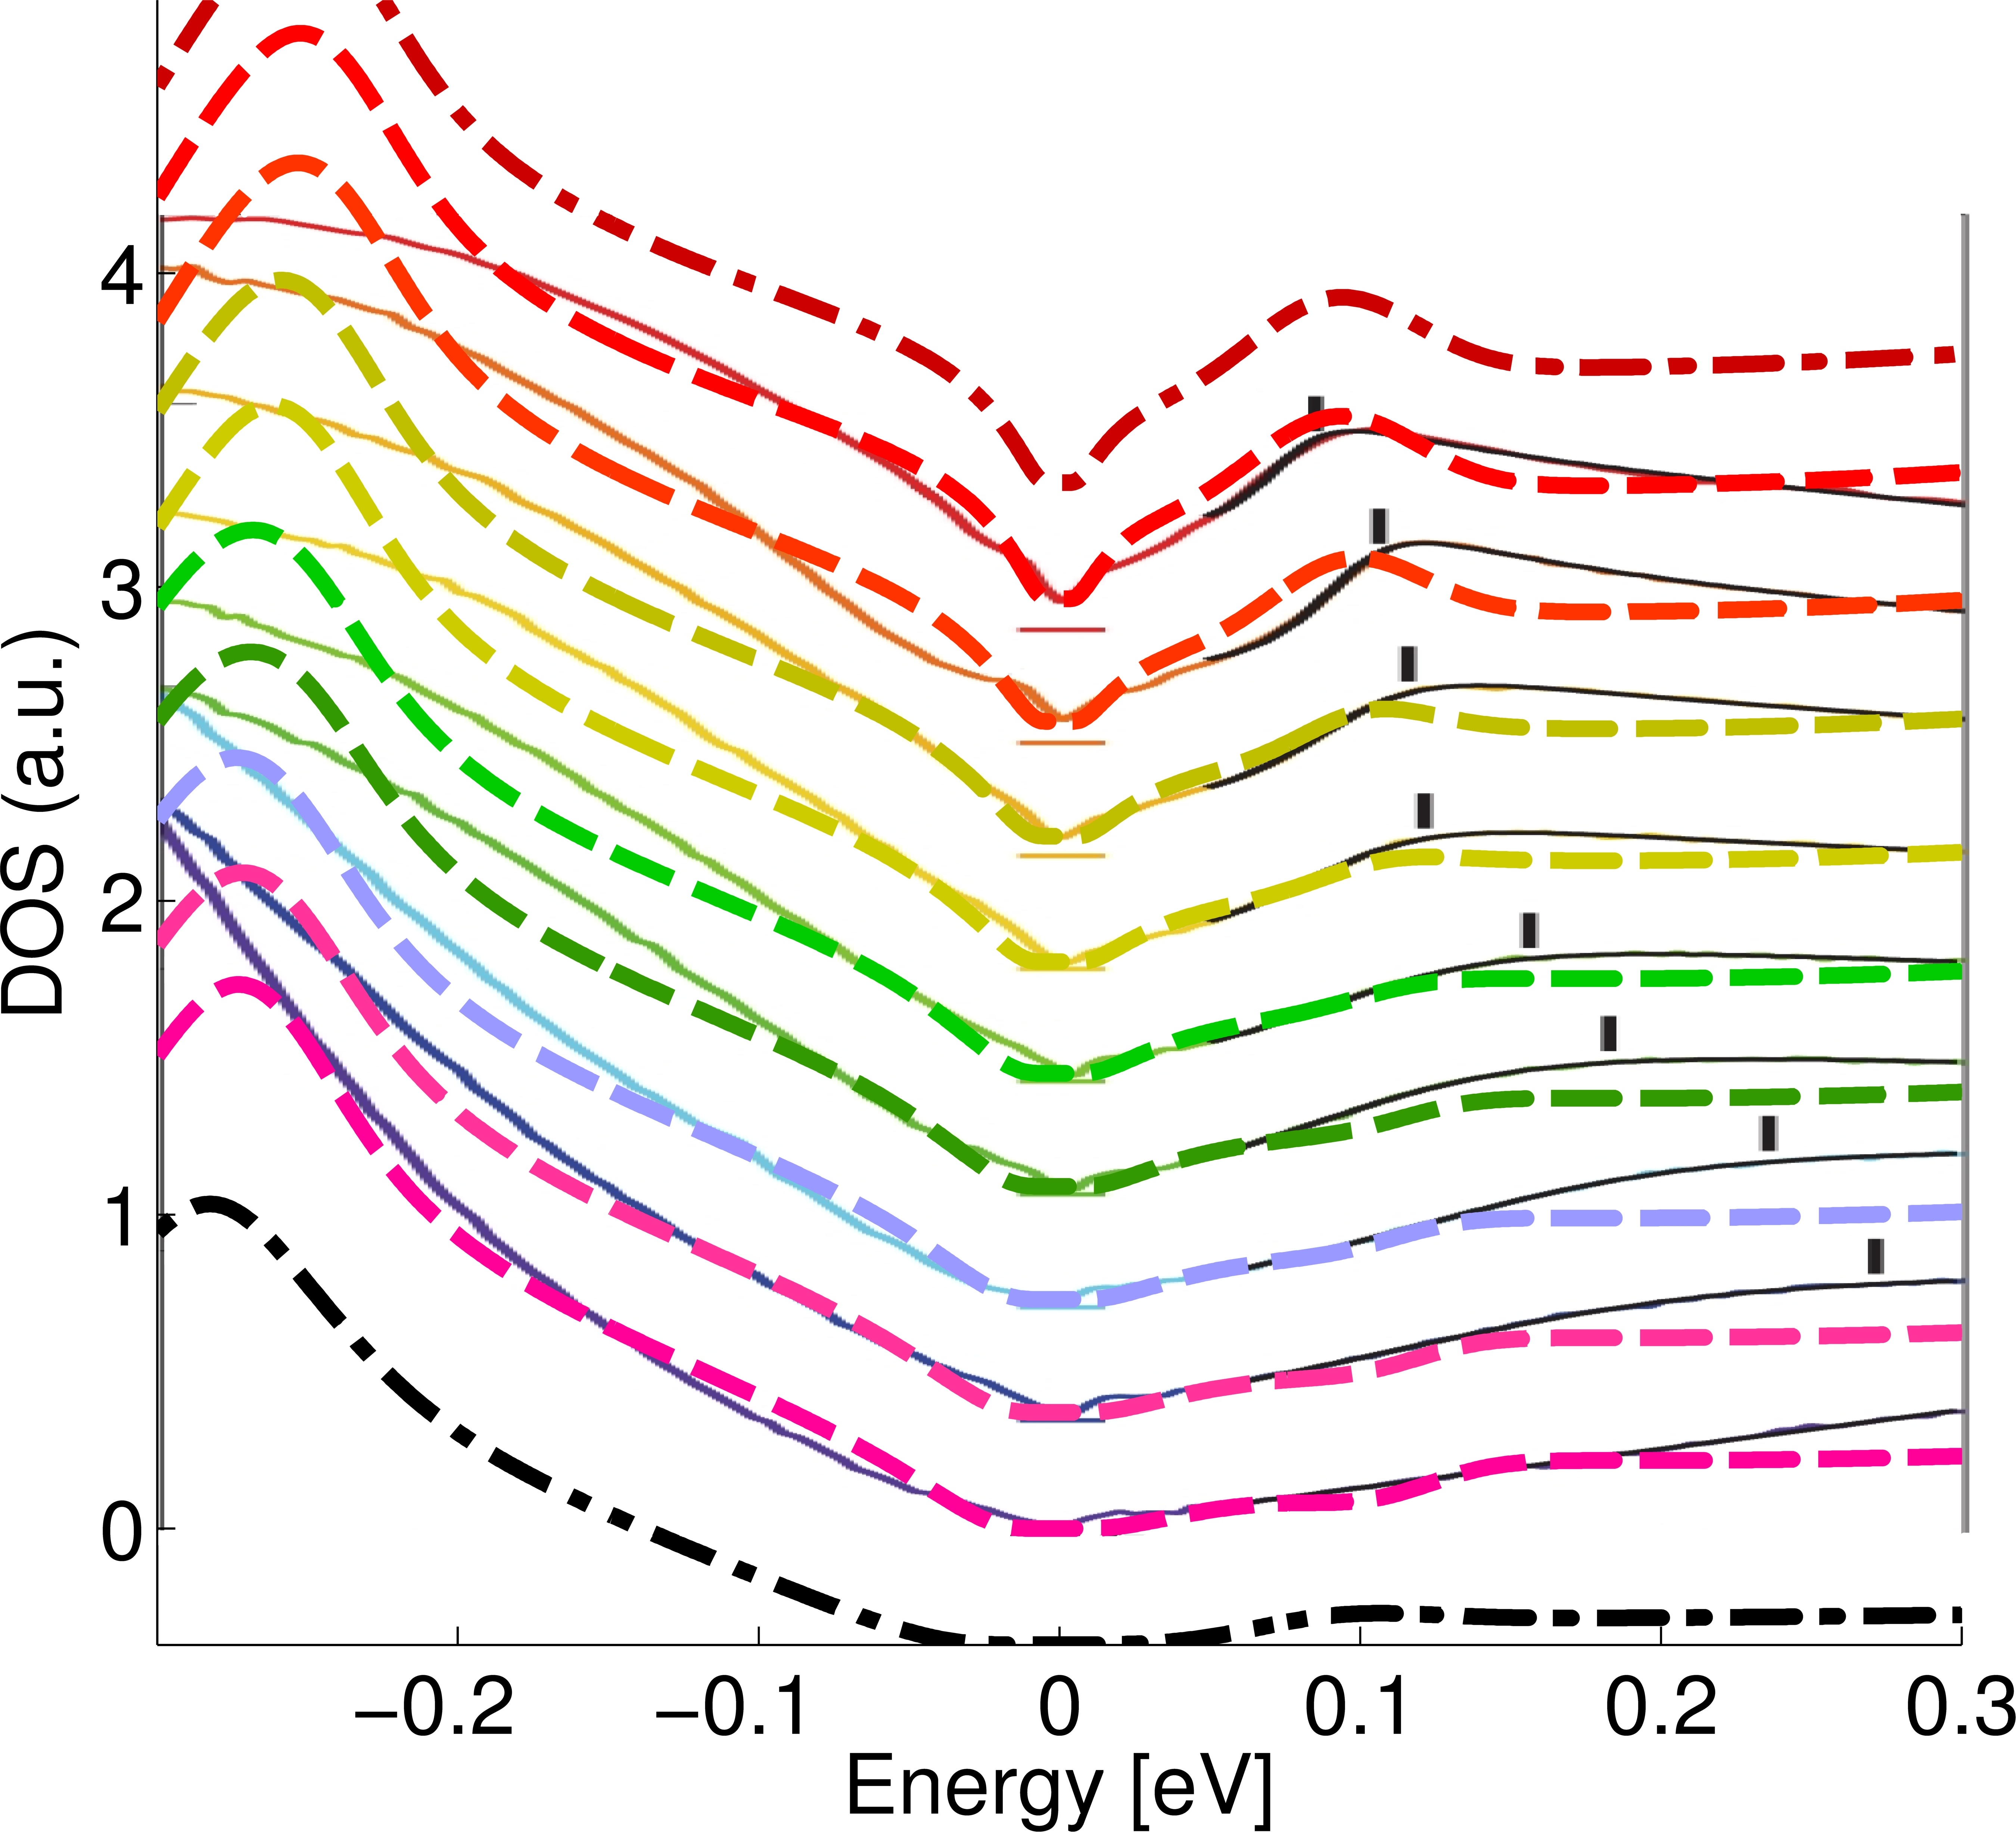
To further verify the model, we have also used this two-component model to describe the wider variety of patches found in Ref Davis_STM, , but over a narrower voltage range, Fig. 3. We will use this data to describe our calculation in more detail. To describe the spectra at low voltages, there is one feature we must add to the model. There is a metal-insulator transition associated with a nodal gapKyle ; ding ; lupi ; Davis_STM ; Inna . Within the present model, this gap arises on the charged stripes (regions of higher doping) and increases as the doping decreases and the stripes separate further. We assume that it is due to stripe pinning by impurities, and model it as a Coulomb gapEfros , as has been suggested previouslyding ; Zhou_nodal_gap . The Coulomb gap is a soft gap in the density of states which is due the the Coulomb interaction of particles on impurity sites. The magnitude of the gap is related to the intensity of the Coulomb interaction. The effect of the Coulomb interaction in two dimensions on the DOS can be calculated self consistently using the following equation derived by EfrosEfros :
| (1) |
where is the resulting DOS at frequency and is the width of the Coulomb gap. is multiplied by the LDOS calculated using the mean field tight-binding model with AF order to simulate the presence of a Coulomb gap. By applying this Coulomb gap and a Gaussian broadening to LDOS for the AF NPS system our model reproduces the characteristic features of the STM data quite well. Namely, the peak above the Fermi energy due to the bottom of the UMB in , the peak below the Fermi energy from the LMB in , and the soft gap with zero states at the Fermi energy due to the Coulomb gap. We note that the stable phase, , must fluctuate a small amount (0.015) to account for the shift in energy of the positive energy peak across regions of the sample. To compensate for the fluctuation, is shifted an equal amount such the the difference in doping between and is 0.075. Table I lists the parameters used for the calculated, dashed curves in Fig. 3 from the top down. The Gaussian broadening in energy has a width of for all calculations.
| LDOS | ||||
|---|---|---|---|---|
| 1 | 0.015 | 0.09 | 20 | 0.07875 |
| 2 | 0.0125 | 0.0875 | 28.3 | 0.074 |
| 3 | 0.007 | 0.082 | 36.7 | 0.067 |
| 4 | 0.005 | 0.08 | 45 | 0.06125 |
| 5 | 0.004 | 0.079 | 53 | 0.0565 |
| 6 | 0.003 | 0.078 | 61.7 | 0.05175 |
| 7 | 0.002 | 0.077 | 70 | 0.047 |
| 8 | 0.001 | 0.076 | 78.3 | 0.04225 |
| 9 | 0.0 | 0.075 | 86.7 | 0.0375 |
The role of NPS or ‘stripe’ physics near a Mott transition has been discussed oftenKT ; Nag ; VHS00 . We note that NPS bears a resemblance to the strong-coupling effect of anomalous spectral weight transfer (ASWT).EMS ASWT is generally interpreted in terms of Mott physics: there is a penalty for putting a second electron on a copper site that is already occupied. Thus, when an electron is removed from a given site, both holes lie at a low energy above the Fermi energy, as there is no -penalty for adding a hole with either spin. Thus, because of ASWT the occupation of the upper Hubbard band is not fixed, but decreases with increased hole doping. In an intermediate coupling model, the Mott gap becomes an AF gap. In the presence of NPS, adding a hole creates a region of higher doping, where the AF gap is considerably smaller, so the second hole is shifted to a much lower energy – e.g., as in Fig. 2 – just as in ASWT. Finally, in the strong coupling regime there is a tendency for atoms with two holes to cluster, to increase the kinetic energy without introducing a -penalty, thus providing an additional link with NPS.
In conclusion, we have demonstrated that the gap filling – rather than gap closing – found in STM studies of extremely underdoped Bi2201 is most naturally understood in terms of NPS, as had been predicted in this doping rangeGML . Local stripes would be strongly pinned by impurities, naturally explaining the occurance of a nodal gap, a metal-insulator transition, and spin-glass-like phenomena found in underdoped cuprates. The model further predictsGML the coexistence of AF order and an incommensurate SDW phase, as has recently been observed in the closely related compound, LSCO.AFSDW .
Acknowledgments This research is supported by the US Department of Energy, Office of Science, Basic Energy Sciences contract DE-FG02-07ER46352, and benefited from Northeastern University’s Advanced Scientific Computation Center (ASCC), theory support at the Advanced Light Source, Berkeley, and the allocation of supercomputer time at NERSC through grant number DE-AC02-05CH11231.
References
- (1) H. Eskes, M.B. Meinders, and G.A. Sawatzky, Phys. Rev. Lett. 67, 1035 (1991).
- (2) R.S. Markiewicz, Tanmoy Das, and A. Bansil, Phys. Rev. B 82, 224501 (2010).
- (3) R.S. Markiewicz, Phys. Rev. B 70, 174518 (2004).
- (4) N.F. Mott, Phil. Mag B50, 161 (1984).
- (5) Y. Kohsaka, T. Hanaguri, M. Azuma, M. Takano, J. C. Davis, H. Takagi. Nature Physics 8, 543 (2012).
- (6) R.S. Markiewicz and A. Bansil, Phys. Rev. Lett. 96, 107005 (2006).
- (7) Cun Ye, Peng Cai, Runze Yu, Xiaodong Zhou, Wei Ruan, Qingqing Liu, Changqing Jin, and Yayu Wang, Nature Communications 4, 1365 (2013).
- (8) Yayu Wang, SNS 2013.
- (9) G. Seibold, R.S. Markiewicz, and J. Lorenzana, Phys. Rev. B 83, 205108 (2011).
- (10) J. Nieminen, I. Suominen, T. Das, R. S. Markiewicz, and A. Bansil. Phys. Rev. B. 85, 214504 (2012).
- (11) R.S. Markiewicz, S. Sahrakorpi, M. Lindroos, H. Lin, and A. Bansil, Phys. Rev. B 72, 054519 (2005).
- (12) P. Mistark, H. Hasnain, R. S. Markiewicz, and A. Bansil. arXiv:1403.2316
- (13) W.D. Wise, Kamalesh Chatterjee, M.C. Boyer, Takeshi Kondo, T. Takeuchi, H. Ikuta, Zhijun Xu, Jinsheng Wen, G.D. Gu, Yayu Wang, and E.W. Hudson, Nature Physics 5, 213 (2009).
- (14) T. Wu, H. Mayaffre, S. Krämer, M. Horvatić, C. Berthier, W.N. Hardy, Ruixing Liang, D.A. Bonn, and M.-H. Julien, Nature 477, 191 (2011).
- (15) G. Ghiringhelli, M. Le Tacon, M. Minola, S. Blanco-Canosa, C. Mazzoli, N. B. Brookes, G.M. De Luca, A. Frano, D.G. Hawthorn, F. He, T. Loew, M. Moretti Sala, D.C. Peets, M. Salluzzo, E. Schierle, R. Sutarto, G.A. Sawatzky, E. Weschke, B. Keimer, and L. Braicovich, Science 337, 821 (2012).
- (16) A.J. Achkar, R. Sutarto, X. Mao, F. He, A. Frano, S. Blanco-Canosa, M. Le Tacon, G. Ghiringhelli, L. Braicovich, M. Minola, M. Moretti Sala, C. Mazzoli, Ruixing Liang, D.A. Bonn, W.N. Hardy, B. Keimer, G.A. Sawatzky, and D.G. Hawthorn, Phys. Rev. Lett. 109, 167001 (2012).
- (17) J. Chang, E. Blackburn, A.T. Holmes, N.B. Christensen, J. Larsen, J. Mesot, Ruixing Liang, D.A. Bonn, W.N. Hardy, A. Watenphul, M. v. Zimmermann, E.M. Forgan, and S.M. Hayden, Nature Physics 8, 871 (2012).
- (18) D. LeBoeuf, S. Krämer, W.N. Hardy, Ruixing Liang, D.A. Bonn, and C. Proust, Nature Physics 9,79 (2013),
- (19) E. Blackburn, J. Chang, M. Hucker, A.T. Holmes, N.B. Christensen, Ruixing Liang, D.A. Bonn, W N. Hardy, M. v. Zimmermann, E.M. Forgan, and S.M. Hayden, Phys. Rev. Lett. 110, 137004 (2013).
- (20) I. Zeljkovic, Z. Xu, J. Wen, G. Gu, R. S. Markiewicz, and J. E. Hoffman, Science 337, 320 (2012).
- (21) A.C. Fang, L. Capriotti, D.J. Scalapino, S.A. Kivelson, N. Kaneko, M. Greven, and A. Kapitulnik, Phys. Rev. Lett. 96, 017007 (2006).
- (22) R.S. Markiewicz. Phys. Rev. B. 62, 1252 (2000).
- (23) J.D. Jorgensen, B. Dabrowski, S. Pei, D.G. Hinks, L. Soderholm, B. Morosin, J.E. Schirber, E.L. Venturini, and D.S. Ginley, Phys. Rev. B38, 11337 (1988); M.S. Hundley, J.D. Thompson, S.-W. Cheong, Z. Fisk, and J.E. Schirber, Phys. Rev. B41, 4062 (1990); P.C. Hammel, A.P. Reyes, Z. Fisk, M. Takigawa, J.D. Thompson, R.H. Heffner, S.-W. Cheong, and J.E. Schirber, Phys. Rev. B 42, 6781 (1990).
- (24) S.A. Kivelson, I.P. Bindloss, E. Fradkin, V. Oganesyan, J.M. Tranquada, A. Kapitulnik, and C. Howald, Rev. Mod. Phys. 75, 1201 (2003).
- (25) R.S. Markiewicz, J. Phys. Chem. Solids 58, 1179 (1997).
- (26) M. Enoki, M. Fujita, T. Nishizaki, S. Iikubo, D.K. Singh, S. Chang, J.M. Tranquada, and K. Yamada, Phys. Rev. Lett. 110, 017004, (2013).
- (27) J.M. Tranquada, B.J. Sternlieb, J.D. Axe, Y. Nakamura, and S. Uchida, Nature 375, 561 (1995); J.M. Tranquada, J.D. Axe, N. Ichikawa, A.R. Moodenbaugh, Y. Nakamura, and S. Uchida, Phys. Rev. Lett 78, 338 (1997).
- (28) There should also be minigaps, but we assume these are washed out by fluctuations and disorder.
- (29) Tight binding parameters for CCOC were approximated by the tight binding parameters for Bi2212 found in [JoukoDoping, ].
- (30) K.M. Shen, T. Yoshida, D.H. Lu, F. Ronning, N.P. Armitage, W.S. Lee, X.J. Zhou, A. Damascelli, D.L. Feng, N.J.C. Ingle, H. Eisaki, Y. Kohsaka, H. Takagi, T. Kakeshita, S. Uchida, P.K. Mang, M. Greven, Y. Onose, Y. Taguchi, Y. Tokura, Seiki Komiya, Yoichi Ando, M. Azuma, M. Takano, A. Fujimori, and Z.-X. Shen, Phys. Rev. B 69, 054503 (2003).
- (31) Z. -H. Pan, P. Richard, Y. -M. Xu, M. Neupane, P. Bishay, A. V. Fedorov, H. -Q. Luo, L. Fang, H. -H. Wen, Z. Wang, and H. Ding, Phys. Rev. B 79, 092507 (2009).
- (32) S. Lupi, D. Nicoletti, O. Limaj, L. Baldassarre, M. Ortolani, S. Ono, Yoichi Ando, and P. Calvani, Phys. Rev. Lett. 102, 206409 (2009).
- (33) I.M. Vishik, M Hashimoto, R.-H. He, W.S. Lee, F. Schmitt, D.H. Lu, R.G. Moore, C. Zhang, W. Meevasana, T. Sasagawa, S. Uchida, K. Fujita, S. Ishida, M. Ishikado, Y. Yoshida, H. Eisaki, Z. Hussain, T.P. Devereaux, and Z.-X. Shen, PNAS 109, 18332 (2012).
- (34) Yingying Peng, Jianqiao Meng, Daixiang Mou, Junfeng He, Lin Zhao, Yue Wu, Guodong Liu, Xiaoli Dong, Shaolong He, Jun Zhang, Xiaoyang Wang, Qinjun Peng, Zhimin Wang, Shenjin Zhang, Feng Yang, Chuangtian Chen, Zuyan Xu, T.K. Lee, X.J. Zhou. Nature Communications 4, 2459 (2013).
- (35) A. L. Efros. J. Phys. C: Solid State Phys. 9 2021 (1976).
- (36) E.L. Nagaev, “Physics of Magnetic Semiconductors” (Moscow, Mir, 1983).
- (37) G. Drachuck, E. Razzoli, G. Bazalitski, A. Kanigel, C. Niedermayer, M. Shi, and A. Keren, Nature Communications 5, doi:10.1038/ncomms4390.