Ultimate age-dating method for galaxy groups; clues from the Millennium Simulations
Abstract
There have been a number of studies dedicated to identification of fossil galaxy groups, arguably groups with a relatively old formation epoch. Most of such studies identify fossil groups, primarily based on a large luminosity gap, which is the magnitude gap between the two most luminous galaxies in the group. Studies of these types of groups in the millennium cosmological simulations show that, although they have accumulated a significant fraction of their mass, relatively earlier than groups with a small luminosity gap, this parameter alone is not highly efficient in fully discriminating between the ”old” and ”young” galaxy groups, a label assigned based on halo mass accumulation history.
We study galaxies drawn from the semi-analytic models of Guo et al. (2011), based on the Millennium Simulation. We establish a set of four observationally measurable parameters which can be used in combination, to identify a subset of galaxy groups which are old, with a very high probability. We thus argue that a sample of fossil groups selected based on luminosity gap will result in a contaminated sample of old galaxy groups. By adding constraints on the luminosity of the brightest galaxy, and its offset from the group luminosity centroid, we can considerably improve the age-dating.
keywords:
galaxies: groups : general – galaxies groups: evolution – groups: old or young– galaxies: structure1 Introduction
The age determination for galaxy systems in the hierarchical structure formation is not trivial because, in this paradigm, more massive galaxy systems such as galaxy clusters are formed through the mergers of smaller galaxy systems and are thus generally young galaxy systems. A galaxy group, however, can be recently formed or forming while some could be relatively old if they have not being subject to a substantial merging with other galaxy systems. In fact the answer to the question of age determination should come from the the cosmological simulations where evolutionary history of galaxy systems can be studied. The cosmological dark matter simulations and the implemented semi-analytic galaxy models offer tools, needed to develop an insight into this subject.
Before these robust simulations became available in cosmological scales, an observational method for identification of old galaxy groups was developed in a pioneering study by Ponman et al. (1994). This was motivated by earlier numerical simulations suggesting that in most cases, members of compact galaxy groups could merge to form a single elliptical galaxy in a few billion years (Barnes, 1989). An elliptical galaxy formed by the merger of such a group retains its X-ray emitting halo of hot gas, which is unaffected by merging (Ponman et al., 1994). Such groups were called fossil groups in which the essential observational tracer has been identified as the large luminosity gap between the two brightest group members.
According to the convention introduced by Jones et al. (2003) fossil groups have a magnitude gap of at least 2 magnitude within 0.5 virial radius and h erg s-1. Since then there have been many studies focused on the detailed characterisation and properties of fossil groups (Khosroshahi, Jones, & Ponman, 2004a; Sun et al., 2004; Ulmer et al., 2005; Khosroshahi, & Ponman, 2006), based on X-ray and optical observations. However, due to limited number of adequate X-ray surveys and their suitability, most studies selected the magnitude gap as the fossil identifier in theoretical and observational studies (Yoshioka et al., 2004; Milosavljevic et al., 2006; Van den Bosch et al., 2007), hydrodynamic simulations (D’Onghia et al., 2005), dark matter simulations (Von Benda-Beckmann et al., 2008; Cui et al., 2011) and combined with semi-analytical models for galaxies (Sales et al., 2007; Díaz-Giménez et al., 2008; Dariush et al., 2010). Khosroshahi, Ponman and Jones (2007) show that for a given optical luminosity, fossil groups are not only more X-ray luminous than the general population of galaxy groups, but also they have a more concentrated halo as well as hotter IGM for a given halo mass. The study of scaling laws of fossil groups also show that they mostly follow the trend of galaxy clusters which is likely to be driven by their dynamical relaxed state, although Voevodkin et al. (2010) have shown that in the cluster regime there are no noticeable difference between the X-ray luminosity of the fossils and non-fossils for a given optical luminosity. In addition, some other studies support the same conclusion employing other cluster samples (Aguerri et al., 2011; Harrison et al., 2012; Girardi et al., 2014).
One of the largest cosmological simulations, the Millennium Simulation (Springel et al., 2005) joined with Semi-Analytical Models (SAMs) for galaxy formation, provide a useful tool to address open questions, regarding the age determination of the galaxy systems. Dariush et al. (2007) show that the luminosity gap is a fairly good indicator of the halo mass assembly, such that in galaxy groups with a large luminosity gap (), the halos accumulate 50 per cent of their mass at current epoch by and thus are relatively older than their counterparts with small luminosity gap. Dariush et al. (2010) introduce an alternative optical criterion m, i.e. the luminosity gap between the first and fourth brightest galaxies within , which is found to be more efficient in identifying early-formed groups than the conventional criterion, m.
Following the discovery of the fossils groups with different masses, from surveys or serendipitous observations, there has been attempts to study and compare various halo, IGM and galaxy properties of fossil and non-fossil groups (Khosroshahi, Ponman and Jones, 2007; Dupke et al., 2010; Miller et al., 2012). The velocity dispersion of the member galaxies in groups (Herbst et al., 2012; Madrid et al., 2013), the globular cluster distribution and colour (Alamo-Martínez et al., 2012), the galaxy luminosity function (Cypriano et al., 2006; Lieder et al., 2013), the AGN activities of the groups (Hess et al., 2012; Miraghaee et al., 2013), merger history (Eigenthaler et al., 2013; Díaz-Giménez et al., 2008) and halo concentration (Khosroshahi, Ponman and Jones, 2007; Deason et al., 2013) are amongst these properties. The basic argument upon which these studies are based, is the early formation of fossils groups. The older age of fossil group has been argued in the earlier studies (Ponman et al., 1994; Jones et al., 2003) and demonstrated in the cosmological simulations (D’Onghia et al., 2005; Dariush et al., 2007). However there is still room to develop age dating algorithms with a high efficiency using measurable parameters accessible from routine optical observations and other convenient methods.
In this paper, we first show the extend at which the large luminosity gap can discriminate old and the young galaxy groups. We then introduce a some parameters in which the old and young galaxy groups can be identified more distinctively. We finally define a parameter space which consists of optically measurable parameters of group galaxies, that allow age-dating with a very high efficiency.
Section 2 describes Millennium Simulation and Semi-Analytical Model. In section 3 we describe our multi-parameter analysis to search for old and young groups using the optical measurements. Finally in section 4 present summery of our result and given our conclusion.
2 The simulation
In this study we use the public release of the Millennium Simulation(Hereafter: MS) (Springel et al., 2005). The cosmological model adopted in simulation is a CDM with the following parameters: , , , h=0.73, n=1, (note that the value of is assumed to be greater than its present value of 0.82 given by WMAP9 that is not strongly affects in this study). The simulation box contains particles and presents the mass resolution of 8.6 108 h-1 M⊙.
The dark matter merger trees within each simulation snapshot (64 snapshots) are expanded approximately logarithmically in time between and and extracted from the simulation using a combination of friends-of-friends (FoF) (Davis, 1985) and SUBFIND (Springel et al., 2001) halo finders algorithm. The gas and stellar components of galaxies in dark matter halos are constructed semi-analytically, based on differ in the phenomenological recipes.
For galaxy properties, we use Guo et al. (2011) semi-analytical model, in which the treatments of many of the physical processes have been improved in comparison to an earlier model by De Lucia & Blaizot (2007). This model provides good fits to the observed luminosity and stellar mass functions of galaxies, from the SDSS data and recent determinations of the abundance of satellite galaxies around the Milky Way and the clustering properties of galaxies as a function of stellar mass, as well. Data available in the Millennium database (Lemson et al., 2006), contains halos with masses above 1013 h-1 M⊙ and million galaxies from which we only select galaxies brighter than in r-band absolute magnitude for completeness.
3 Analysis and results
3.1 Age-dating based on luminosity gap
3.1.1 m12
As mentioned earlier, the magnitude gap between the brightest and second brightest galaxies in a galaxy group, is often used as an indicator of the dynamical age of groups of galaxy. Dariush et al. (2010) investigated the assembly of groups and clusters of galaxies using the Millennium dark matter simulation and semi-analytic catalogues of galaxies. The study aimed at verifying the argument that galaxy groups with a large magnitude gap are formed earlier than the galaxy groups with a small magnitude gap. They used mass accumulation of the group halo as a proxy for early/late halo formation. They selected galaxy groups and clusters at the present time with dark matter halo mass , and trace their properties to . In addition they applied an X-ray luminosity criteria to keep those galaxy systems for which the X-ray luminosity at redshift . They argued that while it is true that a large magnitude gap between the two brightest galaxies of a particular group often indicates that a large fraction of its mass was assembled at an early epoch, it is not a necessary condition. More than 90% of fossil groups defined on the basis of their magnitude gaps (at any epoch between ) cease to be fossils within 4 Gyr, mostly because other massive galaxies are assembled within their cores, even though most of the mass in their haloes might have been assembled at early times.
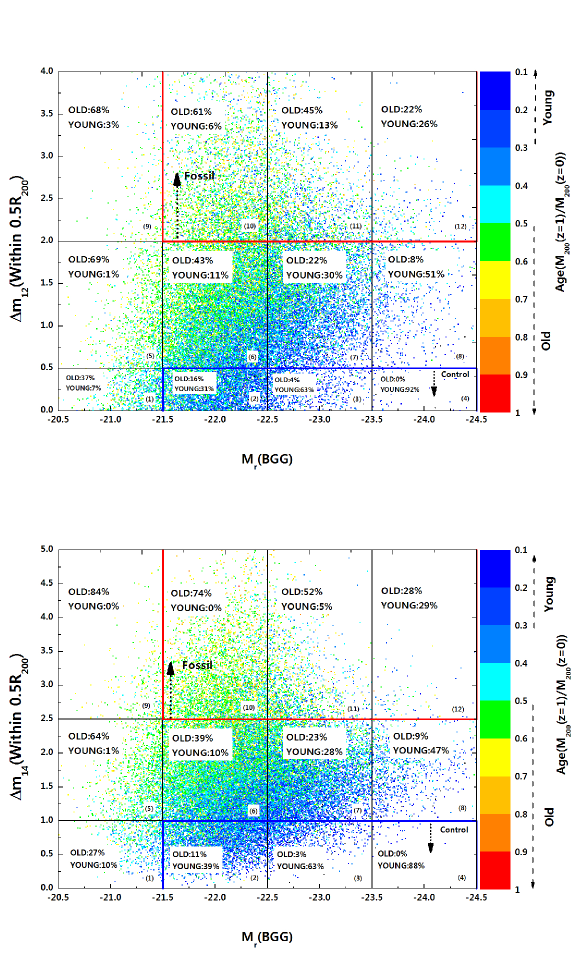
As a definition here (and Dariush et al., 2007), a galaxy group which formed more than 50 per cent of its total mass by is labled as old. A group is labelled young if less than 30 per cent of its final mass is formed by . In Figure 1 top panel, we present the luminosity gap m12 (within 0.5R200) as a function of the Brightest Group Galaxy (BGG) magnitude in r-band, , given for all 39132 groups (i.e. groups with 1013 h-1M⊙ and exist within both and ) using Guo et al. (2011) SAM at the present epoch. The groups are colour-coded according to their parameters(defined as ”age” of systems), where . The horizontal line subdivides groups into magnitude gap bins. Those with m are conventional fossil groups. Groups with m are labelled as control groups which known to be young galaxy groups (Dariush et al., 2007, 2010). Vertical lines bin the groups according to the luminosity of their brightest galaxy (BGG) in 4 magnitude bins from -20.5 to -24.5. We note that the systems with large magnitude gap and faint BGGs are modest galaxies with some dwarf satellites, similar to the Milky Way. As these systems do not present galaxy groups, satisfying fossil groups condition, we limit our analysis to BGGs which are at least as bright as , i.e giant galaxies. This diagram shows that the galaxy luminosity gap combined with the luminosity of the brightest group galaxy for all halo mass over is success to identify old groups with a probability of 61 per cent and young galaxy group with a probability of 92 per cent.
3.1.2 m14
The assembly time of a dark matter halo defined as the look-back time when its main progenitor reaches a mass that is more than 50 per cent of the present halo mass. Dariush et al. (2010) showed that the alternative optical criterion m (in the R-band, within of the centre of the group) is more efficient in identifying early-formed groups than the conventional criterion m and it is more success to identify at least 50% more early-formed groups. However, the conventional criterion (m) performs marginally better at finding early-formed groups at the high-mass end of groups. Figure 1 Bottom panel shows distribution of luminosity gap m14 within combined with the Brightest Galaxy Group (BGG) magnitude in r-band. In this diagram panels (5), (9) and (10) contain mostly old systems while the panels (3), (4) and (8) are mostly occupied by young systems. The mentioned panels can identify old groups with a probability of at most 74 per cent and young galaxy group with a probability, up to 88 per cent.
3.2 Other age indicators
3.2.1 Halo concentration
It has been shown that the halo concentration is linked to the epoch of the halo formation (Wechsler et al., 2002). There are different ways to estimate halo concentration in the literature. A popular method is by fitting a NFW (Navarro, Frenk, & White, 1996) profile shows in eq. 1 to the halo density distribution
| (1) |
where and and are the characteristic density and radius. Then the halo concentration() is found as eq.2
| (2) |
where is the ratio of as enclosing a mean density of 200 times the critical rather than the cosmological mean density to the characteristic radius .
Considering the relation between halo mass and concentration, lower mass halos universally form at earlier epochs relative to higher mass halos (Gao et al., 2008; Prada et al., 2012). Therefore, the lower mass halos must be more concentrated (Wechsler et al., 2002). Due to this close connection between halo concentration and assembly history; group halos that formed most of their halo mass at early times are also more concentrated in comparison to the halos with later formation epoch (Deason et al., 2013). Observationally, for a given optical luminosity, fossil groups have more concentrated halos as well as hotter IGM for a given halo mass (Khosroshahi, Ponman and Jones, 2007).
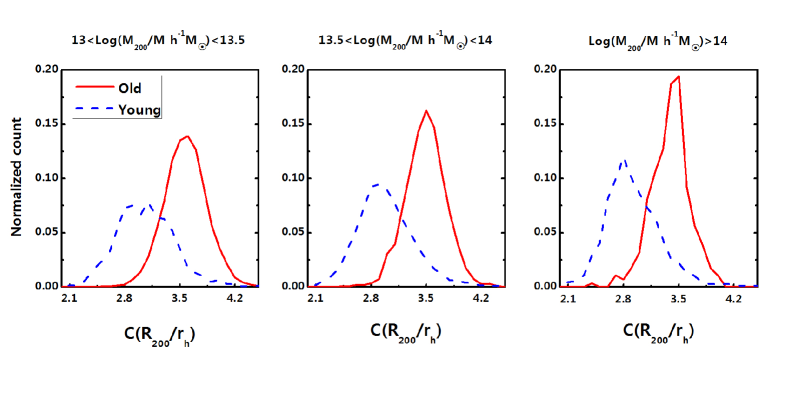
Using the Millennium simulations, Ludlow et al. (2012) demonstrated that, the virial-to-half mass radius, in which is the half-mass radius, is a reliable tracer for the halo concentration. We thus estimate the halo concentration as the ratio between the and half-mass radius for all candidates for old and young systems. As expected, in Figure 2, the halos of early formed groups show higher concentration compared to the same in late formed groups. While the bimodal distribution of the halo concentration between the old and the young groups (Figure 2) appears to be very attractive for discriminating these two type of groups, there are significant observational limitations.
Observationally, the halo concentration can be obtained from any observations that can provide halo profile measurement, such as the the X-ray observations of the hot gas, strong/weak gravitational lensing and galaxy distribution within the group/cluster halo.
The X-ray method of measuring the halo mass/density profile is built upon the hydrostatic equilibrium assumption where the gravitational contraction is balanced by the hot gas pressure. This requires measurements of the gas density and the temperature profile which can be obtained from X-ray observations. In practice, additional assumptions are made, such as the spherical symmetry (Khosroshahi, Jones, & Ponman, 2004a; Humphrey et al., 2006) to obtain the halo mass/density profile (Fabricant et al., 1984; Pratt & Arnaud, 2005; Khosroshahi et al., 2006a). Usually a NFW profile (eq. 1) is fitted to the total gravitational mass density which results in the halo concentration parameter according to eq. 2.
The gravitational lensing method of mass profile reconstruction, is based on the observations of strong arc shaped features of a distant background source (Fort & Mellier, 1994) or the observation of lens induced shear on the shape of the source galaxies by a lens galaxy cluster (Miralda-Escude, 1991; Kaiser et al., 1993; Wilson et al., 2001). These methods are observationally demanding, requiring high quality photometric and spectroscopic measurements, and can only provide a projected mass density for the lensing cluster (see Leauthaud et al., 2007, 2010). In particular the case of galaxy groups is challenging due to a low lensing signal and stacking of groups may be necessary (Hoekstra et al., 2001). The lensing method of halo mass measurement is only efficient in intermediate redshift range (Smith et al., 2005; Oguri et al., 2010), while there are many sources of systematic errors in weak lensing (Mandelbaum et al., 2005; Johnston et al., 2007).
There are a limited number of observations which can provide halo concentration of galaxy groups and clusters with a reasonable uncertainty. One of the largest samples of galaxy clusters, studied as part of the LoCuSS project (Smith et al., 2010), points at limited statistics on galaxy clusters for which the halo concentration is measured and also a typically 20 per cent uncertainty in X-ray measurements of the halo concentration, (Sanderson et al., 2009). Similarly, Khosroshahi et al. (2006a) in the study of fossil galaxy cluster reported a large uncertainty in the concentration, as high as per cent. Thus, halo concentration measurements obtained from gravitational lensing and/or X-ray observations may be subject to large uncertainties (Mandelbaum et al., 2005, 2006a, 2006b; Johnston et al., 2007; Oguri et al., 2010; Shan et al., 2010a, b).
3.2.2 Luminosity de-centring
Typically, galaxy formation models assume that the brightest group galaxy is located at the centre of group halos, however, Skibba et al. (2011) demonstrated that the BGG may not always be the central galaxy. In fact, merging systems are dynamically unrelaxed which can result in a significant separation between the brightest galaxy and the halo centre. This quantity has been used as a tracer of the dynamical age of the galaxy groups. For instance, Rasmussen et al. (2012) in a study of ongoing star formation of groups, use the separation of the brightest group galaxy from the luminosity centroid of member galaxies in the group as an age indicator for the galaxy groups. The X-ray emission peak, or the centroid, and the mass centroid from the gravitational lensing observations, have also been used as indicators of the halo centre (Dietrich et al., 2012; Oguri et al., 2010).
One of the interesting properties of the fossil groups is revealed by their X-ray morphology. The X-ray peak coincides very well with the centre of the dominant giant elliptical galaxy (Khosroshahi, Ponman and Jones, 2007). Relaxed morphology of the clusters or absence of substructures are good indicators of the dynamical state of the galaxy systems (Smith et al., 2005). Smith et al. (2010) shows that clusters with dominant galaxy at the centre are the one with least substructure and are thus dynamically old.
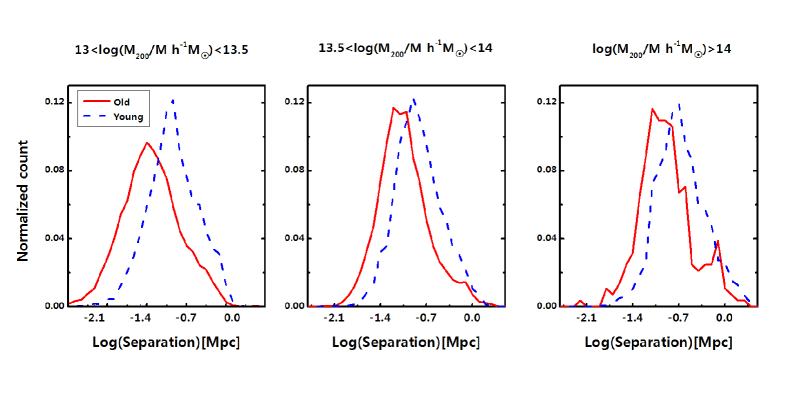
In the absence of X-ray or lensing mass maps, one can resort to optical luminosity distribution. We thus define the luminosity weight of each groups as , where is the luminosity of galaxy in group in r-band and is the projected coordinate of each galaxy. The de-centring parameter is thus defined as the projected physical separation between the luminosity centroid of the group and the location of the BGG. As shown in Figure 3 younger systems show larger separation between BGG and the luminosity centroid of the galaxies in comparison to the old groups. This parameter can also be replaced with the separation between the BGG and other halo centroid indicators such as the one obtained from gravitational lensing and/or X-ray observations, however, our choice has the advantage of being optically measurable.
| Group luminosity | m12 | probability(old/young) | |||
|---|---|---|---|---|---|
| [Mpc] | [mag] | [mag] | [per cent] | [Ratio | |
| 1.920.27 | 2.5 – 2.0 | 4.0 – 4.5 | 21.5 – 22.5 | 100% old | 223.253.0 |
| 1.920.27 | 2.5 – 2.0 | 3.0 – 3.5 | 21.5 – 22.5 | 96% old | 217.245.0 |
| 1.920.27 | 1.5 – 1.0 | 3.5 – 4.0 | 21.5 – 22.5 | 90% old | 17834.4 |
| 1.920.27 | 2.0 – 1.5 | 3.5 – 4.0 | 21.5 – 22.5 | 88% old | 22257.4 |
| 1.920.27 | 2.5 – 2.0 | 2.0 – 2.5 | 21.5 – 22.5 | 86% old | 214.751.0 |
| 1.920.27 | 2.0 – 1.5 | 3.0 – 3.5 | 21.5 – 22.5 | 86% old | 219.351.0 |
| 1.920.27 | 2.5 – 2.0 | 2.5 – 3.0 | 21.5 – 22.5 | 85% old | 20939.0 |
| 1.920.27 | 2.0 – 1.5 | 2.0 – 2.5 | 21.5 – 22.5 | 84% old | 20649.0 |
| 1.920.27 | 2.0 – 1.5 | 2.5 – 3.0 | 21.5 – 22.5 | 83% old | 21345.0 |
| 1.920.27 | 2.5 – 2.0 | 1.5 – 2.0 | 21.5 – 22.5 | 80% old | 20644.0 |
| 20.2757.2 | 1.5 – 1.0 | 2.5 – 3.0 | 22.5 – 23.5 | 53% old | 18149.8 |
| 20.2757.2 | 2.0 – 1.5 | 2.0 – 2.5 | 22.5 – 23.5 | 50% old | 171.635.7 |
| 20.2757.2 | 1.5 – 1.0 | 2.0 – 2.5 | 22.5 – 23.5 | 48% old | 176.835.0 |
| 20.2757.2 | 1.0 – 0.5 | 2.5 – 3.0 | 22.5 – 23.5 | 47% old | 14741.2 |
| 20.2757.2 | 2.0 – 1.5 | 1.5 – 2.0 | 22.5 – 23.5 | 43% old | 183.235.5 |
| 20.2757.2 | 1.0 – 0.5 | 0.0 – 0.5 | 22.5 – 23.5 | 58% young | 151.3 35.0 |
| 20.2757.2 | 2.5 – 2.0 | 0.0 – 0.5 | 21.5 – 22.5 | 56% young | 17630.0 |
| 20.2757.2 | 1.0 – 0.5 | 0.0 – 0.5 | 21.5 – 22.5 | 54% young | 15035.3 |
| 20.2757.2 | 1.5 – 1.0 | 0.0 – 0.5 | 21.5 – 22.5 | 51% young | 162.4 35.0 |
| 20.2757.2 | 0.5 – 0.0 | 3.0 – 3.5 | 22.5 – 23.5 | 48% young | 108.543.7 |
| 20.2757.2 | 0.5 – 0.0 | 4.0 – 4.5 | 21.5 – 22.5 | 43% young | 121.5 34.0 |
| 57.2 | 0.5 – 0.0 | 0.0 – 0.5 | 23.5 – 24.5 | 97% young | 17925.5 |
| 57.2 | 1.0 – 0.5 | 0.5 – 1.0 | 23.5 – 24.5 | 89% young | 186.526.0 |
| 57.2 | 1.5 – 1.0 | 0.0 – 0.5 | 21.5 – 22.5 | 88% young | 176.227.2 |
| 57.2 | 0.5 – 0.0 | 0.5 – 1.0 | 23.5 – 24.5 | 87% young | 166.131.0 |
| 57.2 | 1.0 – 0.5 | 0.0 – 0.5 | 21.5 – 22.5 | 77% young | 155.733.8 |
| 57.2 | 1.5 – 1.0 | 0.0 – 0.5 | 23.5 – 24.5 | 76% young | 18721.5 |
3.3 Age-dating based on optical observations; A 4-dimensional parameter space
Age-dating base on halo concentration and other halo parameters method will rarely be possible to apply in practice, thus we look for a method using only parameters which are commonly available.
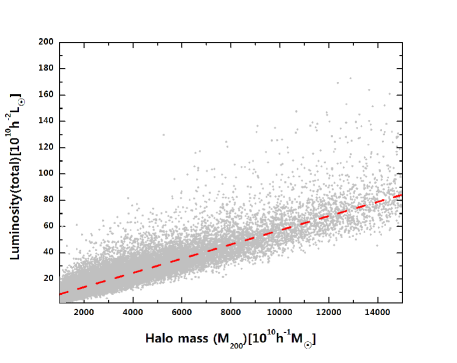
A 4-dimensional parameter space can be constructed based upon galaxy properties and using optical observations, only. It has been shown that the total luminosity of a galaxy group is a fair indicator of the halo mass (Tavasoli et al., 2012). Figure 4 shows the correlation between groups total luminosity (within ) and halo mass. Using a linear fit to our data we find that the mass ranges of , and generally correspond to total luminosity ranges of , , , respectively. While the halo concentration is found to be a good age indicator, in this 4-dimensional approach, we assume that only photometric observations of galaxy groups is available. These observations should be such that the two brightest groups members can be identified, for instance through spectroscopic observations. The total luminosity can be estimated through red-sequence fitting or similar methods which allow statistical memberships identifications.
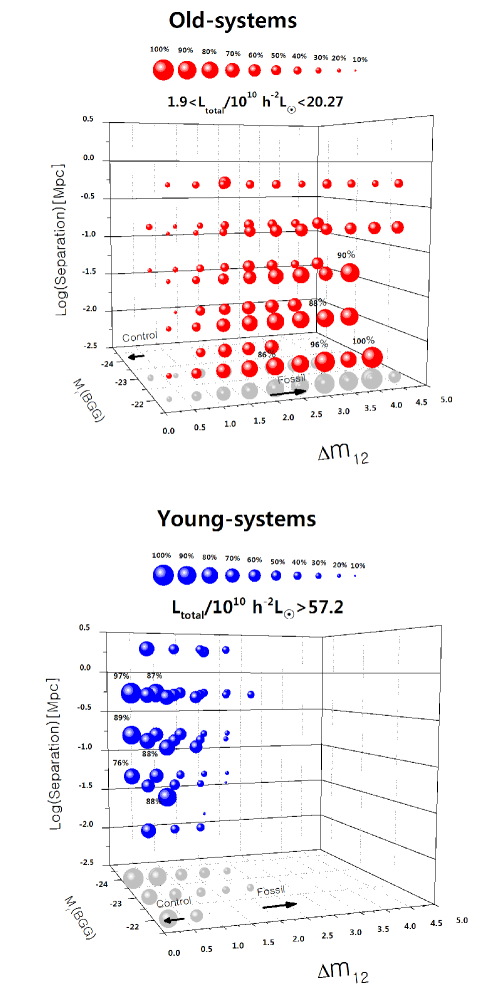
Figure 5 shows the probability for a system to be considered as old (top) and young (bottom) based on the observable 4-dimensional parameter space. The parameter space consists of the total group optical luminosity, luminosity of the BGG, luminosity gap () and luminosity de-centring. In this Figure, size of the symbols (balls) indicate the oldness probability for given sub-region in the parameter space. The luminosity de-centring and the radius at which the magnitude gap, , has been estimated are all projected. We note that the improves the statistical probability of old/young groups (Figure 1), however, we prefer to use due to relative ease of its measurement in spectroscopic surveys. For instance the groups for which the is measured in Sloan Digitized Sky Survey (DR10) accounts for 10% of the groups for which the can be obtained. In addition, has been used widely in the majority of the studies to date.
As an example galaxy groups with a total luminosity of 1.91010 h-2L⊙ through 20.27 1010 h-2L⊙, and and Mr(BGG) mag, with a are 100 per cent old, according to our definition of age, which is based on mass accumulation history of the halo. As Figure 5 reveals, systems with low total luminosity show the highest population of old galaxy groups. Moreover for a galaxy group to be considered as old, the luminosity gap should be large while the luminosity segregation should be small.
Bottom panel in Figure 5 shows the same probability for young galaxy groups. Largest symbol indicates highest probability of galaxy groups been young. As shown youngest systems are found in high total luminosity galaxy groups where the luminosity gap is small and the luminosity segregation is large.
In Table 2. we report few of the highest probability regions to find old and young galaxy groups; and the average mass-to-light ratio() for a given region. Statistically, the old group halos have higher mass-to-light ratio relative to the young group halos.
4 Conclusions
Assigning age to galaxy systems in the Lambda-CDM hierarchical structure formation paradigm is not trivial, but essential, specially when one aims to study the connection between the evolution of the halos to the evolution of galaxies and the properties of the intergalactic medium. We quantify the probability of finding galaxy groups with a given halo mass accumulation history, namely old and young galaxy groups, in the parameter space of the luminosity gap and the BGG luminosity for a given halo mass. We show that there is a limited success in identifying galaxy groups based on the luminosity gap as the statistical probability of finding old groups using this parameter is only , in the Millennium simulations (based on Guo et al. (2011) semi-analytic model for the galaxies).
We define a 4-dimensional parameter space consisting, the optical luminosity of the brightest group galaxy, the optical luminosity difference between the two brightest galaxies in the groups (the luminosity gap), the total luminosity of the group (as a proxy to the group mass) and the physical separation between the luminosity centroid of the galaxy group and its brightest group galaxy. Using this multi-dimensional parameter space we are able to achieve a very high probability in statistical identification of the evolved, e.g. old, and evolving, e.g. young, galaxy groups using purely optical observations. These parameters can be obtained from the optical observations of galaxies alone which are now available from various imaging/spectroscopic surveys.
We note that while the conventional definition of the fossil groups, based on luminosity gap, can result in a contaminated sample of old groups, other probes such as the relaxed X-ray morphology and the co-centring of the X-ray emission and the dominant galaxy in fossil increase the probability of these galaxy groups being old. Observationally, most of the well studied fossil groups (Khosroshahi, Jones, & Ponman, 2004a; Sun et al., 2004; Khosroshahi, & Ponman, 2006; Khosroshahi, Ponman and Jones, 2007) meet these criteria.
We show that old systems have more concentrated halos than young ones in various mass bins, in agreement with Khosroshahi, Ponman and Jones (2007) which showed that for a given optical luminosity, fossil groups have a more concentrated halo, compared to non-fossil groups. However, measuring the halo concentration is still subject to large observational uncertainties, which prevents us to use this parameter for a reliable halo age dating in combination with other observables, routinely available from optical observations of galaxies.
We note that the there may some differences in the galaxy properties assigned to sub halos in different semi-analytic models (Bower et al., 2006; De Lucia & Blaizot, 2007; Guo et al., 2011) but this can only have a minor impact on the the values of the boundaries between the subregions in the parameter space introduced here.
Acknowledgments
The Millennium Simulation database used in this paper and the web application providing online access to them were constructed as part of the activities of the German Astrophysical Virtual Observatory. We thankfully acknowledge Gerard Lemson for facilitating the access to the data.
References
- Aguerri et al. (2011) Aguerri, J. A. L. and Girardi, M. and Boschin, W. and Barrena, R. and Méndez-Abreu, J. and Sánchez-Janssen, R. and Borgani, S. et al, 2011,A&A, 527A, 143
- Alamo-Martínez et al. (2012) Alamo-Martínez, K. A.; West, M. J.; Blakeslee, J. P.; González-Lópezlira, R. A. , et al., 2012, A&A , 546A, 15
- Barnes (1989) Barnes, J.E., 1989, Nature, 338, 123
- Bower et al. (2006) Bower, R. G. and Benson, A. J. and Malbon, R. and Helly, J. C. and Frenk, C. S. and Baugh, C. M. and Cole, S. and Lacey, C. G., 2006, MNRAS, 370, 645
- Cui et al. (2011) Cui, Weiguang; Springel, Volker; Yang, Xiaohu; De Lucia, Gabriella; Borgani, Stefano, 2011, MNRAS, 416, 2997
- Cypriano et al. (2006) Cypriano, E. S. and Mendes de Oliveira, C. L. and Sodré, Jr., L., 2006, AJ, 132, 514
- Davis (1985) Davis M., Efstathiou G., Frenk C. S., White S. D. M., 1985, ApJ, 292, 371
- Dariush et al. (2007) Dariush, A., Khosroshahi, H.G., Ponman, T.J., Pearce, F., Raychaudhury, S., Hartley, W., 2007, MNRAS, 382, 433
- Dariush et al. (2010) Dariush A. A., Raychaudhury S., Ponman T. J., Khosroshahi H. G., Benson A. J., Bower R. G., Pearce F., 2010, MNRAS, 405, 1873
- Deason et al. (2013) Deason, A. J. and Conroy, C. and Wetzel, A. R. and Tinker, J. L., 2013, ApJ, 777, 154
- De Lucia & Blaizot (2007) De Lucia, G. and Blaizot, J., 2007, MNRAS, 375, 2
- Díaz-Giménez et al. (2008) Díaz-Giménez, E., Muriel H., Mendes de Oliveira C., 2008, A&A , 490, 965
- Dietrich et al. (2012) Dietrich, J. P. and Böhnert, A. and Lombardi, M. and Hilbert, S. and Hartlap, J.,2012, MNRAS, 419, 3547
- D’Onghia et al. (2005) D’Onghia E., Sommer-Larsen J., Romeo A. D., Burkert A., Ped- ersen K., Portinari L., Rasmussen J., 2005, ApJ, 630, L109
- Dupke et al. (2010) Dupke, Renato de Alencar; Miller, Eric; de Oliveira, Claudia Mendes; Sodre, Laerte; Rykoff, Eli; de Oliveira, Raimundo Lopes; Proctor, Rob ,2010, Highlights of Astronomy, 15, 287
- Eigenthaler et al. (2013) Eigenthaler, P.; Zeilinger, W. W., 2013, A&A , 553A, 99
- Fabricant et al. (1984) Fabricant, D. and Rybicki, G. and Gorenstein, P., 1984, ApJ, 286, 186
- Fort & Mellier (1994) Fort, B. and Mellier, Y., 1994, A&A Rv, 5, 239
- Gao et al. (2008) Gao, L., Navarro, J. F., Cole, S., et al. 2008, MNRAS, 387, 536
- Girardi et al. (2014) Girardi, M. and Aguerri, J. A. L. and De Grandi, S. and D’Onghia, E. and Barrena, R. and Boschin, W. and Mendez-Abreu, J. et al., 2014 ,arXiv, 1403.0590
- Guo et al. (2011) Guo Q., White S., Boylan-Kolchin M., De Lucia G., KauffmannG., Lemson G., Li C., Springel V., Weinmann S., 2011, MNRAS, 413, 101
- Harrison et al. (2012) Harrison, C. D. and Miller, C. J. and Richards, J. W. and Lloyd-Davies, E. J. and Hoyle, B. and Romer, A. K. et al.,2012, ApJ, 752, 12
- Herbst et al. (2012) Herbst, Hanna; Wilcots, E.; Hess, K.; Gerhartz, C.; Kaczmarek, J., 2012, American Astronomical Society Meeting, 22043502
- Hess et al. (2012) Hess, Kelley M.; Wilcots, Eric M.; Hartwick, Victoria L., 2012, AJ, 144, 48
- Hoekstra et al. (2001) Hoekstra, H. and Franx, M. and Kuijken, K. and Carlberg, R. G. et al., 2001, ApJ, 548, L5
- Humphrey et al. (2006) Humphrey, P. J. and Buote, D. A. and Gastaldello, F. and Zappacosta, L. and Bullock, J. S. and Brighenti, F. and Mathews, W. G.,2006, ApJ, 646, 899
- Johnston et al. (2007) Johnston, D. E. and Sheldon, E. S. and Tasitsiomi, A. and Frieman, J. A. and Wechsler, R. H. and McKay, T. A., 2007, ApJ, 656, 27
- Jones et al. (2003) Jones, L. R.; Ponman, T. J.; Horton, A.; Babul, A.; Ebeling, H.; Burke, D. J., 2003, MNRAS, 343, 627
- Kaiser et al. (1993) Kaiser, N. and Squires, G., 1993, ApJ, 404, 441
- Khosroshahi, Jones, & Ponman (2004a) Khosroshahi H. G., Jones L. R., Ponman T. J., 2004, MNRAS, 349, 1240
- Khosroshahi, & Ponman (2006) Khosroshahi H. G., Ponman T. J., Jones L. R., 2006, MNRAS,372, L68
- Khosroshahi et al. (2006a) Khosroshahi, H. G. and Maughan, B. J. and Ponman, T. J. and Jones, L. R., 2006, MNRAS, 369, 1211
- Khosroshahi, Ponman and Jones (2007) Khosroshahi, H.G., Ponman, T.J., Jones, L.R., 2007, MNRAS, 377, 595
- Leauthaud et al. (2007) Leauthaud, A. and Massey, R. and Kneib, J.-P. and Rhodes, J. et al., 2007, ApJS, 172, 219
- Leauthaud et al. (2010) Leauthaud, A. and Finoguenov, A. and Kneib, J.-P. and Taylor, J. E. and Massey, R. and Rhodes, J. and Ilbert, O. et al.,2010, ApJ, 709, 97
- Lemson et al. (2006) Lemson, G. and Springel, V., 2006, ASP Conf. Ser. ,351,212
- Lieder et al. (2013) Lieder, S.; Mieske, S.; Sa’nchez-Janssen, R.; Hilker, M.; Lisker, T.; Tanaka, M., 2013, A&A , 559A, 76
- Ludlow et al. (2012) Ludlow, Aaron D.; Navarro, Julio F.; Li, Ming; Angulo, Raul E.; Boylan-Kolchin, Michael; Bett, Philip E., 2012, MNRAS, 427, 1322
- Madrid et al. (2013) Madrid, Juan P.; Donzelli, Carlos J., 2013, ApJ, 770, 158
- Mandelbaum et al. (2005) Mandelbaum, R. and Hirata, C. M. and Seljak, U. and Guzik, J. and Padmanabhan, N. and Blake, C. and Blanton, M. R. and Lupton, R. and Brinkmann, J., 2005, MNRAS, 361, 1287
- Mandelbaum et al. (2006b) Mandelbaum, R. and Seljak, U. and Cool, R. J. and Blanton, M. and Hirata, C. M. and Brinkmann, J., 2006, MNRAS, 372, 758
- Mandelbaum et al. (2006a) Mandelbaum, R. and Hirata, C. M. and Broderick, T. and Seljak, U. and Brinkmann, J., 2006, MNRAS,v 370, 1008
- Miller et al. (2012) Miller, Eric D.; Rykoff, Eli S.; Dupke, Renato A.; Mendes de Oliveira, Claudia , et al., 2012, ApJ, 747, 94
- Milosavljevic et al. (2006) Milosavljevic, M., Miller, C.J., Furlanetto, S.R. & Cooray, A., 2006, ApJ, 637, L9
- Miraghaee et al. (2013) H.Miraghaee,H.;Khosroshahi, H.G.; et al., 2013, submitted to MNRAS
- Miralda-Escude (1991) Miralda-Escude, J., 1991, ApJ, 370, 1
- Navarro, Frenk, & White (1996) Navarro J. F., Frenk C. S., White S. D. M., 1996, ApJ, 462, 563
- Oguri et al. (2010) Oguri, M. and Takada, M. and Okabe, N. and Smith, G. P.,2010, MNRAS, 405, 2215
- Prada et al. (2012) Prada, F., Klypin, A. A., Cuesta, A. J., Betancort-Rijo, J. E., Primack, J., 2012, MNRAS, 423, 3018
- Pratt & Arnaud (2005) Pratt G. W., Arnaud M., 2005, A&A, 429, 791
- Ponman et al. (1994) Ponman, T.J., Allan, D.J., Jones, L.R., Merrifield, M. & MacHardy, I.M., 1994 Nature, 369, 462
- Rasmussen et al. (2012) Rasmussen, Jesper; Mulchaey, John S.; Bai, Lei; Ponman, Trevor J.; Raychaudhury, Somak; Dariush, Ali , 2012, ApJ, 757, 122
- Sales et al. (2007) Sales, L.V., Navarro, J.F., Lambas, D.G., White, S.D.M. & Croton,D.J., 2007, MNRAS, 382, 1901
- Sanderson et al. (2009) Sanderson, A. J. R. and Edge, A. C. and Smith, G. P., 2009, MNRAS, 398, 1698
- Shan et al. (2010b) Shan, H. and Qin, B. and Fort, B. and Tao, C. and Wu, X.-P. and Zhao, H., 2010, MNRAS, 406, 1134
- Shan et al. (2010a) Shan, H. Y. and Qin, B. and Zhao, H. S., 2010, MNRAS, 408, 1277
- Skibba et al. (2011) Skibba, R. A., van den Bosch, F. C., Yang, X., More, S., Mo, H., & Fontanot, F. , 2011, MNRAS, 410, 417
- Smith et al. (2005) Smith, Graham P.; Kneib, Jean-Paul; Smail, Ian; Mazzotta, Pasquale; Ebeling, Harald; Czoske, Oliver, 2005, MNRAS, 359, 417
- Smith et al. (2010) Smith, Graham P.; Khosroshahi, Habib G.; Dariush, A.; Sanderson, A. J. R.; Ponman, T. J.; Stott, J. P.; Haines, C. P.; Egami, E.; Stark, D. P., 2010, MNRAS, 409, 169
- Springel et al. (2001) Springel, V., White, S.D.M., Tormen, G. & Kauffmann, G., 2001, MNRAS, 328, 726
- Springel et al. (2005) Springel, V. and White, S. D. M. and Jenkins, A. and Frenk, C. S. and Yoshida, N. and Gao, L. and Navarro, J. and Thacker, R., et al. 2005, Nature, 435, 629
- Sun et al. (2004) Sun, M.; Forman, W.; Vikhlinin, A.; Hornstrup, A.; Jones, C.; Murray, S. S., 2004, ApJ, 612 , 805
- Tavasoli et al. (2012) Tavasoli, Saeed; Khosroshahi, Habib G.; Koohpaee, Ali; Rahmani, Hadi; Ghanbari, Jamshid, 2011, PASP, 123, 1
- Ulmer et al. (2005) Ulmer, M. P.; Adami, C.; Covone, G.; Durret, F.; Lima Neto, G. B.; Sabirli, K.; Holden, B.; Kron, R. G.; Romer, A. K., 2005, ApJ, 624, 124
- Van den Bosch et al. (2007) van den Bosch, Frank C.; Yang, Xiaohu; Mo, H. J.; Weinmann, Simone M.; Macciò, Andrea V.; More, Surhud; Cacciato, Marcello; Skibba, Ramin; Kang, Xi, 2007, MNRAS, 376, 841
- Voevodkin et al. (2010) Voevodkin, A. and Borozdin, K. and Heitmann, K. and Habib, S. and Vikhlinin, A. and Mescheryakov, A. and Hornstrup, A. and Burenin, R., 2010, ApJ, 708, 1376
- Von Benda-Beckmann et al. (2008) Von Benda-Beckmann A.M., D’Onghia E., et al. , 2008, MNRAS, 386, 2345
- Wechsler et al. (2002) Wechsler, R. H. and Bullock, J. S. and Primack, J. R. and Kravtsov, A. V. and Dekel, A., 2002, ApJ, 568, 52
- Wilson et al. (2001) Wilson, G. and Kaiser, N. and Luppino, G. A., 2001, ApJ, 556, 601
- Yoshioka et al. (2004) Yoshioka T., Furuzawa A., Takahashi S., Tawara Y., Sato S., Yamashita K., Kumai Y., 2004, Advances in Space Research, 34, 2525