An Ultra Low Mass and Small Radius Compact Object in 4U 1746-37 (catalog )?
Abstract
Photospheric radius expansion (PRE) bursts have already been used to constrain the masses and radii of neutron stars. RXTE observed three PRE bursts in 4U 1746-37 (catalog ), all with low touchdown fluxes. We discuss here the possibility of low mass neutron star in 4U 1746-37 (catalog ) because the Eddington luminosity depends on stellar mass. With typical values of hydrogen mass fraction and color correction factor, a Monte-Carlo simulation was applied to constrain the mass and radius of neutron star in 4U 1746-37 (catalog ). 4U 1746-37 (catalog ) has a high inclination angle. Two geometric effects, the reflection of the far side accretion disc and the obscuration of the near side accretion disc have also been included in the mass and radius constraints of 4U 1746-37 (catalog ). If the reflection of the far side accretion disc is accounted, a low mass compact object (mass of and radius of at 68% confidence) exists in 4U 1746-37 (catalog ). If another effect operated, 4U 1746-37 (catalog ) may contain an ultra low mass and small radius object ( at 68% confidence). Combined all possibilities, the mass of 4U 1746-37 (catalog ) is at 99.7% confidence. For such low mass NS, it could be reproduced by a self-bound compact star, i.e., quark star or quark-cluster star.
Subject headings:
binaries: general — stars : individual (4U 1746-37 (catalog )) — stars: neutron - X-rays: binaries — X-rays: individual (4U 1746-37 (catalog )) — X-rays: stars1. Introduction
The equation of state (EoS) of superdense matter is one of the key questions in astrophysics and nuclear physics. Neutron stars (NSs, hereafter, NS refers to all kinds of pulsar-like compact objects.) in the Universe provide us an unique opportunity to approach it. Generally, two categories of EoS were widely discussed, which can produce gravity-bound NS and self-bound NS (Glendenning, 1996; Haensel et al., 2007), respectively. All of them proposed distinct mass-radius relations. The EoSs of self-bound NS predicted ( and are the mass and radius of NS) for low mass NS. Moreover, the minimum mass of self-bound NS can reach as low as planet-mass (Xu & Wu, 2003; Horvath, 2012), while the low limit mass of gravity-bound NS is about (e.g., Akmal & Pandharipande (1997); Glendenning & Schaffner-Bielich (1999)). The measurements of the radius and mass of NS, as well as searching extremely low mass NS can provide useful information to test various theoretical EoSs.
The mass of NS can be precisely determined in double NS system or white dwarf–neutron star system (see Lattimer (2012) for all NSs with measured masses). Especially, Janssen et al. (2008) found a very low mass NS ( at 95.4% confidence) in PSR J1518+4904 (catalog ), which might be the least massive compact object in double NS system. The direct measurement of the radius of NS, however, is still difficult. The measurement of NS radius is very critical for EoS constraining. Fortin et al. (2014) claimed that the NSs with mass in the range should be larger than 12 km, otherwise, the presence of hyperons in neutron star cores are ruled out. And then, the so-called hyperon puzzle is arising (e.g., Bednarek et al. 2012). Several methods were proposed to constrain the radius and mass of NS, such as fitting the thermal spectra from quiescent low-mass X-ray binaries (LMXBs) in globular clusters (Guillot et al., 2013), simulating X-ray pulsar profiles (Leahy, 2004), and photospheric radius expansions (PRE) bursts (see Bhattacharyya (2010) for a review).
Type I X-ray bursts in LMXBs are sudden energy release process, which last ten to hundred seconds and can emit as high as Eddington Luminosity (). In classical view, type I X-ray bursts are powered by the unstable thermonuclear burning of H/He accreted on the neutron star surface through its companion star Roche-lobe overflowing. Most of the spectra of type I X-ray bursts can be well fitted by a pure black body spectrum. PRE burst, a special case of type I X-ray burst, were phenomenally distinguished from the time resolved spectra. At the touchdown moment, where the black body temperature and its normalization reach their local maximum and minimum during X-ray burst respectively, the referred bolometric luminosity corresponds to its Eddington luminosity, that is, the radiation pressure is balanced by the gravity. After the touchdown point, the residual thermal energy cool on the whole surface of neutron star during burst tail. So, the mass and radius of neutron star could be constrained if the distance to the source was measured independently, i.e., in globular clusters (Sztajno et al., 1987; Özel et al., 2009).
In the assumption of spherically symmetric emission, the Eddington luminosity is expressed as (Lewin et al., 1993),
| (1) |
where, , , are the Gravitational constant, the speed of light and the Thompson scattering cross-section, respectively; is the mass of the proton, is the atmosphere’s hydrogen mass fraction ( for pure hydrogen), is the effective temperature of NS atmosphere, describes the temperature dependence of the electron scattering opacity. The factor , is the gravitational redshift correction for strong gravity field on the surface of NS. Kuulkers et al. (2003) analyzed all PRE bursts in globular clusters with known distance, and discussed the potential advantage of PRE bursts as “standard candle”. Galloway et al. (2008a) argued that the luminosity of PRE bursts were intrinsically affected by the mass and radius of NS, the variation of photosphere composition. Especially, two low luminosity sources during PRE bursts, 4U 1746-37 (catalog ) and GRS 1747-312 (catalog ), emitted too faint to reach Eddington luminosity in the assumption of . However, the possibility of the observed low flux due to the existence of low mass NS, i.e., (Sztajno et al., 1987), cannot be ruled out.
We interpret that a low mass NS inside 4U 1746-37 (catalog ) and GRS 1747-312 (catalog ) can explain their low touchdown fluxes in PRE bursts. However, a peculiar X-burst from GRS 1747-312 (catalog ) exhibited significant variation of apparent radius in the cooling tail (in’t Zand et al., 2003). The color correction factor as well as emission area may simultaneously change similar as the case in 4U 1820-30 (catalog ) (García et al., 2013). In this work, we only discuss the possibility of a low mass NS in 4U 1746-37 (catalog ).
Compared with very early works by Sztajno et al. (1987), we consider the touchdown fluxes, instead of peak fluxes, observed by RXTE in 4U 1820-30 (catalog ) as its Eddington flux. Moreover, the reflection or obscuration by accretion disc are accounted separately (Galloway et al., 2008b). The accretion rate enhancement during X-ray bursts are checked (Worpel et al., 2013; in’t Zand et al., 2013). The effects of extremely extended photosphere at touchdown moment are also investigated (Steiner et al., 2010).
In Section 2, the RXTE observations of 4U 1746-37 (catalog ) will be briefly presented. In Section 3, we introduce the mass-radius constraints of 4U 1746-37 (catalog ). We give the results and discussions in Section 4 and 5.
2. RXTE Observations
During its 15 years operation, RXTE observed over 1000 X-ray bursts, which were detailedly analyzed in Galloway et al. (2008a). The high quality data provided an opportunity to research the time resolved spectra of X-ray bursts. The PRE bursts, a special type of X-ray bursts, emitted Eddington luminosity and cooled on the whole surface of NS with small uncertainties (Güver et al., 2012b, a), which were utilized to determine the and of NS (Özel et al., 2009; Güver et al., 2010a, b; Özel et al., 2012). The dominant uncertainties of and originated from the error of the distance to source (Sala et al., 2012).
The touchdown fluxes and black body normalizations () were obtained in the time resolved spectra of PRE bursts. When extracting the time resolved spectra, several assumptions were made first (Worpel et al., 2013). The spectra of persistent emission during bursts were stable and invariant. The net contribution of a burst was archived by subtracting its pre-burst intensity, which arose from accretion. in’t Zand et al. (2013) observed a type I X-ray burst in SAX J1808.4-3658 (catalog ) with RXTE and Chandra simultaneously, and found obvious excess of low and high energy photons when fitted the burst spectrum with black body. Worpel et al. (2013) explained that the excesses at low and high energies in SAX J1808.4-3658 (catalog ) and other PRE bursts were due to accretion enhancement during the burst, analogous to Poynting-Robertson drag effect. in’t Zand et al. (2013) introduced “” model to account for the contribution of persistent emission. Worpel et al. (2013) found most of the spectra the factor were significantly larger than unity, especially for SAX J1808.4-3658 (catalog ) (). We check this kind of accretion rate enhancement during type I X-ray burst in 4U 1746-37 (catalog ).
2.1. Data Reduction
4U 1746-37 (catalog ) is a low mass X-ray binary (LMXB) located in the Globular Cluster NGC 6441 (catalog ). The distance to NGC 6441 (catalog ) is (Kuulkers et al., 2003). From the type I X-ray burst catalog of RXTE (Galloway et al., 2008a), three PRE bursts were identified in 4U 1746-37 (catalog ) (observation ID: 30701-11-03-000, 30701-11-04-00, 60044-02-01-03, hereafter, we cited as Burst I, II, III, respectively). In order to check the accretion rate enhancement consequence during type I X-ray burst (Worpel et al., 2013), we re-analyzed these three PRE bursts of 4U 1746-37 (catalog ), which were collected by the Proportional Counter Array (PCA) on board of RXTE. The time resolved spectra were extracted from appropriate model files (science event or Good Xenon), which covered the whole burst interval in the energy 2-60 keV. The dead time corrections were made following the process suggested by the RXTE team111http://heasarc.nasa.gov/docs/xte/recipes/pca_deadtime. html. We fitted the spectra in the range 3-22 keV, and added 0.5% systematic error. We fixed the hydrogen column density at obtained from BeppoSAX (Sidoli et al., 2001), which has higher sensitivity at low X-ray energy than PCA/RXTE. The deadtime correction factor ranges of each observation are listed in Table 1.
2.2. Persistent Emission
For each PRE burst in 4U 1746-37 (catalog ), a 16 s interval prior to the trigger moment was regarded as persistent emission, which contains emission from the source as well as background from the instrument. We utilized the “bright” source model ( 40 counts/s/PCU) to estimate the instrumental background with runpcabackest procedure. The persistent emission can be well fitted by absorbed black body plus power law (wabs(bbodyrad+powerlaw) in Xspec). Fig. 1 shows the fit to the persistent spectrum and the residuals of Burst I. The reduced is 1.01 for 22 degree of freedom. For the other two PRE bursts, the reduced are 0.98 (Burst II) and 0.82 (Burst III), indicating well fitting to the data.

2.3. Fitting the Burst Spectra
The net burst spectrum can be represented by a pure black body with the interstellar absorption. Worpel et al. (2013) introduced a -model to account for the variation of persistent emission amplitude, which presents as
| (2) |
here, is the absorption correction, is the black body spectrum with temperature and normalization , is the persistent emission and is the instrumental background. The parameter accounts for the contribution from the persistent emission, i.e., means that the amplitude of persistent emission is exactly the same as the moment before X-ray burst trigger. Note that the model is applied, with assuming that only the amplitude of persistent emission can change. The distribution of type I X-ray burst from Galloway et al. (2008a) catalog is peaked at 1, and biased towards higher values (Worpel et al., 2013). It implied that the accretion rate increases during X-ray burst analogous to the Poynting-Robertson effect.
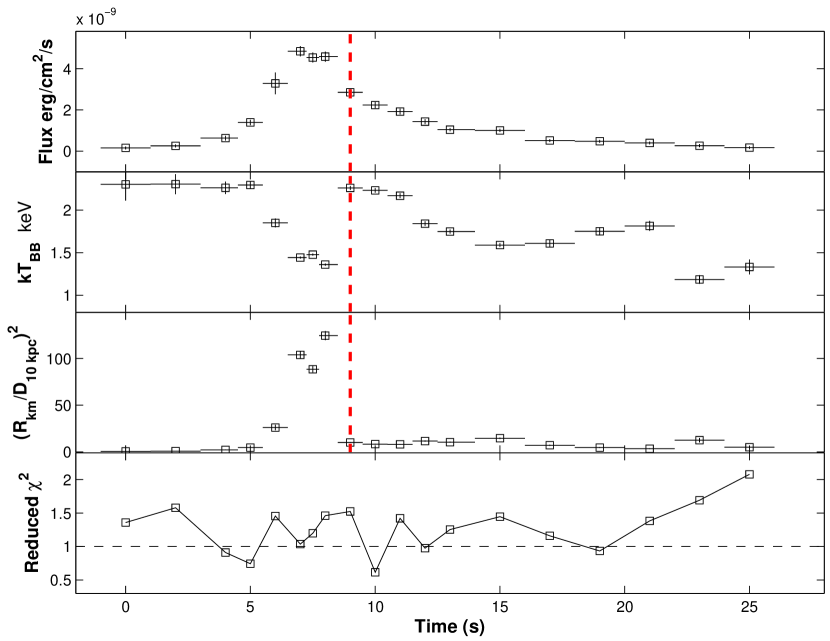
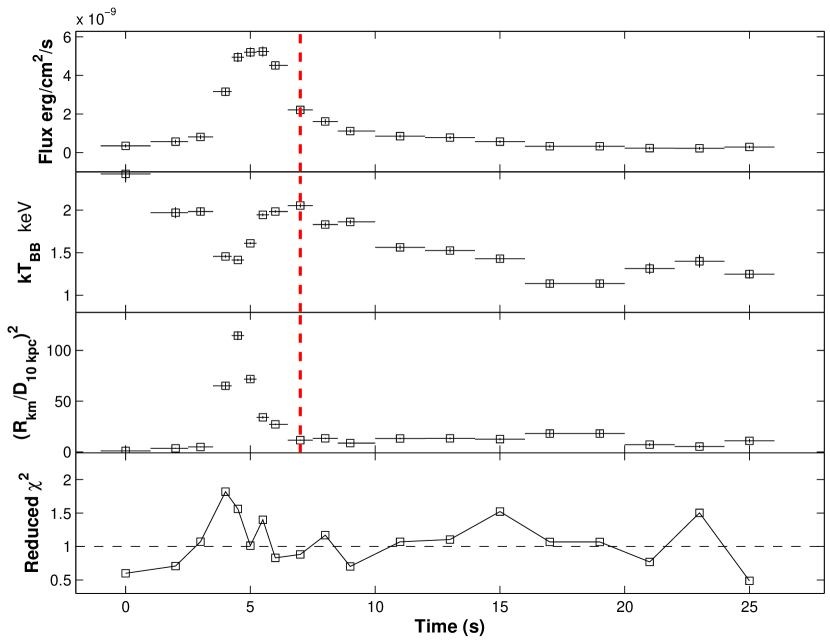
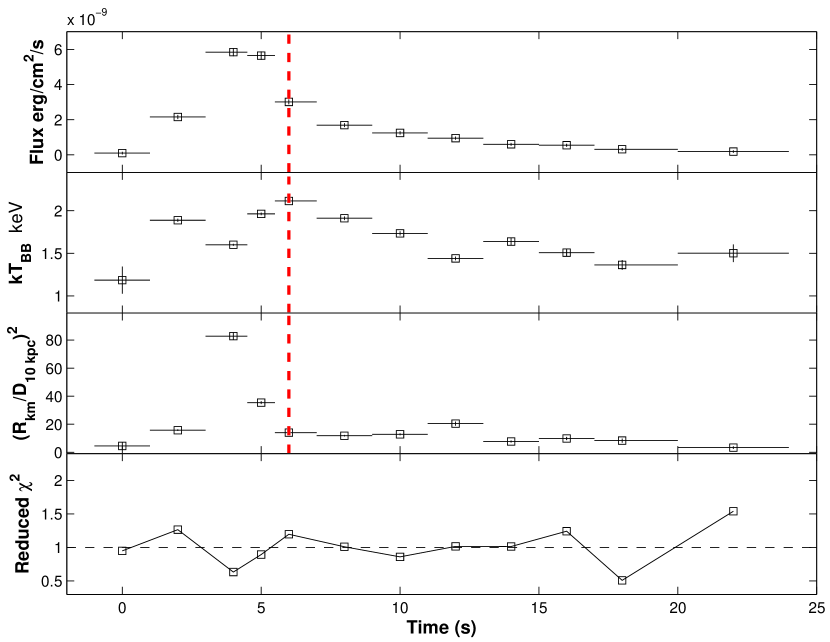
We also attempted to find whether the persistent emission varied or not in 4U 1746-37 (catalog ). When the model was used, we applied the -test to check the requirement of adding this extra parameter. We found that the model cannot produce distinctly better reduced . It implies that even if the accretion rate increased during type I X-ray burst in 4U 1746-37 (catalog ), its contribution to the burst spectrum can be neglected. We generated the time resolved spectra of three PRE bursts in Fig. 2, Fig. 3 and Fig. 4. The bolometric flux, the black body temperature, the black body normalization and the reduced are showed. The bolometric flux was calculated from equation (3) in Galloway et al. (2008a). The error of bolometric flux was estimated from the uncertainty propagation. All quoted errors are at 68% confidence level.
In Fig.2, the reduced on the cooling tail are relative large compared with the expansion phase and contraction phase, so does the model. The touchdown fluxes are , and . The corresponding peak fluxes are , and . Meanwhile, the factor is . If the cooling tails were truncated at , we obtained the apparent area during the cooling tail , which is smaller than provided by (Güver et al., 2012b), but with a larger error. Since, we only used three PRE bursts, and did not group the apparent areas as a function of flux.
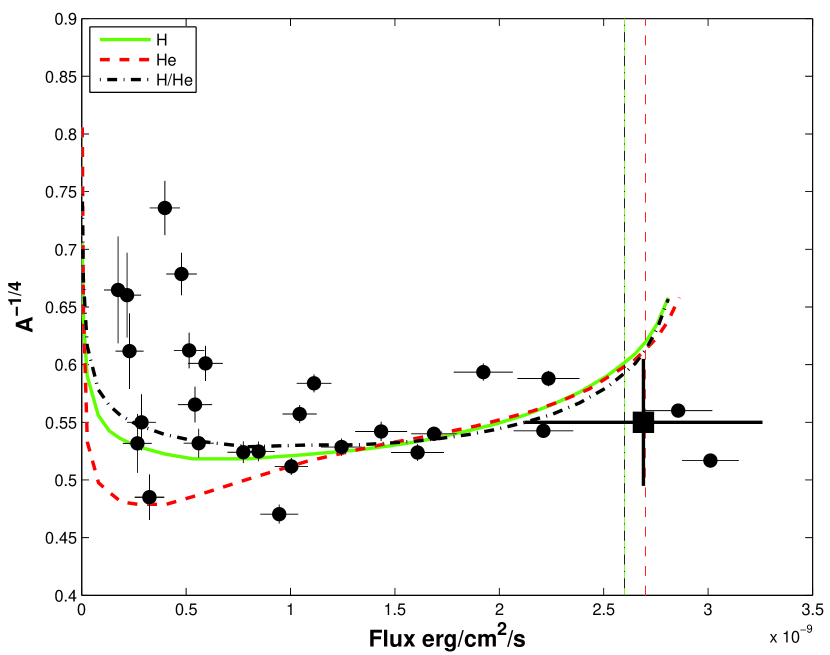
Suleimanov et al. (2011) proposed that the color correction factor are apparently changed when the luminosity close to its Eddington limit. In Fig. 5, the correlation is shown and fitted by three theoretical models (Suleimanov et al., 2012). The data are well fitted at high flux ( and for pure H, and for pure He, and for mixture of H/He). At low flux, the data deviate from the prediction of models, which also appears in GS 1826-24 (catalog ) (Zamfir et al., 2012). Güver et al. (2012b) calculated for different X-ray burst atmosphere models and concluded that is weakly dependent on the temperature if the black body temperature is less than 2.5 keV. From the time resolved spectra of 4U 1746-37 (catalog ), the black body temperature are all in keV. Hence, the color correction factor is chosen as to account for the different theoretical model predictions.
The standard deviations of and contain three parts, the observed errors (), the systematic errors () and the absolute calibration errors (), which are
| (3) |
and
| (4) |
if these errors are independent with each other. Here, the 10% absolute calibration errors are applied (Tsujimoto et al., 2011). Since the systematic errors were for apparent radii (Güver et al., 2012b) and for touchdown fluxes (Güver et al., 2012a). We adopted 8% and 10% systematic errors for apparent radius and touchdown flux, respectively. So, the mean touchdown flux and apparent area are and for these PRE bursts. We note that two PRE bursts were observed by EXOSAT with peak fluxes and touchdown fluxes about (Sztajno et al., 1987). The touchdown flux observations of RXTE and EXOSAT for 4U 1746-37 (catalog ) were consistent with each other. It should be mentioned that Sztajno et al. (1987) treated the peak flux as the Eddington flux. Here, we adopted the touchdown flux as its Eddington flux as suggestion in Özel et al. (2009).
4U 1746-37 (catalog ) has a high system inclination angle (). In such systems, the touchdown fluxes were systematically smaller than the peak fluxes. Galloway et al. (2008b) found that the ratios between the peak flux () and the touchdown flux () are larger than in dipping binaries. They discussed two geometric interpretations of this ratio, the reflection of the far side accretion disc and the obscuration of the near side accretion disc. For the first scenario, the different between and is due to the extra contribution from the far side disc reflection at the peak flux moment. So, the touchdown flux exactly corresponds to its Eddington flux. For the second scenario, it is the anisotropies of persistent and burst emission, which have been discussed for a long time (Lapidus & Sunyaev, 1985; Fujimoto, 1988; Zamfir et al., 2012). If the geometrically thin accretion disc extends close to the neutron star surface, it will intercept of the burst radiation, and re-radiate along the disc axis (Lapidus & Sunyaev, 1985). Fujimoto (1988) introduced an anisotropy parameter , and expressed the actual luminosity of burst emission as , where is the observed burst flux. Lapidus & Sunyaev (1985) suggested the approximate approach for ,
| (5) |
In an edge on binary system, the anisotropy parameter is 2. Moreover, it can be estimated as . Since, the obscured fraction of burst emission at the peak flux moment is much smaller than the one at the touchdown moment (Galloway et al., 2008b). Hence, at this circumstance, the touchdown flux as well as emission area in the cooling tail should be corrected to larger values with the factor . Here, is for 4U 1746-37, which is consistent with the above mentioned prediction. We considered these two geometric effects separately.
3. The constraining of and
In PRE bursts, the mass and radius of NS are constrained from the relations (Özel et al., 2009),
| (6) |
and
| (7) |
where, is opacity to electron scattering, is color correction factor. In order to constrain the mass and radius of NS properly, the uncertainties of photosphere composition (), distance, and color correction factor should be taken into account together. Özel et al. (2009) proposed a Bayesian framework to estimate the mass and radius of NS. They set each quantity with independent probability distribution functions, and then, the joint probability density of mass and radius is expressed as,
| (8) |
here, the Jacobian of the transformation from the pair to is supposed to be
| (9) |
Özel et al. (2012) made a correction for this expression compared to Equation (9) in Özel et al. (2009), but a factor of 2 is still missing. Although, the mass-radius confident regions are not effected by the constant factor in Equation (8) when the joint probability density is normalized. Integrated Equation (8) over distance, the joint probability distribution of and is obtained.
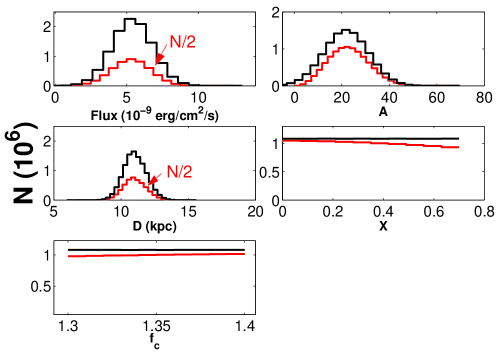
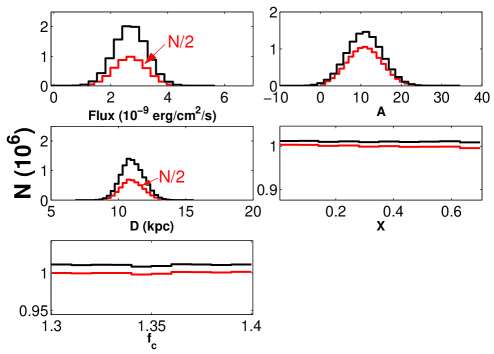
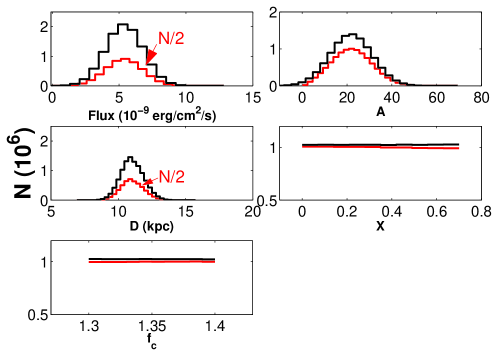
In this work, a Monte Carlo method is applied to constrain and of NS, which shows high efficiency (Li et al., 2012). We produce two series of simulated and , which satisfy and , respectively. Here, denotes that is normally distributed random values with expectation and standard deviation . has a similar definition. We also assign flat distributions for , , which are correspondingly represented as . Especially, the distance to the source has asymmetric errors. In order to simplify the simulation, we adopt , where denotes the indicator function of set , , and 222A flat distribution of is also attempted. The confidence contours are shifted negligibly. . The hydrogen mass fraction and the color correction factor are set as , and (Suleimanov et al., 2011; Güver et al., 2012b), respectively. For each pair of , the and of NS are solved from Equation (6) and (7), if the solutions exist. For a certain large samples (i.e., ), the confidence regions of and are obtained.
4. Results
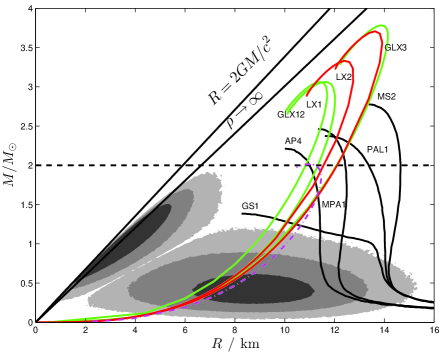
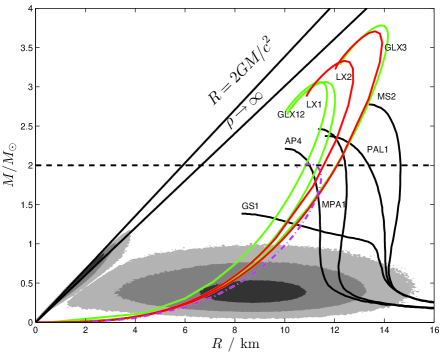
We applied a Monto-Carlo simulation to constrain the mass and radius of NS in 4U 1746-37 (catalog ). The typical distributions of color correction factor and hydrogen mass fraction were utilized. The results are shown in Fig. 6 and Fig. 7. The left panel in Fig. 6 displays the 1-, 2-, 3-sigma confidence regions of the mass and radius of 4U 1746-37 (catalog ), if the touchdown flux exactly corresponds to the Eddington flux. That is, the peak flux contained a significant fraction component from the reflection of the far side disc. If the accretion disc obscured a portion of emission area at the touchdown moment and in the cooling tail, and should be corrected with the factor , here, the factor was adopted. The confidence regions are displayed in the left panel of Fig. 7. Ten EoSs are also plotted. It should be mentioned that in each case two regions are preferred. In Fig. 6, the mass and radius of NS are and for the up-left part, or and for the bottom-right part. In Fig. 7, the mass and radius of NS are and for the up-left part, or and for the bottom-right part.
We also checked the prior and posterior distributions of all related parameters. From the Fig. 6 and Fig. 7, the posterior distributions are well consistent with prior ones.
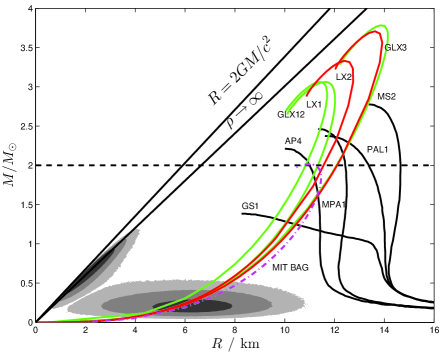

The left contours cannot be reproduced by any EoS, because the mean densities of NS are much larger than the nuclear matter saturation density, and they are close the Schwarzschild radius. The results show that 4U 1746-37 (catalog ) contains a very low mass NS in the range . If only the reflection of the far side disc effect existed, the touchdown flux equals to its Eddington flux. And then, we conclude a ultra low mass and small radius NS inside 4U 1746-37 (catalog ).
Steiner et al. (2010) proposed that the photosphere could be still extended at the touchdown moment. At the extreme case, the radius of photosphere radius is much larger than the radius of NS, and then, the Eddington flux in Equation (6) is reduced to
| (10) |
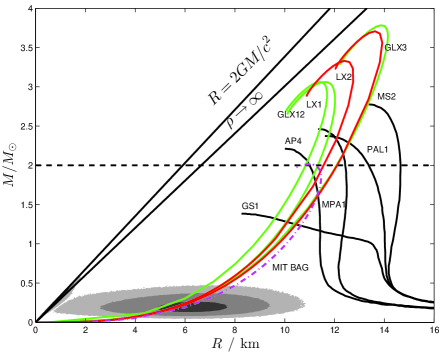
the expression of apparent area in Equation (7) remains unchanged. The simulation results are shown in Fig. 8 and Fig. 9. Each mass of NS corresponds to two different radius solutions. Compared with Fig. 6 and Fig. 7, the left contours are shrunk in Fig. 8 and Fig. 9 and the right contours are shifted negligibly.
5. Discussion and Conclusions
Plenty of theoretical NS EoSs were proposed. Hadron star and hybrid/mixed star are gravity-bound, which are covered by crusts with nuclei and electrons, whereas quark star and quark-cluster star are strongly self-bound on surface. In order to reduce them, searching for very high mass NS is an essential method, since the maximum mass of NS determine the stiffness of EoS. Very recently, the discoveries of two ruled out all soft EoSs (Demorest et al., 2010; Antoniadis et al., 2013), in which the predicted maximum masses of NS were lower than . On the other hand, searching for very low mass NS is also an attractive way. Because, the EoS of self-bound NS predicted distinct radii at low mass compared with ones by the EoS of gravity-bound NS. Moreover, gravity-bound NSs have minimum mass, while self-bound NSs do not. So, theoretical NS EoSs could be effectively tested from the accurate measurement of the radius for low mass NS.
EXOSAT and RXTE observed very low touchdown fluxes in PRE bursts from 4U 1746-37 (catalog ) (Sztajno et al., 1987; Galloway et al., 2008a). During the cooling tail in its PRE bursts, the emission area remained near constant (Güver et al., 2012b). Sztajno et al. (1987) assigned the peak fluxes as its Eddington flux. However, we assume that the Eddington luminosity was reached at the touchdown moment in 4U 1746-37’s (catalog ) PRE bursts similar as other sources. We also checked the persistent emission variations during X-ray bursts in 4U 1746-37 (catalog ). The -model do not provide better fitting results. After applying the Monto-Carlo simulation, we propose that a low mass NS ( or , depends on accretion disc geometric effects) may exist in 4U 1746-37 (catalog ). Combined aboved two possibilities, the mass of 4U 1746-37 (catalog ) is at 99.7% confidence. The peak fluxes in PRE bursts were not always consistent with touchdown fluxes. Two geometric effects, the reflection of the far side accretion disc and the obscuration of the near side accretion disc were possible attributed. In the case of accretion disc reflection, the derived mass and radius of NS in 4U 1746-37 (catalog ) could reproduced in the framework of self-bound NS EoSs, including quark-cluster stars and bare strange stars (Lai & Xu, 2009; Lai et al., 2013; Guo et al., 2014). In the case of accretion disc obscuration, the self-bound NSs and gravity-bound NSs (Akmal & Pandharipande, 1997; Müther et al., 1987) are acceptable in 1-sigma and 2-sigma confidence level of the mass and radius of NS in 4U 1746-37 (catalog ), respectively. Three gravity-bound NS EoSs (Prakash et al., 1988; Müller & Serot, 1996; Glendenning & Schaffner-Bielich, 1999) can be survival in 3-sigma confidence level.
Steiner et al. (2010) discussed the possibility that the photosphere is still extended at the touchdown moment. In the extreme case, the Eddington flux is only dependent on the stellar mass. In Fig. 8, the contours of constrain the EoS same as Fig. 6. Again, self-bound NSs are acceptable in 1-sigma confidence level. Two gravity-bound EoSs (Akmal & Pandharipande, 1997; Müther et al., 1987) and other three gravity-bound EoSs are possible in 2-sigma and 3-sigma confidence level.
Several low mass NSs (near or below ) were also discovered in other binary systems, e.g., for Her X-1 (catalog ) (Rawls et al., 2011), for SMC X-1 (catalog ) (van der Meer et al., 2007; Rawls et al., 2011), (eccentric orbit) or (circular orbit) for 4U 1538-52 (catalog ) (Rawls et al., 2011), for PSR J1518+4904 (catalog ) (Janssen et al., 2008), however, without radii measurement. A low mass NS may be difficult to form from the collapse of a massive star. However, an extremely low mass of self-bound star (strange quark or quark-cluster star), even as low as planet-mass (Xu & Wu, 2003; Horvath, 2012), could exist through the accretion-induced collapse of a white dwarf (Xu, 2005; Du et al., 2009).
The equation of state of cold matter at supra-nuclear density, which is essentially related to the challenging non-perturbative behavior of quantum chromo-dynamics, is far beyond solved even nearly half a century after the discovery of pulsars. Based on different manifestations of pulsar-like compact stars (e.g., the featureless thermal X-ray spectrum and the free precession), it was conjectured by Xu (2003) that pulsars could be so-called solid quark star, a kind of condensed objects composed of quark-clusters. The state of such quark-cluster matter is very stiff, and the resultant maximum mass of quark-cluster star would be even larger than (Lai & Xu, 2009), that is consistent with the later discoveries of massive pulsars (Demorest et al., 2010; Antoniadis et al., 2013). Additionally, pulsar glitches (sudden spin-up) can also be well understood in the regime of the quark-cluster star model (Zhou et al., 2014).
In the conventional calculations of the crust of a strange star, one usually assumes that the bottom crust density could be as high as the drip density because the transmission probability through the Coulomb barrier is negligible for very heavy ions, e.g., A=118, Z=36 (Alcock et al., 1986). However, accreted matter is mostly composed by ions not so heavy, and the transmission probability through the Coulomb barrier could be as high as for , according to the same approximations presented by Alcock et al. (1986). Normal matter accreted can then easily penetrate the Coulomb barrier, and thus can hardly exist outside a strange quark star (a new-born strange star could be bare because of strong exploding, otherwise a supernova might not be successful). Nevertheless, in the case of quark-cluster star, additional so-called strangeness barrier exists on quark-cluster surface. Xu (2014) demonstrated that a quark-cluster star may be surrounded by a hot corona or an atmosphere, and even a crust for different accretion rates, which could be helpful to understand the O VIII Ly- emission line in 4U 1700+24 (Nucita et al., 2014). The mass of corona or atmosphere or crust is much less than the conventional value of strange star, hence, the scale is negligible compared with the radius of NS.
On the other hand, Jaikumar et al. (2006) suggested that the strange stars may have a neutralizing solid crust consisting of charged strangelets and electrons, if the surface tension is below the critical value of order a few (Alford et al., 2006). Alford & Eby (2008) pointed out that the thickness of strangelet-crystal crust is sensitive to the EoS as well as the surface tension and can be changed from zero to hundreds of meters for a compact star of radius 10 km and mass 1.5, or thicker for low mass NSs. But, the thickness of crust do not change the radius of NS significantly even in the extreme case of 4U 1746-37.
As demonstrated in this paper, the mass-radius curves of various quark-cluster stars and bare strange stars pass the case of 4U 1746-37 (catalog ), no matter which geometric effects operated (reflection or obscuration). Certainly, our conclusions are based on the assumption that the observed PRE bursts were reached its Eddington luminosity. In future observation, if a brighter PRE burst is observed in 4U 1746-37 (catalog ), then a larger mass NS is required. Moreover, we are expecting that the optical observations of next generation telescope TMT (Thirty Meter Telescope, http://www.tmt.org/) could provide rigorous mass constraints. With TMT, the optical light curves and spectroscopy could be capable to obtain the binary system information (such as inclination angle, the type of companion star, and mass function; Antoniadis et al. 2013). And then, the mass of the compact object will be measured precisely and independently, which can verify the reliability of an ultra-low mass NS in 4U 1746-37 (catalog ).
Acknowledgments
We appreciate the referees’ comments and suggestions, which improve our manuscript significantly. Z.S. Li thank Jean in ’t Zand, Hauke Worpel and Duncan Galloway for discussion about GRS 1747-312 (catalog ) observation. This work is supported by the 973 program No. 2012CB821801, the National Natural Science Foundation of China (11225314, 11173024), the Strategic Priority Research Program on Space Science of the Chinese Academy of Sciences (XDA04010300), XTP XDA04060604 and the Fundamental Research Funds of the Central Universities. This research has made use of data obtained from the High Energy Astrophysics Science Archive Research Center (HEASARC), provided by NASA’s Goddard Space Flight Center.
References
- Akmal & Pandharipande (1997) Akmal, A., & Pandharipande, V. R. 1997, Phys. Rev. C, 56, 2261
- Alcock et al. (1986) Alcock, C., Farhi, E., & Olinto, A. 1986, ApJ, 310, 261
- Alford & Eby (2008) Alford, M. G., & Eby, D. A. 2008, Phys. Rev. C, 78, 045802
- Alford et al. (2006) Alford, M. G., Rajagopal, K., Reddy, S., & Steiner, A. W. 2006, Phys. Rev. D, 73, 114016
- Antoniadis et al. (2013) Antoniadis, J., Freire, P. C. C., Wex, N., et al. 2013, Science, 340, 448
- Bednarek et al. (2012) Bednarek, I., Haensel, P., Zdunik, J. L., Bejger, M., & Mańka, R. 2012, A&A, 543, A157
- Bhattacharyya (2010) Bhattacharyya, S. 2010, Advances in Space Research, 45, 949
- Demorest et al. (2010) Demorest, P. B., Pennucci, T., Ransom, S. M., Roberts, M. S. E., & Hessels, J. W. T. 2010, Nature, 467, 1081
- Du et al. (2009) Du, Y. J., Xu, R. X., Qiao, G. J., & Han, J. L. 2009, MNRAS, 399, 1587
- Fortin et al. (2014) Fortin, M., Zdunik, J. L., Haensel, P., & Bejger, M. 2014, ArXiv e-prints, arXiv:1408.3052
- Fujimoto (1988) Fujimoto, M. Y. 1988, ApJ, 324, 995
- Galloway et al. (2008a) Galloway, D. K., Muno, M. P., Hartman, J. M., Psaltis, D., & Chakrabarty, D. 2008a, ApJS, 179, 360
- Galloway et al. (2008b) Galloway, D. K., Özel, F., & Psaltis, D. 2008b, MNRAS, 387, 268
- García et al. (2013) García, F., Zhang, G., & Méndez, M. 2013, MNRAS, 429, 3266
- Glendenning (1996) Glendenning, N. 1996, Compact Stars. Nuclear Physics, Particle Physics and General Relativity.
- Glendenning & Schaffner-Bielich (1999) Glendenning, N. K., & Schaffner-Bielich, J. 1999, Phys. Rev. C, 60, 025803
- Guillot et al. (2013) Guillot, S., Servillat, M., Webb, N. A., & Rutledge, R. E. 2013, ApJ, 772, 7
- Guo et al. (2014) Guo, Y.-J., Lai, X.-Y., & Xu, R.-X. 2014, Chinese Physics C, 38, 055101
- Güver et al. (2010a) Güver, T., Özel, F., Cabrera-Lavers, A., & Wroblewski, P. 2010a, ApJ, 712, 964
- Güver et al. (2012a) Güver, T., Özel, F., & Psaltis, D. 2012a, ApJ, 747, 77
- Güver et al. (2012b) Güver, T., Psaltis, D., & Özel, F. 2012b, ApJ, 747, 76
- Güver et al. (2010b) Güver, T., Wroblewski, P., Camarota, L., & Özel, F. 2010b, ApJ, 719, 1807
- Haensel et al. (2007) Haensel, P., Potekhin, A. Y., & Yakovlev, D. G., eds. 2007, Astrophysics and Space Science Library, Vol. 326, Neutron Stars 1 : Equation of State and Structure
- Horvath (2012) Horvath, J. E. 2012, Research in Astronomy and Astrophysics, 12, 813
- in’t Zand et al. (2003) in’t Zand, J. J. M., Strohmayer, T. E., Markwardt, C. B., & Swank, J. 2003, A&A, 409, 659
- in’t Zand et al. (2013) in’t Zand, J. J. M., Galloway, D. K., Marshall, H. L., et al. 2013, A&A, 553, A83
- Jaikumar et al. (2006) Jaikumar, P., Reddy, S., & Steiner, A. W. 2006, Physical Review Letters, 96, 041101
- Janssen et al. (2008) Janssen, G. H., Stappers, B. W., Kramer, M., et al. 2008, A&A, 490, 753
- Kuulkers et al. (2003) Kuulkers, E., den Hartog, P. R., in’t Zand, J. J. M., et al. 2003, A&A, 399, 663
- Lai et al. (2013) Lai, X. Y., Gao, C. Y., & Xu, R. X. 2013, MNRAS, 431, 3282
- Lai & Xu (2009) Lai, X. Y., & Xu, R. X. 2009, MNRAS, 398, L31
- Lapidus & Sunyaev (1985) Lapidus, I. I., & Sunyaev, R. A. 1985, MNRAS, 217, 291
- Lattimer (2012) Lattimer, J. M. 2012, Annual Review of Nuclear and Particle Science, 62, 485
- Lattimer & Prakash (2007) Lattimer, J. M., & Prakash, M. 2007, Phys. Rep., 442, 109
- Leahy (2004) Leahy, D. A. 2004, ApJ, 613, 517
- Lewin et al. (1993) Lewin, W. H. G., van Paradijs, J., & Taam, R. E. 1993, Space Sci. Rev., 62, 223
- Li et al. (2012) Li, Z., Chen, L., & Wang, D. 2012, PASP, 124, 297
- Müller & Serot (1996) Müller, H., & Serot, B. D. 1996, Nuclear Physics A, 606, 508
- Müther et al. (1987) Müther, H., Prakash, M., & Ainsworth, T. L. 1987, Physics Letters B, 199, 469
- Nucita et al. (2014) Nucita, A. A., Stefanelli, S., De Paolis, F., et al. 2014, A&A, 562, A55
- Özel et al. (2012) Özel, F., Gould, A., & Güver, T. 2012, ApJ, 748, 5
- Özel et al. (2009) Özel, F., Güver, T., & Psaltis, D. 2009, ApJ, 693, 1775
- Prakash et al. (1988) Prakash, M., Lattimer, J. M., & Ainsworth, T. L. 1988, Physical Review Letters, 61, 2518
- Rawls et al. (2011) Rawls, M. L., Orosz, J. A., McClintock, J. E., et al. 2011, ApJ, 730, 25
- Sala et al. (2012) Sala, G., Haberl, F., José, J., et al. 2012, ApJ, 752, 158
- Sidoli et al. (2001) Sidoli, L., Parmar, A. N., Oosterbroek, T., et al. 2001, A&A, 368, 451
- Steiner et al. (2010) Steiner, A. W., Lattimer, J. M., & Brown, E. F. 2010, ApJ, 722, 33
- Suleimanov et al. (2011) Suleimanov, V., Poutanen, J., & Werner, K. 2011, A&A, 527, A139
- Suleimanov et al. (2012) —. 2012, A&A, 545, A120
- Sztajno et al. (1987) Sztajno, M., Fujimoto, M. Y., van Paradijs, J., et al. 1987, MNRAS, 226, 39
- Tsujimoto et al. (2011) Tsujimoto, M., Guainazzi, M., Plucinsky, P. P., et al. 2011, A&A, 525, A25
- van der Meer et al. (2007) van der Meer, A., Kaper, L., van Kerkwijk, M. H., Heemskerk, M. H. M., & van den Heuvel, E. P. J. 2007, A&A, 473, 523
- Worpel et al. (2013) Worpel, H., Galloway, D. K., & Price, D. J. 2013, ApJ, 772, 94
- Xu (2003) Xu, R. X. 2003, ApJ, 596, L59
- Xu (2005) —. 2005, MNRAS, 356, 359
- Xu (2014) Xu, R.-X. 2014, Research in Astronomy and Astrophysics, 14, 617
- Xu & Wu (2003) Xu, R.-X., & Wu, F. 2003, Chinese Physics Letters, 20, 806
- Zamfir et al. (2012) Zamfir, M., Cumming, A., & Galloway, D. K. 2012, ApJ, 749, 69
- Zhou et al. (2014) Zhou, E. P., Lu, J. G., Tong, H., & Xu, R. X. 2014, MNRAS, 443, 2705
| Obs_ID | Touchdown flux | Peak flux | DCOR11Deadtime correction factor (DCOR) range. The exposure time of each burst spectrum is divided by DCOR. | PCU on22The active Proportional Counter Units (PCUs) during the burst epoch. | - |
|---|---|---|---|---|---|
| 30701-11-03-000 | 1.028-1.035 | all | , 33The 1-sigma confidence level of mass and radius NS in 4U 1746-37, corresponding to Fig. 6. | ||
| 30701-11-04-00 | 1.023-1.030 | all | , 44The 1-sigma confidence level of mass and radius NS in 4U 1746-37, corresponding to Fig. 7. | ||
| 60044-02-01-03 | 1.015-1.026 | 0,2,4 |