11email: murata@ir.isas.jaxa.jp 22institutetext: Department of Space and Astronautical Science, The Graduate University for Advanced Studies, Japan 33institutetext: National Optical Astronomy Observatory, Tucson, AZ 85719, USA 44institutetext: Institute of Astronomy and Department of Physics,National Tsing Hua Universit y, No. 101, Section 2, Kuang-Fu Road, Hsinchu 30013, Taiwan, R.O.C 55institutetext: Spitzer Science Center, Calfornia Institute of Technology, MS 220-6, Pasadena, CA 91125 66institutetext: RAL Space, STFC Rutherford Appleton Laboratory, Chilton, Didcot, Oxfordshire, OX11 0QX, UK 77institutetext: Department of Physical Sciences, The Open University, Milton Keynes, MK7 6AA, UK 88institutetext: Oxford Astrophysics, Oxford University, Keble Road, Oxford OX1 3RH, UK 99institutetext: Instituto de Astronomía, Universidad Nacional Autónoma de México, Ensenada, Baja California, Mexico
Polycyclic aromatic hydrocarbon feature deficit of starburst galaxies in the AKARI North Ecliptic Pole Deep Field
We study the behaviour of polycyclic aromatic hydrocarbon emission in galaxies at using 1868 samples from the revised catalogue of AKARI North Ecliptic Pole Deep survey. The continuous filter coverage at 2-24m makes it possible to measure 8m luminosity, which is dominated by polycyclic aromatic hydrocarbon emission for galaxies at up to . We compare the IR8 () and 8m to 4.5m luminosity ratio () with the starburstiness, , defined as excess of specific star-formation rate over that of main-sequence galaxy. All AGN candidates were excluded from our sample using an SED fitting. We found increases with starburstiness at log 0.5 and stays constant at higher starburstiness. On the other hand, IR8 is constant at log 0, while it increases with starburstiness at log 0. This behaviour is seen in all redshift range of our study. These results indicate that starburst galaxies have deficient polycyclic aromatic hydrocarbon emission compared with main-sequence galaxies. We also find that galaxies with extremely high ratio have only moderate starburstiness. These results suggest that starburst galaxies have compact star-forming regions with intense radiation, which destroys PAHs and/or have dusty HII regions resulting in a lack of ionising photons.
Key Words.:
– infrared: galaxies – galaxies: starburst – galaxy: evolution1 Introduction
Polycyclic aromatic hydrocarbon (PAH) emission has received much attention in recent years because of its properties, which provide us with key parameters in galaxy evolution. The PAHs are thought to be located in photo-dissociation regions (PDRs) and are regarded as star-formation rate tracers, since they are excited by UV light from young stars and emit their energy at 3.3, 6.2, 7.7, 8.6, and 11.3 m. Of these values, 7.7m emission is the strongest and dominates at 8m luminosity even in broad band filters. Therefore, these emissions correlate with the infrared luminosity, Caputi et al. (2007), which traces the dust-obscured starformation, since most of the energy is absorbed by dust and re-radiated at infrared. On the other hand, the PAHs also reflect the physical conditions of the inter stellar matter in galaxies. If UV photons are absorbed by dust in HII regions and cannot excite the PAHs in PDRs, or PAHs are destroyed by harsh radiation from a strong starburst or active galactic nuclei (AGNs), the PAH emission would be lower compared with the infrared luminosity Tielens (2008). Therefore, local ultra luminous infrared galaxies (ULIRGs; 10) that are very dusty and have compact star-forming regions and/or strong AGNs have a deficiency in PAH emission.
However, the PAHs show different behaviour in a high- universe. At 0.5 and 1, ULIRGs with a large rest-frame mm colour, which corresponds to large PAH equivalent width, were found, which must have an extended star-forming region Takagi et al. (2010). The ULIRGs at higher were also observed to have a higher at a given than their local counterpart Rigby et al. (2008); Huang et al. (2009). It leads an overestimation of infrared luminosity at when it is derived from only a 24m band photometry with local SED templates, since the 8m emission is redshifted into the 24m band, which has been called as “mid-infrared excess” problem Daddi et al. (2007).
Recently, this excess emission is explained with two modes of star formation, “normal” and “starburst” Elbaz et al. (2011). Galaxies with “normal” star-formation have a tight correlation between stellar mass and star formation rate, which is commonly referred to as the “star-forming main sequence” Noeske et al. (2007); Elbaz et al. (2007) with an intrinsic scatter Salmi et al. (2012); Guo et al. (2013). “Starburst” galaxies are defined with specific star-formation rate (sSFR) above the scatter, while “passive” are with sSFR under the scatter. The sSFR of the main sequence increases with redshift, while the IR8 () has a value of 41.6, which is independent of redshift Elbaz et al. (2011). The IR8 correlates with both a compactness in the star-forming region and a starburstiness that is defined by the excess of sSFR: sSFR/sSFRMS. Nordon et al. (2012) also showed that /(=1/IR8) decreases with an excess of sSFR at =1 and =2. They showed that intensive quantities, which are averaged over the entire galaxy, such as the sSFR and SED shape, are more fundamental parameters in determining the physical conditions in PDRs than extensive quantities that are integrated over the entire galaxy, such as infrared luminosity and stellar mass. However, owing to sparse filter sampling at 8-24m in the Spitzer Space Satellite Werner et al. (2004), they could not pay much attention to 1. Nonetheless, since the co-moving star-formation rate dramatically changed at this epoch Le Floc’h et al. (2005); Pérez-González et al. (2005), investigating the PAH behaviour of galaxies at the intermediate redshift is invaluable to explore galaxy evolution.
In contrast, the Japanese led AKARI satellite Murakami et al. (2007) has a continuous filter coverage at 2-24 m with nine photometric bands in the Infrared Camera Onaka et al. (2007). With these nine bands, a large and deep galaxy survey has been conducted towards the North Ecliptic Pole Matsuhara et al. (2006); Wada et al. (2008), which makes it possible to measure 8m luminosities at =0.3-0.7, 0.7-1.2, and 1.2-1.4 using the S11, L15, and L18W bands without associated uncertainties from the K-correction. This catalogue has been recently updated by Murata et al. (2013) and the detection limit is improved, as 60Jy at S11 band.
In this paper, we explore the PAH behaviour of galaxies at =0.3-1.4 using the revised AKARI NEP-Deep catalogue. In section 2, the data used in this study is described. In section 3, we show that the starburst galaxies have a relative weakness of PAH emission with respect to infrared luminosity regardless of redshift. In section 4, we discuss our results. In section 5, the conclusion is given. We adopt a cosmology with (, , ) = (0.3, 0.7, 70km s-1 Mpc-1). An initial mass function of Chabrier (2003) is assumed.
2 Data and sample
In this study, we used the AKARI North Ecliptic Pole Deep survey revised catalogue (Murata et al.2013) to measure the PAH emission strength at =0.3-1.4. It has an advantage of covering 2-24 m wavelengths continuously, which makes it possible to measure 8m feature at up to =2, where PAH emission at 7.7m and thermal emission from a very small grain heated by AGNs are dominant sources. A total of 1868 galaxies at =0.3-1.4 with photometry in all nine bands were selected from the catalogue. All photometry was performed with an aperture radius of 6.3 and 6.0 arcsec for NIR and MIR, with which flux calibration was conducted (Murata et al.2013). The NIR and MIR sources are matched through the matching with a ground-based catalogue (u* to Ks bands, see below). The 50% completeness limits of the survey are as deep as 56, 55, 38, 29, 34, 50, 86, 94, and 247Jy in the N2, N3, N4, S7, S9W, S11, L15, L18W, and L24 bands, respectively.
To estimate the physical properties of the AKARI sources, we used ground-based data taken with CFHT/MegaCam and WIRCam, which covers most of the AKARI NEP-Deep field with eight bands Oi et al. (2014). The stacked image was used as a detection image when sources were extracted using SExtractor Bertin & Arnouts (1996) with the dual mode for all eight bands. The colours were measured with a 2.0 arcsec aperture radius with the same area for all eight bands, while the total magnitudes were scaled with the mag measured with the . The detection limit of this catalogue is 22.5 mag. The CFHT sources were cross-matched with the AKARI NIR and MIR catalogue with 1.5 and 2.5 arcsec search radii, respectively, which are slightly small compared with the positional accuracy to avoid a chance coincidence of the matching with different objects. Some objects were unmatched with the CFHT catalogue due mainly to the field coverage and the detection limits.
We used spectroscopic redshifts when available; otherwise, we used photometric redshifts. Among 1868 objects, 225 have a spectroscopic redshift, which were obtained by MMT/Hectospec, WIYN/Hydra Shim et al. (2013), Keck/DEIMOS, and Subaru/FMOS (Appendix A) with at least two emission or absorption line features. We note that a fraction of high-z redshifts were obtained with [OII] line measured with the DEIMOS, while the others were determined with H line by the FMOS. Photometric redshifts were estimated using a publicly available code Ilbert et al. (2006), with which 62 galaxy templates from Arnouts et al. (2007) were fitted to to N4 bands. The systematic magnitude offsets for each band were calculated using the best fit templates of objects with spectroscopic redshift using the option. The photometric redshifts were compared with the spectroscopic redshift in Fig.1.
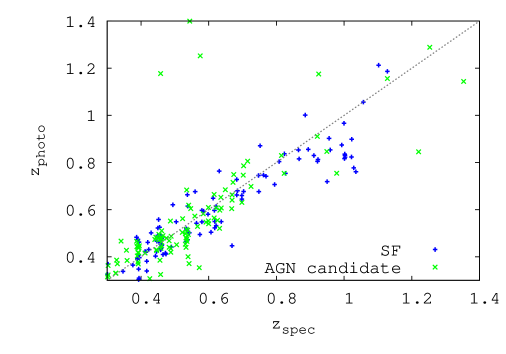
The normalised median absolute deviation was =0.043 for star-forming galaxies (blue; see later paragraph for classification) and 0.046 for AGN candidate (green), while the outlier rates, defined as , were 2.7 and 7.1%, respectively.
To estimate the PAH emission strength, we measured rest-frame 4.5m and 8m luminosities. Since PAH emission dominates 8m luminosity of star-forming galaxies while continuum emission dominates at 4.5m luminosity, the 8m to 4.5m luminosity ratio roughly corresponds to an 8m PAH equivalent width. Using the AKARI S7-L18W bands, these luminosities were calculated with less uncertainties from K-correction. For example, the L15 flux was used for calculation of 8m luminosities at using the following equation:
| (1) |
where DM is the distance module and the templates from Polletta et al. (2006, 2007) were applied. For 8m luminosities at =0.3-0.7, 0.7-1.2, and 1.2-1.4, we used S11, L15, and L18W bands, while we used S7, S9W, and S11 bands for 4.5m luminosities. The IRAC 2 and IRAC 4 bands were applied as 4.5m and 8m bands for the K-correction.
Our samples were divided into three categories, star-forming (SF), AGN candidate and elliptical galaxies, for which a best fitting template was provided with the . The N2-L24 bands were fitted to 25 POLLETTA templates of which three are elliptical, 13 are star-forming, and nine are AGNs. Among the AGN templates, three are type 1, three are type 2 or 1.8, two are composite (starburst+AGN), and one is a torus model, where the type 2 SEDs are dominated by host galaxies (Polletta et al.2007). Hence, even galaxies which are not dominated by AGNs are identified as AGNs and we call these sample AGN candidate. This conservative categorisation was performed to obtain a pure SF sample. Throughout this paper, AGN candidates are used only for comparison, and our conclusion is based only on star-forming galaxies.
To estimate the infrared luminosity more reliably, we also used Herschel/PACS 100m and 160m (Serjeant et al. in prep.) and SPIRE 250m, 350m, and 500m data (Pearson et al. in prep.). The survey with PACS 100 and 160m bands covers most of the NEP-Deep region with 5 sensitivity of 8 and 16 mJy, while the survey with the SPIRE 250, 350, and 500m bands covers nearly half of the field with 5 sensitivity of 26, 21.5, and 31 mJy and covers entire field with 45, 38, and 54 mJy. We cross-matched our sample with the PACS catalogue using a search radius of 5 arcsec and 160 objects were matched. The search radius was determined as 2.5 of the source separation distribution. The SPIRE photometry was made by fitting an elliptical Gaussian to the SPIRE timelines by assuming an initial position (RA, Dec) from the AKARI NEP catalogue. As a result, 1068 out of 1868 objects have SPIRE photometry. The errors of the absolute PACS photometry was estimated as large as 20%, while the SPIRE 10%.
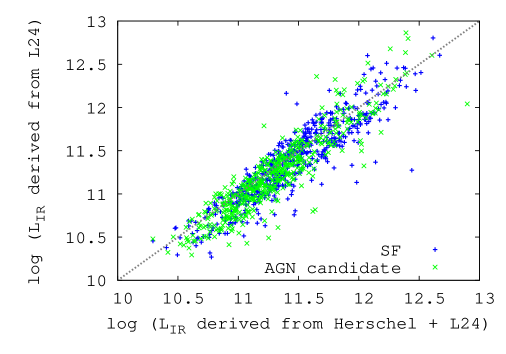
The infrared luminosities (integrated over 8-1000m) were estimated via an SED fitting with the Chary & Elbaz (2001) SED library using the L24, 100 and 160m (PACS), 250, 350, and 500m (SPIRE) photometry. We did not use AKARI N2 to L18W bands to avoid PAH emission which may overestimate the infrared luminosity. For objects undetected by any Herschel band, infrared luminosities were derived only from L24 band. To estimate the accuracy we compared the infrared luminosities derived from L24 and those from mid- to far-infrared bands, as shown in Fig.2. They agreed within 0.2dex for both SF and AGN candidates, although fainter galaxies tend to have a lower luminosity when derived only from L24 bands. It may result from the confusion limit of the SPIRE photometry, which can overestimate the flux, since we performed photometric measurements even if they are below the detection limit. However, we found our conclusions to be insensitive to the inclusion or exclusion of the Herschel data, so we believe the confusion effect not to be serious. Our SEDs show no mid-infrared excess (see also Daddi et al. 2007), since the redshift range of our sample is , where the infrared luminosities from the m photometry agree very will with those from far-infrared bandsElbaz et al. (2010). The infrared luminosities were converted into star-formation rate via multiplication of 1.0910-10[SFR/L⊙].
For each object, we calculated the specific star-formation rate, sSFR, defined as the star-formation rate divided by stellar mass. Masses were estimated from a SED fitting using Bruzual & Charlot (2003) SED models with solar metallicity. In this SED fitting, we used MegaCam , WIRCam , and AKARI N2, N3, and N4 bands. The typical mass of our sample is log = 10.4, 10.5, and 10.6 for =0.3-0.6, 0.6-0.9, and 0.9-1.4 bins, respectively. Most of our samples have values of log 10, which is similar to Nordon et al. (2012). The starburstiness is defined as the deviation of sSFR from that of main-sequence, defined by Elbaz et al. (2011).
| (2) | |||
| (3) |
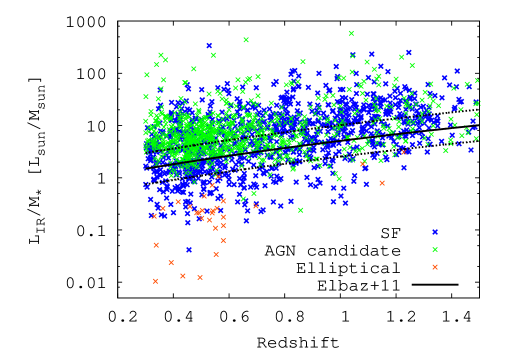
where is the age of the Universe at that redshift. We did not estimate the from our sample because high- main-sequence galaxies were incomplete. Fig.3 shows the variation of specific star-formation rate with redshift for our sample with a scatter of 0.3dex. We sample a wide range of the population, even below that of the main sequence at lower redshifts. However, our MS sample at 0.8 is incomplete due to a flux limit, which we discuss in the section 4. The figure also shows AGN candidate galaxies have a higher than star-forming galaxies while all elliptical galaxies have a lower than the main-sequence. The SFR and were derived from the infrared luminosity. We note that of AGN candidates might be overestimated. However, this does not affect our conclusions because they are based only on the SF galaxies; the AGN candidates are only used for comparison.
3 Results
Previous studies using the Spitzer Space Telescope (Elbaz et al. and Nordon et al.) showed that high starburstiness galaxies have lower PAH emission than expected from the infrared luminosity. Elbaz et al. (2011) showed that IR8 () correlates with , where 8m luminosities were measured with IRAC4, IRS 16m, and MIPS 24m bands for galaxies at 0.3, 1, and 2, respectively. Nordon et al. (2012) obtained similar results for 1 and 2 galaxies using ultra deep IRS spectra and showed that the spectra are dominated by PAH emission. In our work, IR8 and ratio of galaxies at 0.3-1.4 were obtained using the continuous wavelength coverage of the AKARI/IRC. The AGNs and elliptical galaxies were separated from our sample to study the behaviour of PAHs in star-forming galaxies.
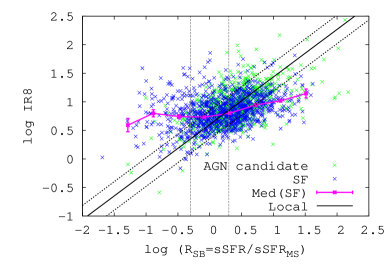
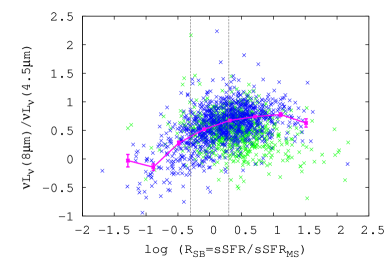
In the left panel of the Fig.4, the IR8 ratios are plotted against the starburstiness for star-forming galaxies. The AGN candidates are also shown for comparison. The median value of the IR8 for the star-forming galaxies are constant at log()0 and increases with starburstiness at log()0. The errors of the median values were defined as the 68th percentile of the data distribution divided by the square root of the number of samples in each bin. Although the data show a non-negligible scatter compared with the local relation (black lines), our data are consistent with the results from Elbaz et al. (2011). This result indicates the rise of IR8 with starburstiness among the star-forming galaxies in our sample, which suggests a relative “weakness” of PAH emission with respect to for high . We refer to this weakness of PAH emission at high as a “PAH deficit”. We note that the median of the IR8 at lower may be overestimated due to the incompleteness of main-sequence galaxies, although it does not deny that high galaxies have a PAH deficit. We note again that a fraction of our infrared luminosities are based only on L24 photometry, which does not affect our result. This is because the redshift range of our sample is 1.4, where derived from 24m photometry is consistent with those from far-infrared (Elbaz et al.2011), as shown in Fig.2.
In the right panel, ratios are shown against starburstiness. The median value for the star-forming galaxies increases with starburstiness at log()0.5 and stays constant at log()0.5, which is consistent again with the view that starburst galaxies have a relative “weakness” of PAH emission. On the other hand, the ratios of AGN candidates at higher are lower than those of star-forming galaxies. Some objects show a higher luminosity ratio, log , which is similar to the “PAH selected galaxy” of Takagi et al. (2010). These galaxies are mainly distributed at moderate starburstiness, log -0.5-0.5. We found that these galaxies have similar IR8 to other normal star-forming galaxies, which is consistent with Takagi et al. (2010). Although some AGN candidates also show high ratio, this might be due to misclassification (see §2). We note that a systematic bias could affect our result since we excluded AGN some of which might be star-forming (see §2). However, since including these misclassified objects leads to lower ratios, as indicated in the right panel of Fig.4, it cannot affect our conclusion that starburst galaxies have a relative weakness of PAH emission.
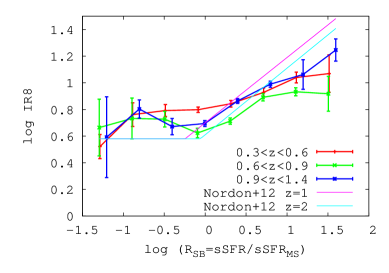
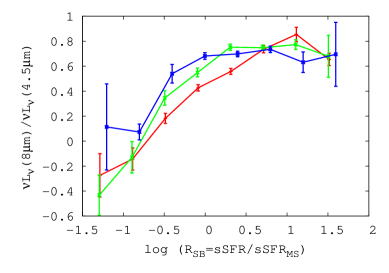
Lastly, we show the redshift dependence of the relation between PAH strength and starburstiness in Fig.5. In the left panel, the median value of the IR8 ratios are shown against starburstiness with three redshift bins, , , and . For all redshift bins, IR8 ratios are constant at log()0 and increase with starburstiness at log()0. This result is consistent with Nordon et al. (2012). Although their curves show a redshift dependence, they mentioned the uncertainty of 0.1-0.15 dex in the methods to derive sSFRMS, and can account for the redshift dependence. In the right panel, the median value of the ratios are shown against the starburstiness with the same redshift bins. In all redshift bins, increases with starburstiness at log()0.5 and is constant at log()0.5.
We consider here how the sample selection with the flux limit affects our results. As mentioned in section 2, our MS is not complete, which leads a higher IR8 for lower galaxies. Considering this effect is different in different redshift bins, we cannot reject a possibility that the similarity of the relation between IR8 and at different redshifts is only a coincidence. Nonetheless, this effect cannot explain the higher IR8 for higher , so that we can conclude that our results are qualitatively reliable. On the other hand, the detection limits of 4.5m and 8m luminosities can lead to a lower and higher ratios, respectively. To investigate this systematic effect, we applied flux cuts at various flux of S7 and S11 bands, which correspond to 4.5m and 8m at 0.4. Our results did not change in this test, confirming again our results are robust.
4 Discussion
Previous studies have established that the mid-infrared SED reflects the physical condition of galaxies rather than the infrared luminosity. For example, Nordon et al. (2012) also showed that higher starburstiness galaxies have lower PAH emission and suggested that the dominant cause of the PAH weakness is the intense radiation fields by using the Spitzer space telescope. However, they focused only on and galaxies owing to their wavelength coverage. In our study, we explored the PAH behaviour of starburst galaxies at =0.3-1.4, making use of the AKARI’s continuous filter coverage at 2-24m.
In this section, we discuss the nature of the PAH deficit. We refer to measures of the [CII] deficit as measured in the far-infrared, since the [CII] emission also originates in the PDRs and the deficit is seen at low and high-redshifts Luhman et al. (2003); Abel et al. (2009); Graciá-Carpio et al. (2011); Díaz-Santos et al. (2013); Farrah et al. (2013). Here, we discuss five possibilities of the nature of the PAH deficit: a stronger continuum due to AGN or starburst, compact star-forming regions, a lack of ionising photons, low metallicity, and dust attenuation.
If a strong continuum from the AGN or starburst dominate at mid-infrared luminosity, should be small. However, we excluded all AGN candidates through the SED fitting with nine AKARI infrared bands, in which star-forming galaxies may be included. Due to this conservative exclusion, the AGN are less likely to affect our results. On the other hand, even with an extremely strong starformation with an ionisation parameter of , the 4.5m continuum cannot significantly be affected Draine & Li (2007). Hence, the cause of the PAH deficit is not likely to be the underlying continuum.
If the PAHs are destroyed by strong UV radiation from the compact star-forming regions, the PAH emission weakens for a fixed LIR Peeters et al. (2004). Elbaz et al. (2011) shows the IR8 correlates with star-formation compactness. According to this relation, the PAH deficit galaxies have compact star-forming regions. It also predicts that galaxies with moderate starburstiness have extended star-forming regions. At moderate starburstiness, log , in Fig.4, some galaxies with higher ratio were identified. Takagi et al. (2010) argued that such high luminosity ratios cannot be explained unless they have an extended star-forming region. Hence, these results support the possibility that PAHs are destroyed by strong UV radiation.
On the other hand, if UV photons are absorbed by dust in HII regions and cannot reach the PAHs in PDRs, photoelectric heating of the PDRs should be less efficient, which results in both [CII] and PAH deficits Abel et al. (2009); Graciá-Carpio et al. (2011). We do not have enough data to confirm or reject this possibility. However, since a high ionisation parameter results in high dust absorption of UV photons Abel et al. (2009), we have to note that these two scenarios, “a lack of UV photons” and “compact starburst” could be connected.
Galaxies with low metallicity should have a small amount of PAH particles, which results in lower PAH emission Engelbracht et al. (2005). To investigate this possibility, we compared the metallicity against the ratio. The metallicity was derived from [NII]/ flux ratio observed with the Subaru/FMOS, as described in Appendix A. We found no relation between metallicity and the luminosity ratio. However, our metallicity range is only 12 + log O/H 8.5, although the PAH weakness can only be seen in 12 + log O/H8.0 Engelbracht et al. (2005). Hence, we cannot strongly constrain this possibility.
Although dust attenuation is quite weak at mid-infrared wavelengths, it is still higher than in the far-infrared, so that IR8 can be higher due to dust attenuation. However, if we assume 8m and 4.5m radiate from the same regions, dust attenuation should lead a higher ratio. Furthermore, PAH deficit correlates with [CII] deficit, where dust attenuation is negligible. Hence, a constant indicates the intrinsic relative weakness of PAH emission in starburst galaxies.
Summarising the discussions above, the dominant processes of the PAH deficit are probably due to a harsh radiation from compact starbursts and/or a lack of UV photons due to dust absorption.
5 Conclusion
We studied the PAH behaviour of galaxies at =0.3-1.4 using 1868 galaxies sampled from the revised catalogue of the AKARI NEP-Deep survey. The continuous wavelength coverage at 2-24m of the AKARI/IRC enabled us to measure the ratio and the IR8 for the redshift range of interest. All AGN candidates were separated with an SED fitting using nine AKARI filters. We found the ratio increased at lower starburstiness, while it stayed constant at higher starburstiness. Similarly, IR8 was constant at lower starburstiness and increased with starburstiness at higher starburstiness. This relative weakness of the PAHs was seen throughout the redshift range . We also found that galaxies with the highest ratio have moderate starburstiness. These results can be interpreted as follows: starburst galaxies have compact star-forming regions, whose UV radiation destroys PAHs, and/or have dusty HII regions where a fraction of UV photons are absorbed by dust and PAHs cannot be excited.
Acknowledgements.
The AKARI NEP-Deep survey project activities are supported by JSPS grant 23244040. TM is supported by UNAM DGAPA Grant PAPIIT IN104113 and CONACyT Grant 179662.Appendix A Subaru/FMOS observation and data reduction
The Subaru/FMOS Kimura et al. (2010) observations were conducted on 20-21 June 2012 to study star-forming galaxies at an intermediate redshift. The 733 objects were selected with infrared luminosity, having fluxes of 0.410-16erg cm-2 s-1 and were observed using a J-long band with Cross Beam Switch mode, where two fibres were allocated for each target. One observes the target and another observes the sky 90 arcsec away from the target; the roles are switched at each exposure. The fibre has a 1.2 arcsec aperture diameter, and the positional accuracy is 0.2 arcsec. The on-source exposure time was 0.5-2h. The spectral resolution of the J-long is =1900.
The data reduction was performed with the FMOS pipeline, FIBRE-pac Iwamuro et al. (2012). The sky subtraction was conducted with A-B exposure for each observing set. The wavelength calibration was carried out using OH masks, and the relative flux calibration was conducted with G-K type stars selected by the colour-colour diagram. Although fibre loss was not considered, which caused 0.2dex absolute flux error, it does not affect the line-flux ratio measurements.
Among the 733 objects, 96 objects were found to have at least one emission line, of which 32 have both H and [NII]6584 lines. The line fluxes were measured by fitting with Gaussian functions. The line ratios were converted to the metallicities using the relation Pettini & Pagel (2004),
| (4) |
Our targets have a metallicity range of 12 + log(O/H)=8.3-9.0.
References
- Abel et al. (2009) Abel, N. P., Dudley, C., Fischer, J., Satyapal, S., & van Hoof, P. A. M. 2009, ApJ, 701, 1147
- Arnouts et al. (2007) Arnouts, S., Walcher, C. J., Le Fèvre, O., et al. 2007, A&A, 476, 137
- Bertin & Arnouts (1996) Bertin, E. & Arnouts, S. 1996, A&AS, 117, 393
- Bruzual & Charlot (2003) Bruzual, G. & Charlot, S. 2003, MNRAS, 344, 1000
- Caputi et al. (2007) Caputi, K. I., Lagache, G., Yan, L., et al. 2007, ApJ, 660, 97
- Chabrier (2003) Chabrier, G. 2003, PASP, 115, 763
- Chary & Elbaz (2001) Chary, R. & Elbaz, D. 2001, ApJ, 556, 562
- Daddi et al. (2007) Daddi, E., Dickinson, M., Morrison, G., et al. 2007, ApJ, 670, 156
- Díaz-Santos et al. (2013) Díaz-Santos, T., Armus, L., Charmandaris, V., et al. 2013, ApJ, 774, 68
- Draine & Li (2007) Draine, B. T. & Li, A. 2007, ApJ, 657, 810
- Elbaz et al. (2007) Elbaz, D., Daddi, E., Le Borgne, D., et al. 2007, A&A, 468, 33
- Elbaz et al. (2011) Elbaz, D., Dickinson, M., Hwang, H. S., et al. 2011, A&A, 533, A119
- Elbaz et al. (2010) Elbaz, D., Hwang, H. S., Magnelli, B., et al. 2010, A&A, 518, L29
- Engelbracht et al. (2005) Engelbracht, C. W., Gordon, K. D., Rieke, G. H., et al. 2005, ApJ, 628, L29
- Farrah et al. (2013) Farrah, D., Lebouteiller, V., Spoon, H. W. W., et al. 2013, ApJ, 776, 38
- Graciá-Carpio et al. (2011) Graciá-Carpio, J., Sturm, E., Hailey-Dunsheath, S., et al. 2011, ApJ, 728, L7
- Guo et al. (2013) Guo, K., Zheng, X. Z., & Fu, H. 2013, ApJ, 778, 23
- Huang et al. (2009) Huang, J.-S., Faber, S. M., Daddi, E., et al. 2009, ApJ, 700, 183
- Ilbert et al. (2006) Ilbert, O., Arnouts, S., McCracken, H. J., et al. 2006, A&A, 457, 841
- Iwamuro et al. (2012) Iwamuro, F., Moritani, Y., Yabe, K., et al. 2012, PASJ, 64, 59
- Kimura et al. (2010) Kimura, M., Maihara, T., Iwamuro, F., et al. 2010, PASJ, 62, 1135
- Le Floc’h et al. (2005) Le Floc’h, E., Papovich, C., Dole, H., et al. 2005, ApJ, 632, 169
- Luhman et al. (2003) Luhman, M. L., Satyapal, S., Fischer, J., et al. 2003, ApJ, 594, 758
- Matsuhara et al. (2006) Matsuhara, H., Wada, T., Matsuura, S., et al. 2006, PASJ, 58, 673
- Murakami et al. (2007) Murakami, H., Baba, H., Barthel, P., et al. 2007, PASJ, 59, 369
- Murata et al. (2013) Murata, K., Matsuhara, H., Wada, T., et al. 2013, A&A, 559, A132
- Noeske et al. (2007) Noeske, K. G., Weiner, B. J., Faber, S. M., et al. 2007, ApJ, 660, L43
- Nordon et al. (2012) Nordon, R., Lutz, D., Genzel, R., et al. 2012, ApJ, 745, 182
- Oi et al. (2014) Oi, N., Matsuhara, H., Murata, K., et al. 2014, ArXiv e-prints
- Onaka et al. (2007) Onaka, T., Matsuhara, H., Wada, T., et al. 2007, PASJ, 59, 401
- Peeters et al. (2004) Peeters, E., Spoon, H. W. W., & Tielens, A. G. G. M. 2004, ApJ, 613, 986
- Pérez-González et al. (2005) Pérez-González, P. G., Rieke, G. H., Egami, E., et al. 2005, ApJ, 630, 82
- Pettini & Pagel (2004) Pettini, M. & Pagel, B. E. J. 2004, MNRAS, 348, L59
- Polletta et al. (2007) Polletta, M., Tajer, M., Maraschi, L., et al. 2007, ApJ, 663, 81
- Polletta et al. (2006) Polletta, M. d. C., Wilkes, B. J., Siana, B., et al. 2006, ApJ, 642, 673
- Rigby et al. (2008) Rigby, J. R., Marcillac, D., Egami, E., et al. 2008, ApJ, 675, 262
- Salmi et al. (2012) Salmi, F., Daddi, E., Elbaz, D., et al. 2012, ApJ, 754, L14
- Shim et al. (2013) Shim, H., Im, M., Ko, J., et al. 2013, ApJS, 207, 37
- Takagi et al. (2010) Takagi, T., Ohyama, Y., Goto, T., et al. 2010, A&A, 514, A5
- Tielens (2008) Tielens, A. G. G. M. 2008, ARA&A, 46, 289
- Wada et al. (2008) Wada, T., Matsuhara, H., Oyabu, S., et al. 2008, PASJ, 60, 517
- Werner et al. (2004) Werner, M. W., Roellig, T. L., Low, F. J., et al. 2004, ApJS, 154, 1