Symmetries and selection rules in the measurement of the phonon spectrum of graphene and related materials
Abstract
When the phonon spectrum of a material is measured in a scattering experiment, selection rules preclude the observation of phonons that are odd under reflection by the scattering plane. Understanding these rules is crucial to correctly interpret experiments and to detect broken symmetries. Taking graphene as a case study, in this work we derive the complete set of selection rules for the honeycomb lattice, showing that some of them have been missed or misinterpreted in the literature. Focusing on the technique of high-resolution electron energy loss spectroscopy (HREELS), we calculate the scattering intensity for a simple force constant model to illustrate these rules. In addition, we present HREELS measurements of the phonon dispersion for graphene on Ru(0001) and find excellent agreement with the theory. We also illustrate the effect of different symmetry breaking scenarios in the selection rules and discuss previous experiments in light of our results.
I Introduction
The investigation of surface phonons is an invaluable tool to study materials Kress and de Wette ; Benedek et al. (1994), as it provides a wealth of information on their structural Politano et al. (2012), electronic Piscanec et al. (2004), magnetic Benedek et al. (2001) or thermal properties Talwar et al. (1981), to name a few. Among many experimental probes, surface scattering experiments are particularly well suited to measure phonon spectra. As in any scattering setup, however, the mapping of the full phonon dispersion with these methods is sometimes limited by selection rules Kress and de Wette ; Ibach and Mills , which preclude the observation of certain phonon branches. The understanding of these rules is therefore crucial in the design and interpretation of these experiments.
The origin of selection rules is the presence of symmetries that enforce conservation laws. In surface scattering experiments, a selection rule applies when the scattering plane, defined by the momenta of the incident and scattered particles, coincides with a mirror plane of the surface. The selection rule states that phonons that are odd under this mirror reflection cannot be observed Ibach and Mills ; Szeftel (1985); Balden et al. (1992); Doak (1990), and can be easily understood as the conservation of parity under reflections: since incoming and scattered wavefunctions of the probe have even parity, the excitation of an odd parity phonon is forbidden, and the contribution to the cross section from this process is zero.
In experiments, the simplest geometry to measure phonon dispersions is planar scattering, with the scattering plane perpendicular to the surface. Since one is usually interested in the dispersion along high symmetry directions, the scattering plane is often a mirror plane and selection rules apply. Knowledge of these rules can thus be of great help to interpret the data, for example to assign symmetry labels to phonon branches or to detect broken symmetries. Moreover, this understanding can be used to devise more complicated non-planar scattering geometries Balden et al. (1992); Yater et al. (1990); Erskine et al. (1990); Glebov et al. (1996); Doak (1990) that are not affected by selection rules and allow one to observe the odd modes 111A selection rule for a particular high-symmetry line can be avoided altogether by choosing to measure in a replica of this line that does not map onto itself under the corresponding reflection. This measurement usually requires two independent rotations of the sample and is far less common..
To measure phonon dispersions, one of the most powerful experimental probes is high-resolution electron energy loss spectroscopy (HREELS). Among other advantages, this technique offers excellent energy and momentum resolution and allows one to map the full phonon spectrum. HREELS has been applied to many systems with great success, and is very useful in particular to measure the spectrum of epitaxial monolayers grown on a substrate, where inelastic neutron or X-ray scattering cannot be used. A well known example is the case of graphene monolayers, where the effect of different substrates on the phonon spectrum has been widely studied Aizawa et al. (1992); Siebentritt et al. (1997); Oshima et al. (1988); Aizawa et al. (1990a); Tilley et al. (1995); Farías et al. (2000); Shikin et al. (1999); Aizawa et al. (1990b); Yanagisawa et al. (2005); Aizawa et al. (1990c); Farías et al. (1999); Hwang et al. (1992); Yanagisawa et al. (2004); Aizawa et al. (2001).
The case of HREELS studies of epitaxial graphene is of particular interest because, despite the many experiments reported, their interpretation in terms of selection rules has often been misleading. While most studies acknowledge the existence of a selection rule which forbids the observation of the shear horizontal mode, SH, (or transverse acoustic, TA) along the direction, other selection rules are sometimes misquoted and some have been completely missed. The purpose of this work is to provide a detailed study of the selection rules for surfaces with symmetry, taking the case of graphene as an example. Our main result is the full set of selection rules, summarized in Fig. 1: the modes TA and TO along the direction and the modes TA, ZO and LO along are all odd and thus should not be observed. Our results are worked out for HREELS for concreteness, but are equally applicable to any other planar scattering experiment.
In the rest of this work, we first discuss how selection rules appear in the computation of the HREELS scattering rate. We illustrate our results for this with a simplified phonon model, and we compare them with our experimental HREELS data for graphene on Ru(0001). Finally, we will discuss how symmetry breaking can render selection rules inactive, and interpret previous experiments in light of our results.
II Selection rules in the HREELS intensity
The origin of the selection rule explained in the introduction can be seen more explicitly by considering the computation of the HREELS cross section Ibach and Mills ; Li et al. (1980) due to phonon excitations. The relevant kinematic regime for this process is known as impact scattering, where high-energy electrons interact with the short-range part of the atomic potential. The incoming electron with energy and momentum is scattered off a surface and is recovered with energy and momentum . The excitation of a phonon of frequency and momentum is detected in the loss spectrum as a resonance peak at and .
Because of the geometry of this problem it will be convenient to separate vectors into in-plane and out of plane components, , reserving the arrow notation for two-dimensional vectors in the plane. For a given phonon of momentum in the Brillouin Zone (BZ) and eigenvector , where labels the different atoms in the unit cell, the scattering amplitude in the impact scattering regime is proportional to the matrix element Li et al. (1980)
| (1) |
where is the position of atom in the unit cell. The scattering rate is proportional to . This matrix element accounts for the dominant changes in intensity as the BZ is sampled for a fixed . The full theory for the scattering cross section can be found in Refs. Ibach and Mills, ; Li et al., 1980, but knowledge of Eq. 1 will suffice for our purposes.
The selection rules can now be explained in terms of Eq. 1. When the scattering plane is aligned with a mirror plane of the surface, is invariant under the mirror plane. The phonon eigenvectors at the corresponding can thus be chosen with well defined parity under this symmetry. The selection rule occurs because the matrix element must be invariant under the symmetry, and since is invariant, when is odd we must have , which implies .
III Application to the honeycomb lattice
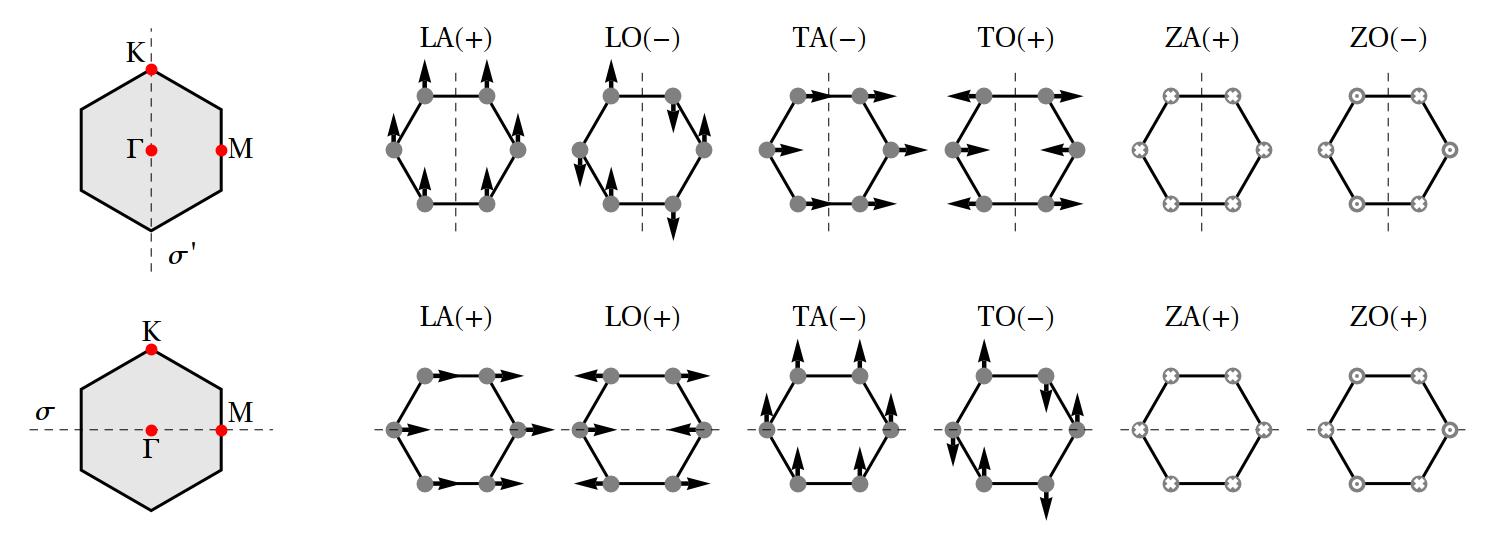
The honeycomb lattice has symmetry group , which has two types of mirror planes, and represented in Fig. 1. In the BZ, the plane is aligned with the direction, while the plane is aligned with . The selection rules are simple to state. For any surface with symmetry and in a planar scattering experiment, if lies in odd phonons under are not observed, while if lies in odd phonons under are not observed. The parity for any branch can be determined from its parity at in the absence of crossings.
In the honeycomb lattice there are six phonon branches, four in-plane and two out-of-plane. At the point, the in-plane acoustic (A) branches are degenerate and transform as , while the in-plane optical (O) branches transform as . For these modes one can define transverse (T) and longitudinal (L) polarizations along either or , which determines their transformation under reflections. The out-of-plane acoustical (ZA) and optical (ZO) transform as and respectively. The parities under both reflections for all six branches are illustrated in Fig. 1 and are summarized as follows: the odd modes are the TA and TO in , and the the TA, LO and ZO in . The selection rule then states that none of these modes should be observed in an HREELS experiment.
This statement can be checked explicitly with a computation of the HREELS matrix element, Eq. 1. Since our aim is to illustrate selection rules, we will use a minimal force constant model to describe the phonons, following Ref. Aizawa et al., 1990a. In this model the in-plane and out-of-plane modes are decoupled and may be treated separately. For the in-plane modes the energy functional includes nearest neighbor bond-stretching and bond bending terms. Denoting the two sites in the unit cell , the energy is
| (2) | ||||
where runs through all unit cells and is the nearest neighbor vector with and . The out-of-plane modes are modeled with an out-of-plane bond bending term
| (3) |
The phonon energies and eigenvectors are obtained from the equations of motion derived from these energies, , with the mass of a carbon atom, and the EELS matrix elements are then computed according to Eq. 1. Note that for out-of-plane phonons of a given the value of has to be determined from kinematics from
| (4) |
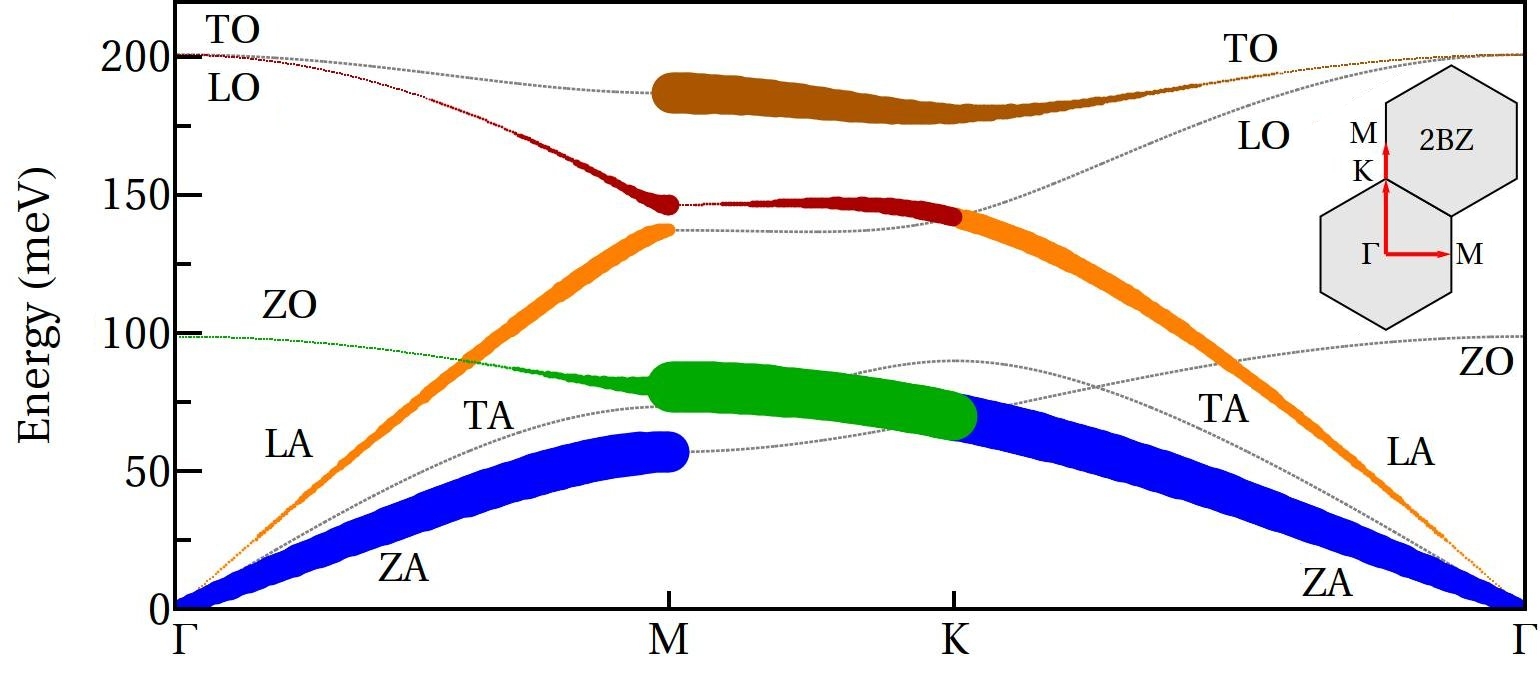
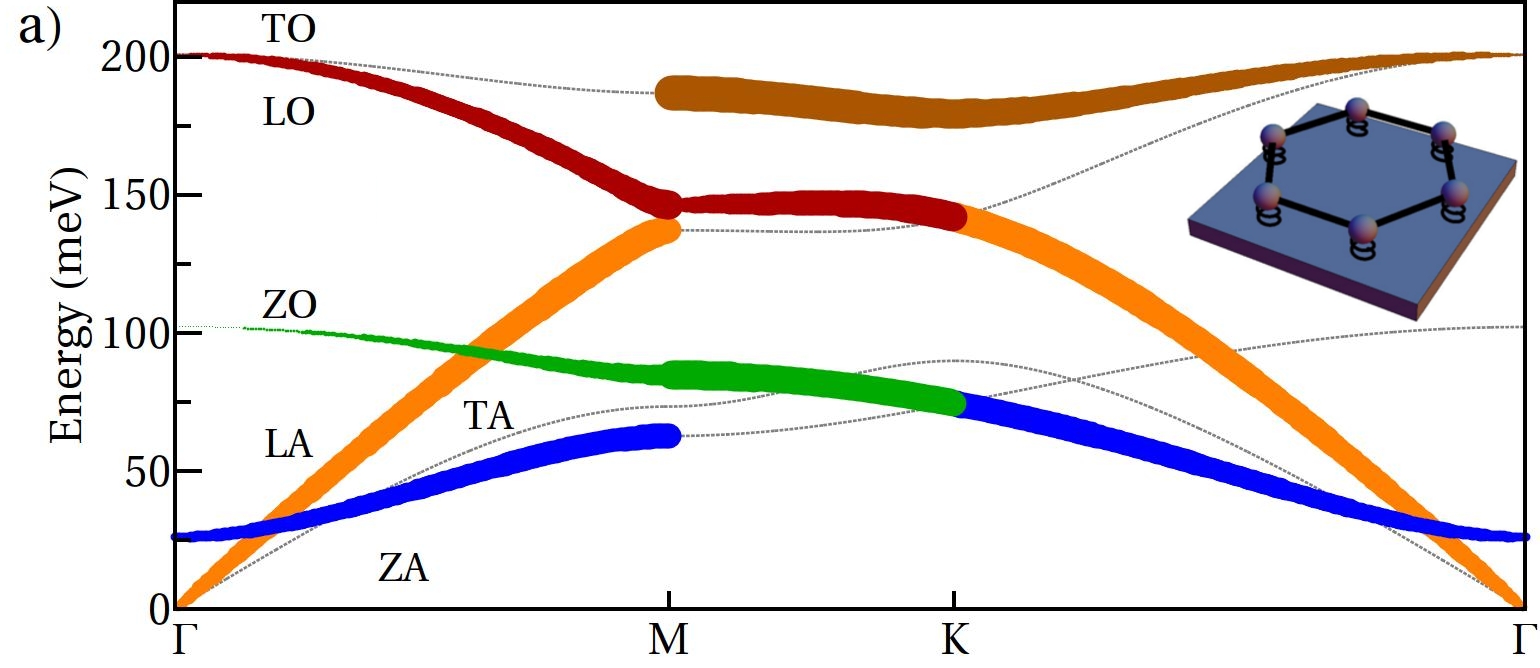
where because for all phonon energies. The results of this computation are shown in Fig. 2 for the choice of parameters , and . The incident energy is eV. The different branches are plotted with point size proportional to (with absolute scale chosen arbitrarily) and branches with zero intensity are denoted with gray dotted lines. All selection rules are seen to apply as predicted.
IV Comparison with experiment
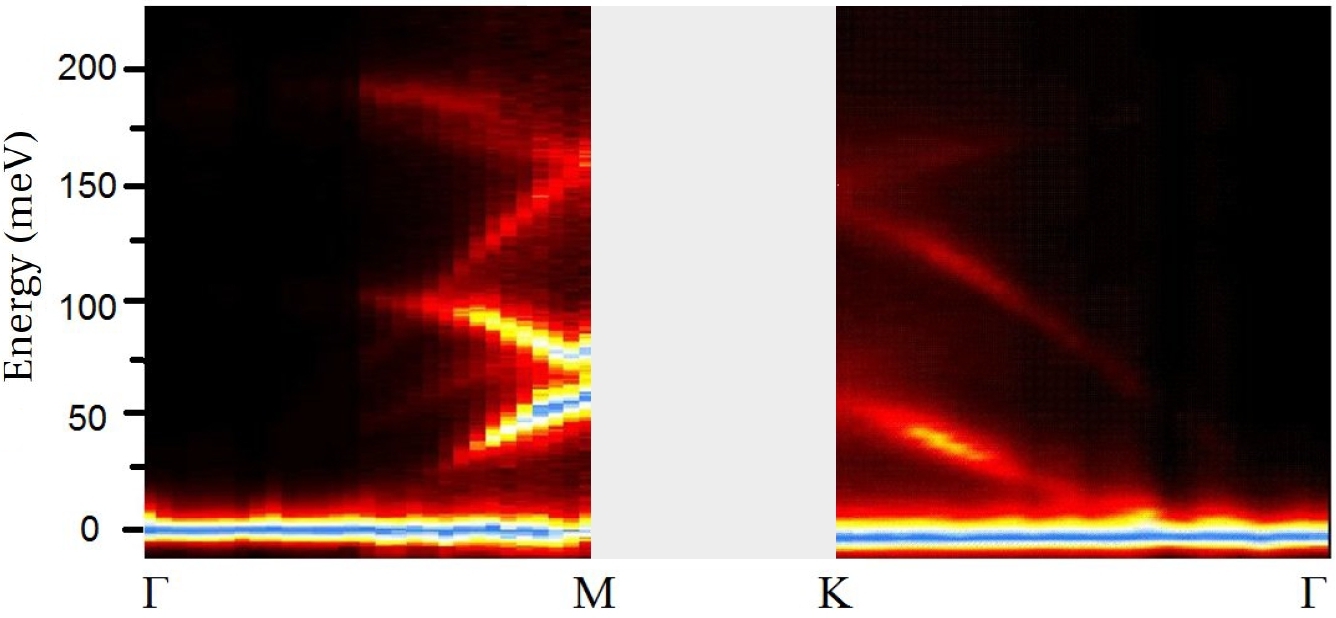
To test our predictions for the selection rules, we have measured high resolution EELS spectra of graphene on Ru(0001)Marchini et al. (2007); Martoccia et al. (2008); Vázquez de Parga et al. (2008); Pan et al. (2009); Borca et al. (2010); Martoccia et al. (2010); Moritz et al. (2010); Politano et al. (2011); Günther et al. (2011); Armbrust et al. (2012); Politano et al. (2013). This system is an ideal playground to test symmetries of phonon modes since single domain samples extending up to a millimeter square can be obtained, as revealed by STM studies Pan et al. (2009). This is in contrast with other graphene/metal interfaces for which many domains with different azimuthal rotations are found Loginova et al. (2009); Cazzanelli et al. (2013). The experimental phonon dispersion obtained is reported in Fig. 2b. Data was taken for both the and directions in scattering conditions enhancing the cross-section for phonon modes in graphitic systems, that is, primary electron beam energy 20 eV and grazing incidence. Other primary energies provide the same phonon dispersion with reduced intensity. Notice that for 20 eV, geometrical constraints of the HREELS analyzer do not allow one to reach values of sufficient to span the line222The phonon dispersion along was recorded with 32 eV. However, the cross-section of phonon modes in this scattering conditions became so weak that a comparison with data acquired by using 20 eV would not be meaningful.. For the and lines measured in this work, the absence of the branches affected by selection rules is manifest, and it is matched by the predictions: TA and TO are absent in and TA, ZO, LO are absent in . The general intensity trend is also correct, showing in particular that there is higher intensity for the out of plane branches because .
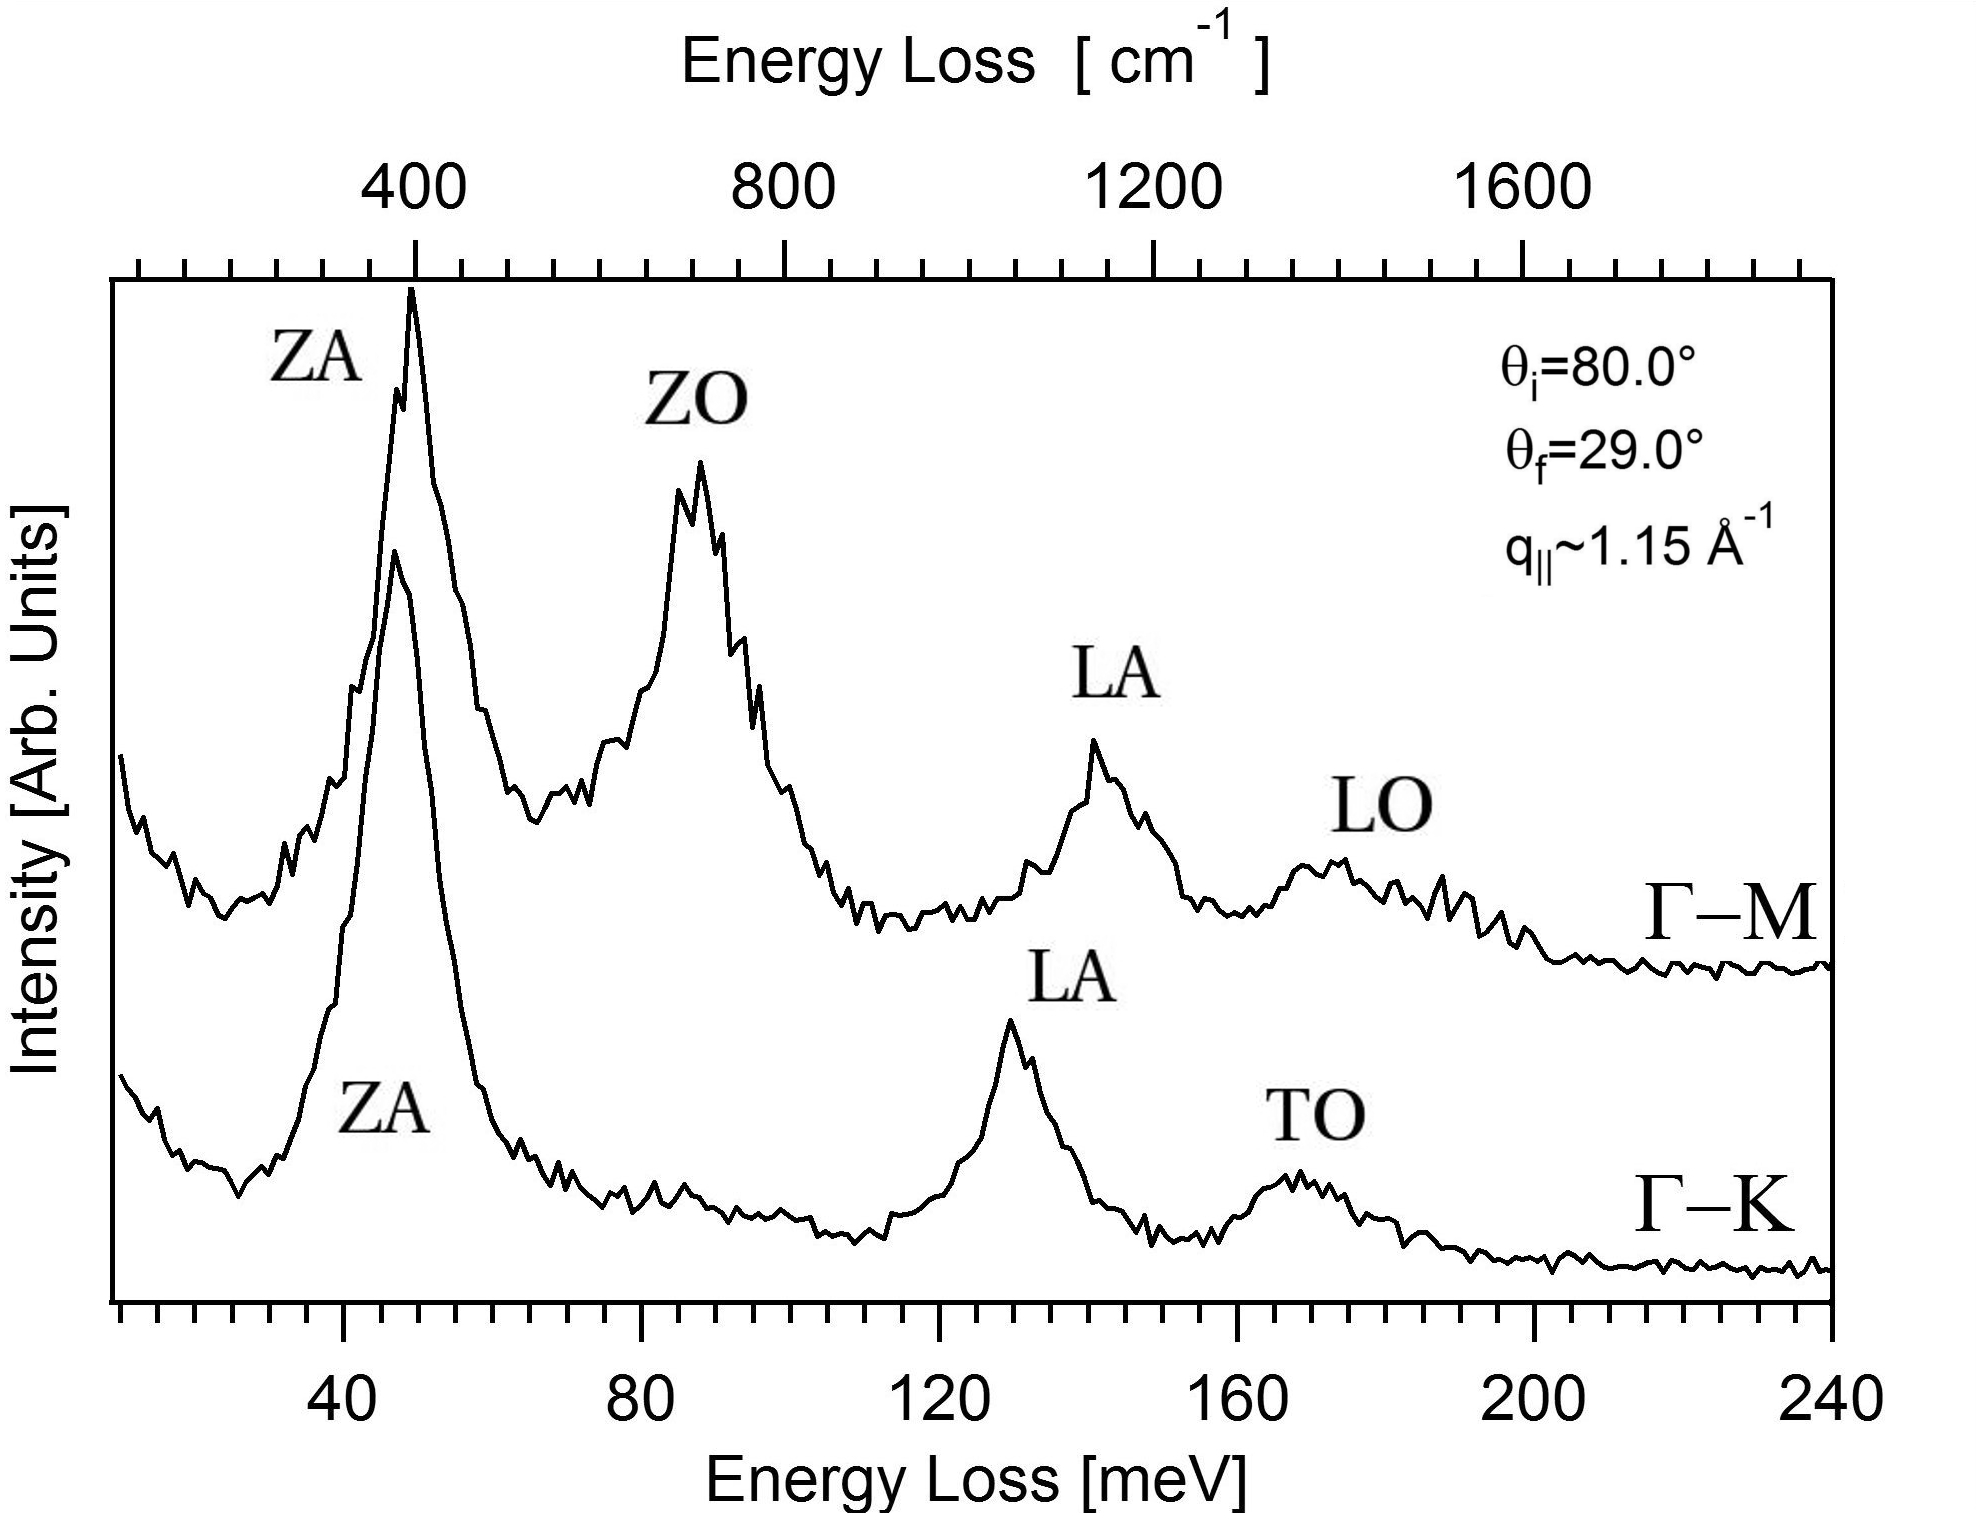
The selection rule for the ZO in the direction has not been noticed so far, but here its effects are demonstrated clearly, as the ZO branch completely vanishes in this direction. This effect is illustrated more explicitly in Fig. 3 where the EELS spectra for the and directions and are shown as a function of energy. The absence of the ZO peak in is clearly seen. Fig. 3 also emphasizes that in , the highest frequency mode that is observed should be labeled TO, contrary to what happens in , where the highest mode observed is LO.
The phonon dispersion itself also matches reasonably well the experiment, and deviations only occur for the branches affected by Kohn anomalies Piscanec et al. (2004), a well known limitation of short-ranged modelsFalkovsky (2008); Viola Kusminskiy et al. (2009) that do not account for the coupling to the electronsWirtz and Rubio (2004); Lazzeri et al. (2008). The modes strongly affected by Kohn anomalies are the TO mode at , which is shifted down almost to the LO/LA crossing, and the LO at , which should disperse upward faster than the TO, an effect known as overbending. These two effects are missed by our model but can be reproduced with ab-initio calculations including electron-phonon interactions Lazzeri et al. (2008).
V Breaking selection rules
When an experiment reports finite but small intensity coming from forbidden branches, it is important to understand the origin of this effect, as this may provide information on the symmetries of the surface. A first reason why forbidden branches can be observable is simply the finite angle resolution of the detector, which will collect electrons in a momentum range that necessarily goes out of the high symmetry line, introducing some contribution to the intensity. For HREELS experiments this contribution is however negligible. Misalignment of the high symmetry directions will also render selection rules inactive Tilley et al. (1995). A second mechanism is disorder, which breaks translational symmetry. If momentum is not conserved, electrons collected at a particular angle may have scattered phonons with a distribution of momenta for which the selection rule does not apply. This may also happen for samples with good crystalline order but with domains of random orientation. Thus when selection rules are violated this is commonly interpreted as a signal of the disorder in the sample.
When the previous mechanisms have been excluded, the violation of a selection rule is likely the result of symmetry breaking. For example, the surface under study may be reconstructed with reduced symmetry. Or in our case, the substrate where the graphene monolayer is grown may introduce strain or additional spring constants which again break the symmetry to a lower subgroup. We now explore this last case in more detail, considering two natural examples. First, consider a honeycomb lattice that lies on top of a substrate. This can be modeled by spring constants connecting each sublattice to the substrate
| (5) |
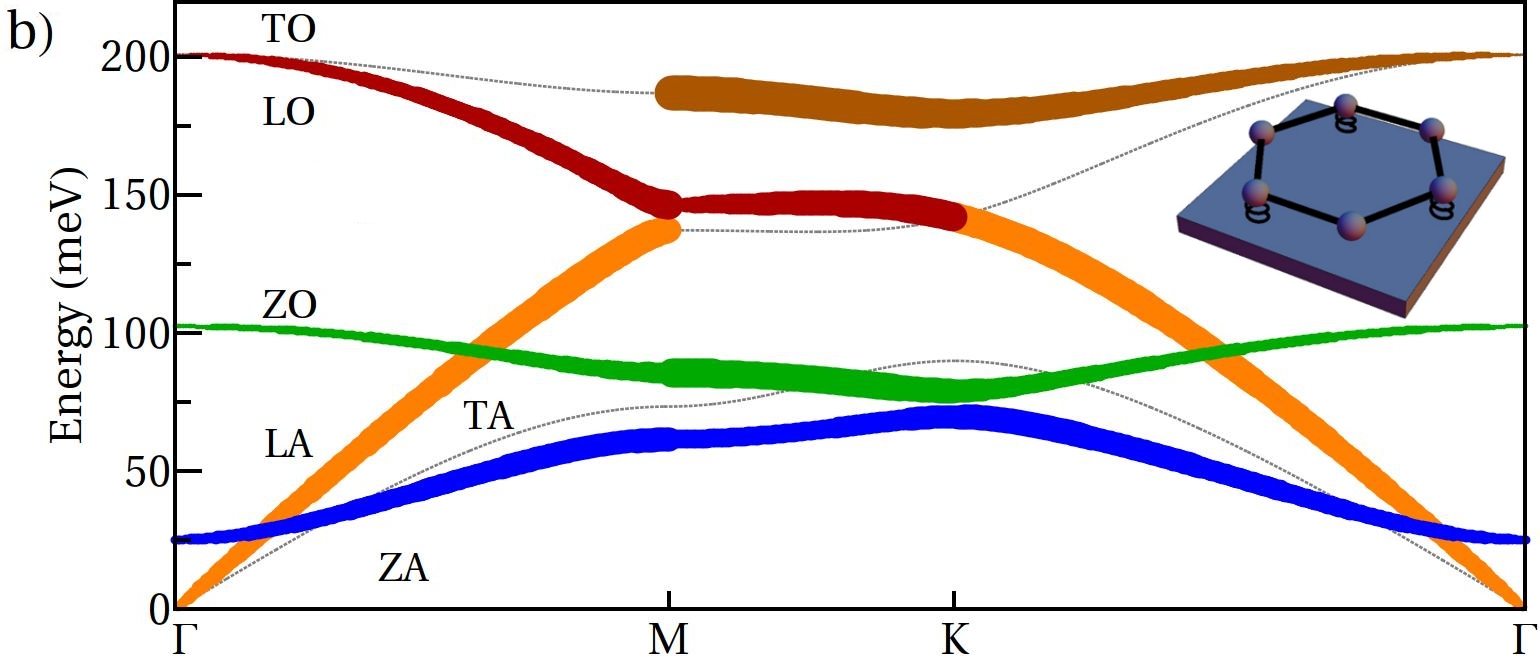
These couplings have typical values of 1-5 for different metalsAizawa et al. (1990a); Allard and Wirtz (2010). For a homogeneous substrate we have , while for a perfectly commensurate triangular lattice substrate, for example for graphene on Ni(111), we have , . In the latter case, the point is group is reduced to and the reflection is broken, so that selection rules in become inactive for out-of-plane modes. The computed EELS intensity for these two types of substrates is shown in Figs. 4a-b. While both perturbations affect the spectrum, we see that only the second one changes the selection rules, making the visible in . Since the substrate coupling only affects , selection rules for in-plane modes remain valid.
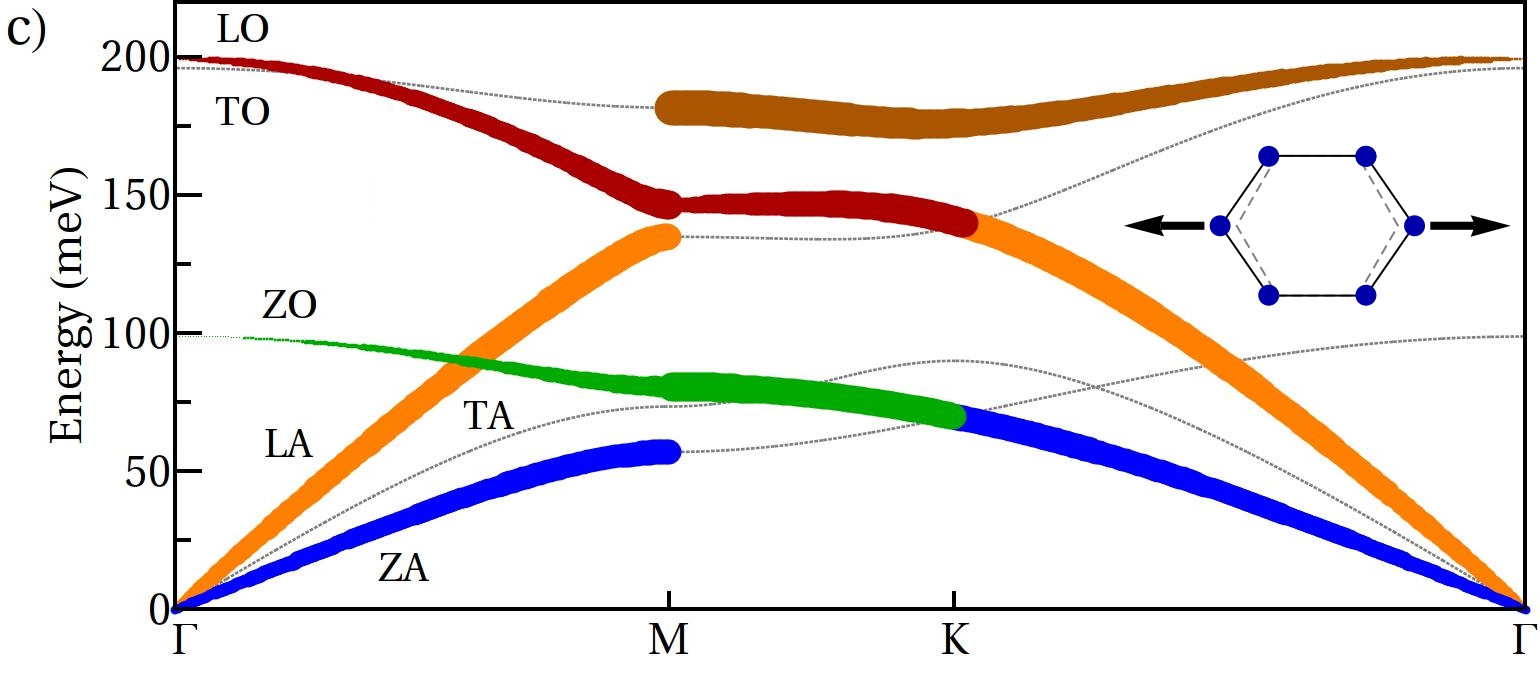
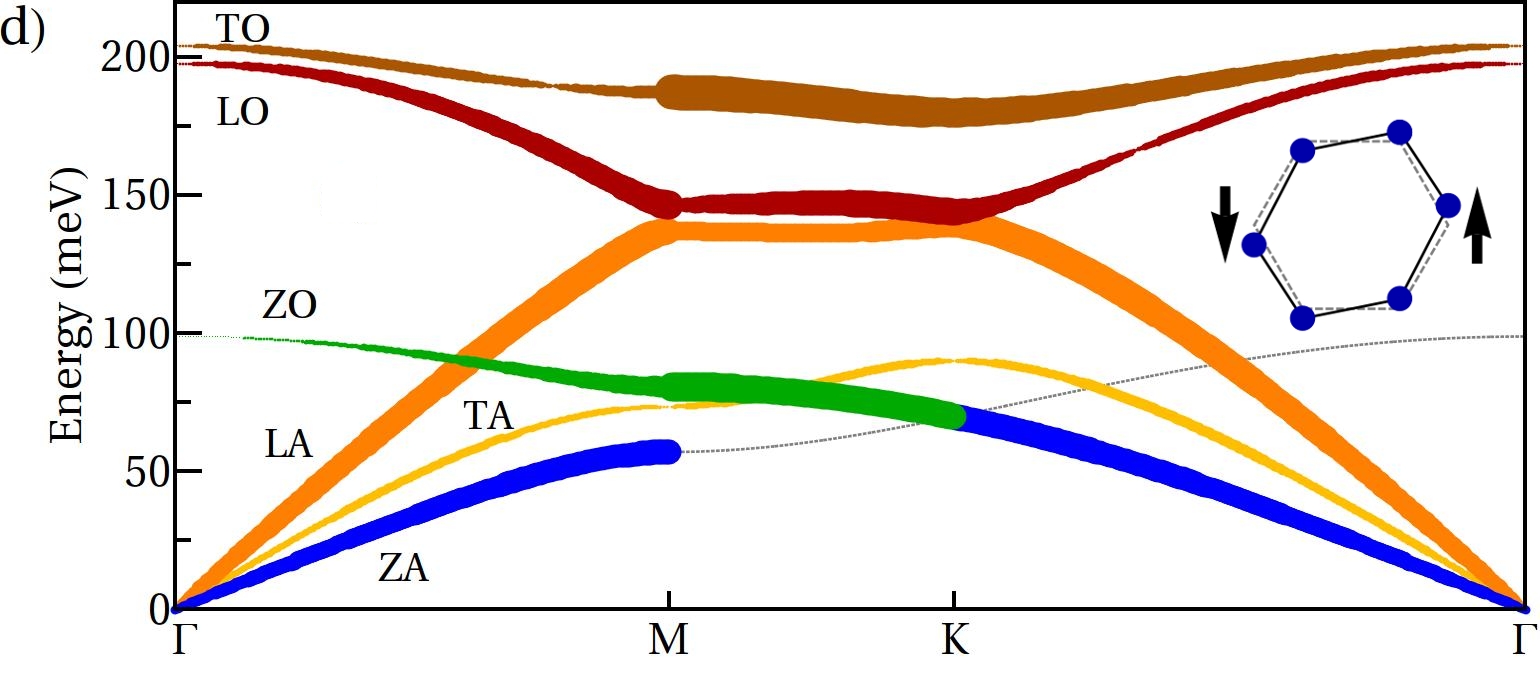
In the second case, we consider a sample under constant strain , which could be either substrate induced or externally applied. The uniaxial components of strain , break the point group symmetry to (which still has a and reflection) while the shear component breaks it to which has no reflections. Therefore, shear strain will remove selection rules completely. Strain can be introduced in our model by modifying the bond stretching couplings. If the relative change in nearest neighbor distance due to strain is , the change in the bond stretching constant can be parametrized as , with . In this model is related to the Gruneisen parameter as , with as estimated from the Raman splitting of the G mode under strain Mohiuddin et al. (2009). The bond stretching energy in the presence of strain is modified to
| (6) |
The EELS matrix element for these two types of strains is shown in Figs. 4c-d. Again, both perturbations change the spectrum, but only the second one changes the intensity pattern: since shear strain breaks both reflections, all in-plane modes become visible.
VI Discussion
One of the conclusions of this work is that the selection rules usually quoted in the literature have been often incomplete or misunderstood. The confusion may originate from the fact that in the EELS literature, surface phonons are classified into two groups: sagittal plane (SP) phonons have polarization parallel to the sagittal (or scattering) plane, while shear horizontal (SH) phonons have polarization perpendicular to this plane Kress and de Wette . This classification has sometimes lead to a formulation of selection rules that states that SH modes are not observed in planar scattering. This formulation can be misleading because it implicitly assumes that the polarization behaves as a vector under reflections. When this is the case, SH modes are indeed odd under reflection, while SP modes are even. For example, this happens for the in-plane acoustic modes which transform as an representation. One may thus identify the LA as SP and the TA as SH, which is not observed. However, this formulation is incorrect for an arbitrary representation, for example for the optical in-plane phonons (LO,TO), which transform as . In the direction, the TO has polarization perpendicular to the scattering plane and is thus labeled as SHO Aizawa et al. (1992); Oshima et al. (1988), SH* Siebentritt et al. (1997); Shikin et al. (1998); Farías et al. (1999, 2000) or simply SH Aizawa et al. (1990a, b). Nevertheless it is even under reflection and has no selection rule, contrary to common belief Siebentritt et al. (1997). In the same way, the LO is SP (parallel to the plane) but is odd under reflection and should be absent. When only one of the LO/TO phonons is observed, the label that should be assigned to it is thus TO (or SH).
A similar situation occurs for the ZO (a representation) in the direction, which is polarized in the direction (also SP) but is odd under reflection. This selection rule has been missed until now because this mode is not a shear mode, but as Fig. 3 clearly shows, this mode is not observed on graphene on Ru(0001) in , but is visibly observed in . This is also consistent with intensity data available in the literature. The ZO in is almost invisible in graphene on Ni(111) when intercalated with AgFarías et al. (1999), but is clearly visible along on graphene on BC3 Yanagisawa et al. (2005).
Our analysis of selection rules also sheds light on previous EELS experiments performed on graphite. The surface phonons of graphite in the (001) direction are very similar to those of graphene because of the weak interlayer coupling. However, the planar symmetry group is actually because the graphene layers are stacked in an alternating AB sequence: only one sublattice has carbon atoms below. As a result, the reflection is broken and there are no selection rules in the direction. The only remaining selection rules apply to the TA and TO phonons in the direction. The same analysis would apply to any related material with symmetry such as BNRokuta et al. (1997) or siliceneVogt et al. (2012); Fleurence et al. (2012).
The EELS spectra of graphite in Ref. Wilkes et al., 1987 were recorded in a sample containing domains with random azimuthal direction. For this reason, the TA mode was clearly observed. However, in Ref. Oshima et al., 1988 both TO and TA were observed in the direction, which is inconsistent with the selection rule. As noted in Ref. Wirtz and Rubio, 2004, in this experiment TA and ZO cross before reaching the point, which is also inconsistent with both theory calculations and with more recent X-ray dataMohr et al. (2007) where there is a clear TA/ZO crossing at . Since the crossing in Ref. Oshima et al., 1988 occurs approximately at the same as the crossing in the and the selection rule is being violated, it appears possible that the measurement may have contained several orientational domains as well. It would be interesting to see new experimental data to shed light on this issue.
In summary, in this work we have provided the selection rules for the measurement of the phonon spectrum of the honeycomb lattice in planar scattering, showing that some selection rules have been overlooked. These are however manifest in our HREELS spectra in graphene on Ru(0001). We hope that our work will serve as a guideline for further experiments measuring phonon dispersions in graphene or other materials.
Acknowledgements.
The authors would like to thank Davide Campi for helpful discussions. F. de J. acknowledges support from the “Programa Nacional de Movilidad de Recursos Humanos” (Spanish MECD). This work was supported in part by the NSF through Grant No. DMR-1005035 and by the US-Israel Binational Science Foundation.VII Appendix
VII.1 Experimental methods
Experiments were carried out in an ultra-high vacuum (UHV) chamber operating at a base pressure of 510-11 mbar. The sample was a single crystal of Ru(0001) which was cleaned by repeated cycles of ion sputtering and annealing at 1300 K. Surface cleanliness and order were checked using Auger electron spectroscopy (AES) and low-energy electron diffraction (LEED) measurements, respectively.
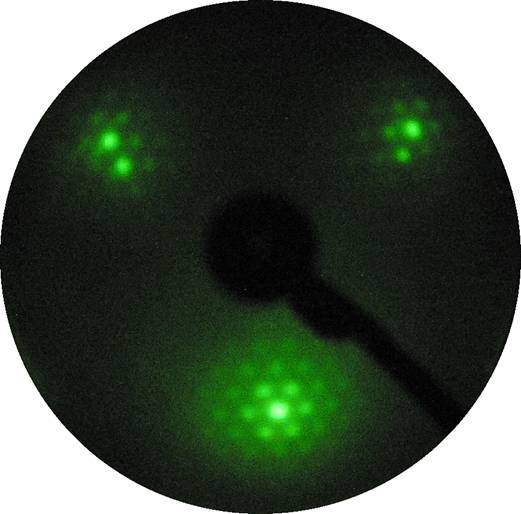
Graphene was obtained by dosing ethylene onto the clean Ru(0001) substrate held at 1150 K. The MLG was reached upon an exposure of 310-8 mbar for ten minutes (24 L. 1 L=1.3310-6 mbar·s). After removing the C2H4 gas from the chamber the temperature was held at 1150 K for further 60 seconds. The attained LEED pattern (shown in Fig. 5) is essentially similar to those previously reported Marchini et al. (2007); Pan et al. (2009). Around each spot of the (1x1), additional spots due to the (12x12) reconstruction of the overlayer were revealed. Only MLG has been observed in the whole sample, as in STM and He atom scattering experiments by Politano et al. reported elsewhere Borca et al. (2010); Politano et al. (2011).
HREELS experiments were performed by using an electron energy loss spectrometer (Delta 0.5, SPECS). The energy resolution of the spectrometer was degraded to 4 meV so as to increase the signal-to-noise ratio of loss peaks. Dispersion of the loss peaks, i.e., Eloss(q||), was measured by moving the analyzer while keeping the sample and the monochromator in a fixed position. To measure the dispersion relation, values for the parameters EI, impinging energy and , the incident angle, were chosen so as to obtain the highest signal-to-noise ratio. The primary beam energy used for the dispersion, EI=20 eV, provided, in fact, the best compromise among surface sensitivity, the highest cross-section for mode excitation and q|| resolution. As
the parallel momentum transfer depends on EI, Eloss, and according to
where Eloss is the energy loss and is the electron scattering angle Rocca (1995). Accordingly, the integration window in reciprocal space is Politano et al. (2009)
where is the angular acceptance of the apparatus Politano et al. (2008) (0.5o in our case). For the investigated range of q||, the indeterminacy has been found to range from 0.005 (near ) to 0.022 (for higher momenta). To obtain the intensities of phonon modes, a polynomial background was subtracted from each spectrum. All measurements were made at room temperature.
VII.2 Appendix B: Strain and Gruneisen parameter
The effect of strain was described in the main text as a change in the bond stretching constant, which becomes neighbor dependent . The parameter is related to the Gruneisen parameter for the optical phonon at , defined asHuang et al. (2009); Mohiuddin et al. (2009)
| (7) |
where . To show this relation, consider the total energy in the presence of strain
| (8) |
where we assume that does not change. The equation of motion is
| (9) |
with the frequency of the optical mode, and we have set for the optical mode. Neglecting compared with , specifying to uniaxial strain and taking the square root for small strain we obtain
| (10) |
which gives .
References
- (1) W. Kress and F. W. de Wette, Surface Phonons (Springer).
- Benedek et al. (1994) G. Benedek, F. Hofmann, P. Ruggerone, G. Onida, and L. Miglio, Surf. Sci. Rep. 20, 1 (1994).
- Politano et al. (2012) A. Politano, A. R. Marino, D. Campi, D. Farías, R. Miranda, and G. Chiarello, Carbon 50, 4903 (2012).
- Piscanec et al. (2004) S. Piscanec, M. Lazzeri, F. Mauri, A. C. Ferrari, and J. Robertson, Phys. Rev. Lett. 93, 185503 (2004).
- Benedek et al. (2001) G. Benedek, E. Hulpke, and W. Steinhögl, Phys. Rev. Lett. 87, 027201 (2001).
- Talwar et al. (1981) D. N. Talwar, M. Vandevyver, K. Kunc, and M. Zigone, Phys. Rev. B 24, 741 (1981).
- (7) H. Ibach and D. Mills, Electron Energy Loss Spectroscopy and Surface Vibrations (Academic Press).
- Szeftel (1985) J. Szeftel, Surf. Sci. 152, 797 (1985).
- Balden et al. (1992) M. Balden, S. Lehwald, H. Ibach, A. Ormeci, and D. L. Mills, Phys. Rev. B 46, 4172 (1992).
- Doak (1990) R. Doak, Superlattices Microstruct. 7, 201 (1990).
- Yater et al. (1990) J. Yater, A. Kulkarni, F. de Wette, and J. Erskine, J. Electron Spectros. Rel. Phenom. 54, 395 (1990).
- Erskine et al. (1990) J. L. Erskine, E. Jeong, J. Yater, Y. Chen, and S. Y. Tong, J. Vac. Sci. Technol. A 8, 2649 (1990).
- Glebov et al. (1996) A. Glebov, W. Silvestri, J. P. Toennies, G. Benedek, and J. G. Skofronick, Phys. Rev. B 54, 17866 (1996).
- Note (1) A selection rule for a particular high-symmetry line can be avoided altogether by choosing to measure in a replica of this line that does not map onto itself under the corresponding reflection. This measurement usually requires two independent rotations of the sample and is far less common.
- Aizawa et al. (1992) T. Aizawa, Y. Hwang, W. Hayami, R. Souda, S. Otani, and Y. Ishizawa, Surf. Sci. 260, 311 (1992).
- Siebentritt et al. (1997) S. Siebentritt, R. Pues, K.-H. Rieder, and A. M. Shikin, Phys. Rev. B 55, 7927 (1997).
- Oshima et al. (1988) C. Oshima, T. Aizawa, R. Souda, Y. Ishizawa, and Y. Sumiyoshi, Solid State Commun. 65, 1601 (1988).
- Aizawa et al. (1990a) T. Aizawa, R. Souda, S. Otani, Y. Ishizawa, and C. Oshima, Phys. Rev. B 42, 11469 (1990a).
- Tilley et al. (1995) B. Tilley, T. Aizawa, R. Souda, W. Hayami, S. Otani, and Y. Ishizawa, Solid State Commun. 94, 685 (1995).
- Farías et al. (2000) D. Farías, K. Rieder, A. Shikin, V. Adamchuk, T. Tanaka, and C. Oshima, Surf. Sci. 454, 437 (2000).
- Shikin et al. (1999) A. Shikin, D. Farías, V. Adamchuk, and K.-H. Rieder, Surf. Sci. 424, 155 (1999).
- Aizawa et al. (1990b) T. Aizawa, R. Souda, S. Otani, Y. Ishizawa, and C. Oshima, Phys. Rev. Lett. 64, 768 (1990b).
- Yanagisawa et al. (2005) H. Yanagisawa, T. Tanaka, Y. Ishida, M. Matsue, E. Rokuta, S. Otani, and C. Oshima, Surf. Interface Anal. 37, 133 (2005).
- Aizawa et al. (1990c) T. Aizawa, R. Souda, Y. Ishizawa, H. Hirano, T. Yamada, K. ichi Tanaka, and C. Oshima, Surf. Sci. 237, 194 (1990c).
- Farías et al. (1999) D. Farías, A. M. Shikin, K.-H. Rieder, and Y. S. Dedkov, J. Phys.: Condens. Matter 11, 8453 (1999).
- Hwang et al. (1992) Y. Hwang, T. Aizawa, W. Hayami, S. Otani, Y. Ishizawa, and S.-J. Park, Surf. Sci. 271, 299 (1992).
- Yanagisawa et al. (2004) H. Yanagisawa, T. Tanaka, Y. Ishida, M. Matsue, E. Rokuta, S. Otani, and C. Oshima, Phys. Rev. Lett. 93, 177003 (2004).
- Aizawa et al. (2001) T. Aizawa, W. Hayami, and S. Otani, Phys. Rev. B 65, 024303 (2001).
- Li et al. (1980) C. H. Li, S. Y. Tong, and D. L. Mills, Phys. Rev. B 21, 3057 (1980).
- Marchini et al. (2007) S. Marchini, S. Günther, and J. Wintterlin, Phys. Rev. B 76, 075429 (2007).
- Martoccia et al. (2008) D. Martoccia, P. R. Willmott, T. Brugger, M. Björck, S. Günther, C. M. Schlepütz, A. Cervellino, S. A. Pauli, B. D. Patterson, S. Marchini, J. Wintterlin, W. Moritz, and T. Greber, Phys. Rev. Lett. 101, 126102 (2008).
- Vázquez de Parga et al. (2008) A. L. Vázquez de Parga, F. Calleja, B. Borca, M. C. G. Passeggi, J. J. Hinarejos, F. Guinea, and R. Miranda, Phys. Rev. Lett. 100, 056807 (2008).
- Pan et al. (2009) Y. Pan, H. Zhang, D. Shi, J. Sun, S. Du, F. Liu, and H.-j. Gao, Adv. Mater. 21, 2777 (2009).
- Borca et al. (2010) B. Borca, S. Barja, M. Garnica, M. Minniti, A. Politano, J. M. Rodriguez-García, J. J. Hinarejos, D. Farías, A. L. Vázquez de Parga, and R. Miranda, New J. Phys. 12, 093018 (2010).
- Martoccia et al. (2010) D. Martoccia, M. Björck, C. M. Schlepütz, T. Brugger, S. A. Pauli, B. D. Patterson, T. Greber, and P. R. Willmott, New J. Phys. 12, 043028 (2010).
- Moritz et al. (2010) W. Moritz, B. Wang, M.-L. Bocquet, T. Brugger, T. Greber, J. Wintterlin, and S. Günther, Phys. Rev. Lett. 104, 136102 (2010).
- Politano et al. (2011) A. Politano, B. Borca, M. Minniti, J. J. Hinarejos, A. L. Vázquez de Parga, D. Farías, and R. Miranda, Phys. Rev. B 84, 035450 (2011).
- Günther et al. (2011) S. Günther, S. Dänhardt, B. Wang, M.-L. Bocquet, S. Schmitt, and J. Wintterlin, Nanolett. 11, 1895 (2011).
- Armbrust et al. (2012) N. Armbrust, J. Güdde, P. Jakob, and U. Höfer, Phys. Rev. Lett. 108, 056801 (2012).
- Politano et al. (2013) A. Politano, D. Campi, V. Formoso, and G. Chiarello, Phys. Chem. Chem. Phys. 15, 11356 (2013).
- Loginova et al. (2009) E. Loginova, S. Nie, K. Thürmer, N. C. Bartelt, and K. F. McCarty, Phys. Rev. B 80, 085430 (2009).
- Cazzanelli et al. (2013) E. Cazzanelli, T. Caruso, M. Castriota, A. Marino, A. Politano, G. Chiarello, M. Giarola, and G. Mariotto, J. Raman Spectrosc. 44, 1393 (2013).
- Note (2) The phonon dispersion along was recorded with 32 eV. However, the cross-section of phonon modes in this scattering conditions became so weak that a comparison with data acquired by using 20 eV would not be meaningful.
- Falkovsky (2008) L. Falkovsky, Phys. Lett. A 372, 5189 (2008).
- Viola Kusminskiy et al. (2009) S. Viola Kusminskiy, D. K. Campbell, and A. H. Castro Neto, Phys. Rev. B 80, 035401 (2009).
- Wirtz and Rubio (2004) L. Wirtz and A. Rubio, Solid State Commun. 131, 141 (2004).
- Lazzeri et al. (2008) M. Lazzeri, C. Attaccalite, L. Wirtz, and F. Mauri, Phys. Rev. B 78, 081406 (2008).
- Allard and Wirtz (2010) A. Allard and L. Wirtz, Nano lett. 10, 4335 (2010).
- Mohiuddin et al. (2009) T. M. G. Mohiuddin, A. Lombardo, R. R. Nair, A. Bonetti, G. Savini, R. Jalil, N. Bonini, D. M. Basko, C. Galiotis, N. Marzari, K. S. Novoselov, A. K. Geim, and A. C. Ferrari, Phys. Rev. B 79, 205433 (2009).
- Shikin et al. (1998) A. Shikin, D. Farias, and K. Rieder, EPL 44, 44 (1998).
- Rokuta et al. (1997) E. Rokuta, Y. Hasegawa, K. Suzuki, Y. Gamou, C. Oshima, and A. Nagashima, Phys. Rev. Lett. 79, 4609 (1997).
- Vogt et al. (2012) P. Vogt, P. De Padova, C. Quaresima, J. Avila, E. Frantzeskakis, M. C. Asensio, A. Resta, B. Ealet, and G. Le Lay, Phys. Rev. Lett. 108, 155501 (2012).
- Fleurence et al. (2012) A. Fleurence, R. Friedlein, T. Ozaki, H. Kawai, Y. Wang, and Y. Yamada-Takamura, Phys. Rev. Lett. 108, 245501 (2012).
- Wilkes et al. (1987) J. Wilkes, R. Palmer, and R. Willis, J. Electron. Spectrosc. Relat. Phenom. 44, 355 (1987).
- Mohr et al. (2007) M. Mohr, J. Maultzsch, E. Dobardžić, S. Reich, I. Milošević, M. Damnjanović, A. Bosak, M. Krisch, and C. Thomsen, Phys. Rev. B 76, 035439 (2007).
- Rocca (1995) M. Rocca, Surf. Sci. Rep. 22, 1 (1995).
- Politano et al. (2009) A. Politano, V. Formoso, E. Colavita, and G. Chiarello, Phys. Rev. B 79, 045426 (2009).
- Politano et al. (2008) A. Politano, V. Formoso, and G. Chiarello, Plasmonics 3, 165 (2008).
- Huang et al. (2009) M. Huang, H. Yan, C. Chen, D. Song, T. F. Heinz, and J. Hone, Proc. Natl. Acad. Sci. 106, 7304 (2009).