Circumnuclear Molecular Gas in Megamaser Disk Galaxies NGC 4388 and NGC 1194
Abstract
We explore the warm molecular and ionized gas in the centers of two megamaser disk galaxies using band spectroscopy. Our ultimate goal is to determine how gas is funneled onto the accretion disk, here traced by megamaser spots on sub-pc scales. We present NIR IFU data with a resolution of pc for two galaxies: NGC 4388 with VLT/SINFONI and NGC 1194 with Keck/OSIRIS+AO. The high spatial resolution and rich spectral diagnostics allow us to study both the stellar and gas kinematics as well as gas excitation on scales only an order of magnitude larger than the maser disk. We find a drop in the stellar velocity dispersion in the inner pc of NGC 4388, a common signature of a dynamically cold central component seen in many active nuclei. We also see evidence for non-circular gas motions in the molecular hydrogen on similar scales, with the gas kinematics on 100-pc scales aligned with the megamaser disk. In contrast, the high ionization lines and Br trace outflow along the 100 pc-scale jet. In NGC 1194, the continuum from the accreting black hole is very strong, making it difficult to measure robust two-dimensional kinematics, but the spatial distribution and line ratios of the molecular hydrogen and Br have consistent properties between the two galaxies.
1 Introduction
Active galactic nuclei pose a fundamental problem – how does rotationally dominated gas on kpc scales lose orders of magnitude in angular momentum to fall onto an accretion disk on AU scales (e.g., Balick & Heckman, 1982). We do not know the mechanism that dissipates angular momentum and allows gas to accrete. There are no shortage of ideas, including major or minor mergers (e.g., Dahari, 1985; Mihos & Hernquist, 1994; Kuo et al., 2008; Ellison et al., 2011), bars and bars within bars (e.g., Shlosman et al., 1990; Maciejewski et al., 2002; Hunt et al., 2008; Kim et al., 2012), and nuclear spirals (Englmaier & Shlosman, 2000; Maciejewski, 2004; Martini et al., 2003; Ann & Thakur, 2005) as perhaps indicated by dust lanes (Simões Lopes et al., 2007; Martini et al., 2013). Even looking directly at molecular gas kinematics on pc scales in active galaxies, it is very hard to find clear evidence for the true driver of nuclear activity (Haan et al., 2009; García-Burillo et al., 2009; García-Burillo & Combes, 2012; Combes et al., 2014).
Thanks to the advent of near-infrared integral-field spectrographs (NIR IFU hereafter), there has been significant progress in understanding gas flows in the centers of active galactic nuclei (AGN) in recent years. The NIR observations allow us to penetrate gas and dust in the active nuclei, and, in conjunction with adaptive optics, to probe very near to the nucleus. In some nearby cases, inflows are directly observed along circumnuclear spirals in ionized gas on pc scales (e.g., Storchi-Bergmann et al., 2007; Davies et al., 2009; van de Ven & Fathi, 2010; Riffel et al., 2013b). Furthermore, there are intriguing hints of kinematic differences in the nuclei of local Seyfert galaxies. For example, Dumas et al. (2007) suggest that the ionized gas in the disks of Seyfert galaxies (i.e., outside of the narrow-line region or NLR) is more kinematically disturbed than the gas in a control inactive sample. Hicks et al. (2013) also report that Seyfert galaxies have more concentrated stellar luminosity profiles, lower stellar velocity dispersions, and elevated H2 1-0 S(1) emission within pc relative to an inactive subsample.
In this work, we specifically focus on megamaser disk galaxies. In these special systems, luminous water megamasers at 22 GHz trace a geometrically thin molecular disk on sub-pc scales in orbit around the central BH (e.g., Miyoshi et al., 1995; Herrnstein et al., 2005; Lo, 2005; Kuo et al., 2011). The megamaser spots show near perfect Keplerian rotation in many (e.g., Kuo et al., 2011), but not all cases (e.g., Lodato & Bertin, 2003; Kondratko et al., 2005). Thanks to the Keplerian rotation in the maser disk, we know the BH mass to a few percent, limited in most cases by the distance to the galaxy (e.g., Kuo et al., 2011). Direct geometric distances have also been derived by measuring the accelerations of the systemic masers for the few best cases (Herrnstein et al., 2005; Reid et al., 2009, 2013; Kuo et al., 2013).
In addition to distance measurements and BH masses, the megamaser disk reveals the spin axis of the accretion disk on sub-pc scales. To get the long path lengths required for masing, the disk must be virtually edge-on; we thus typically know the orientation of the disk on sub-pc scales to within a couple of degrees (Kuo et al., 2011). We have already found that the spin axis of the megamaser disk aligns with the jet on pc scales, while the spin axis of the disk does not appear to align with flattened disk-like structures on pc scales identified in HST imaging (Greene et al., 2013). In this paper, we explore the use of NIR IFU data to define the gas flows on pc scales, for comparison with the megamaser disk. We currently have NIR IFU observations of the centers of two galaxies in the Kuo et al. sample: NGC 4388 and NGC 1194. These two are the only two megamaser disk galaxies with published BH masses where we can come close to resolving the gravitational sphere of influence, in the former case because the galaxy is nearby (in Virgo) and in the latter because the BH is the most massive known with a maser disk (Kuo et al., 2011).
2 Observations and Data Reduction
![[Uncaptioned image]](/html/1405.1430/assets/x1.png)
Example fits to the stellar continuum of NGC 4388 using pPXF and stellar templates observed with SINFONI. The top spectrum is the sum of pixels within the AGN-dominated central point source, showing the strong nonthermal AGN continuum. The bottom spectrum represents the sum of all high S/N pixels from the galaxy disk excluding the central point source, which we fitted to derive a best-fit average template, as described in §4.1. The relatively blue spectrum here is dominated by stellar light. Due to tellurice residuals, we truncate the spectra at the blue end for display purposes.
2.1 NGC 4388 with SINFONI
We observed NGC 4388 with SINFONI under program 386.B-0244A111We are grateful to the ESO astronomers who obtained the data presented in this paper in service mode operations at La Silla Paranal Observatory. on the Very Large Telescope (Eisenhauer et al., 2003; Bonnet et al., 2004) on April 12 & May 5 2011 in natural seeing conditions and in service mode. We have been awarded time to observe this galaxy at two spatial resolutions, the higher one involving assistance of the Adaptive Optics system (AO), however to date these observations are only partially carried out. Thus, in this paper we present the lower spatial resolution data set that covers a wider field of view.
Our observations cover the central 8″ 8″, with a spatial sampling of 0125 0250. We used the -band grating (1.95 – 2.45 m) that gives a spectral resolution R3500 (6.2 Å FWHM, as measured on sky lines). For the observations we used standard near-IR nodding techniques. Observing blocks consisted of a sequence of object and sky frames (OSOOSOOSOOSOO). Each individual integration was 300 sec and the sky fields were offset by 240″ to the North and East. Science frames were dithered by 03 in order to reject bad pixels. There were two observing blocks, with a total on-source integration time of 100 min, and 40 min in total on sky frames. Additionally, after each observing block and at a similar airmass, we observed a B dwarf star to act as a telluric star.
We used the ESO SINFONI pipeline v2.3.3 to perform the basic data reduction on each observing block, consisting of 10 object and 4 sky exposures. In brief, the pipeline extracts the raw data, applies distortion, bad pixel and flat-field corrections and wavelength calibration, and stores the combined sky-subtracted spectra from one observing block in a 3-dimensional data cube. The final pixel size is .
We reduced the telluric stars in the same way as the science frames. For each telluric star we extracted a one-dimensional spectrum, removed the hydrogen Brackett absorption line at m after fitting it with a Lorentzian profile, and divided the star spectrum by a black body spectrum with the same temperature as the star. The last step in preparing the telluric spectrum was to apply small shifts in the spectral direction (0.05 pixels or 0.123 Å) and scalings to minimize the residuals of the telluric features. To do this, we extracted a central one-dimensional spectrum from each science data cube and cross-correlated and fitted it with the corresponding telluric spectrum. We derived the wavelength-dependent correction required to match the continuum shape of the telluric star (without an absolute zero-point). Thus, when we divided each individual spaxel in the six galaxy data cubes by the corresponding best-fitting telluric spectrum, we also obtained a relative flux calibration.
Based on the seeing monitor, during our observations the seeing varied from ″ for the first observation, and between ″ for the second observation. Note that the seeing monitor takes measurements at 5000 Å, thus our seeing is typically better than this. From the standard stars (taken at the end) we measure a FWHM of 08 for the first observation and 05 for the second. We aligned the two OBs with integer offsets and summed them; all analysis was done on this final summed data cube.
2.2 NGC 1194 with OSIRIS
We observed NGC 1194 using the IFU OH-Suppressing Infrared Imaging Spectrograph (OSIRIS Larkin et al., 2006) assisted by the laser-guide star adaptive optics system (Wizinowich et al., 2006; van Dam et al., 2006) on the 10m Keck II telescope. The data were taken over the latter two-thirds of a single night on Oct. 19 2011. We observed in the band with the Kbb filter, for a spectral coverage of and a spectral resolution of . We used the spatial scale, and oriented the long axis of the IFU along the major axis of the galaxy at a PA of °. We dithered the galaxy by perpendicular to the long axis of the IFU, both to facilitate bad pixel removal and to slightly increase the field-of-view to .
Unfortunately, the nucleus of NGC 1194 was too faint to use as a tip-tilt star. Thus, we used a nearby (54″) star (ID=0888-0029937; ). Natural seeing conditions varied over the night from to . From our final science data cube we find that the PSF core had a FWHM of as measured from the galaxy core. We also observed a telluric standard (A0V) star approximately once per unit change in airmass. Finally, we interleaved sky and object observations with an Object-Sky-Object pattern, spending 600s per sky and object exposure. We acquired a total of 170 min on source.
We followed closely the reductions outlined in Walsh et al. (2012), using the OSIRIS data reduction pipeline (v2.3) made available by the instrument team222http://irlab.astro.ucla.edu/osiris/pipeline.html. We repeat salient details here for completeness. The pipeline handles sky subtraction, cosmic-ray removal, glitch identification, spectral extraction into a data cube, wavelength calibration, atmospheric dispersion correction, and telluric correction using an A0V star. We experimented with a scaled sky subtraction method from Davies (2007), but did not find substantial improvements from the direct method. Finally, we determined the centroid of each exposure by hand, applied these sub-pixel offsets, and averaged all cubes into our final data cube.
3 Spectral Analysis
Here we describe our analysis procedure for the NGC 4388-SINFONI data cube in detail, highlighting any differences in analysis with the NGC 1194 data cube.
3.1 Stellar Kinematics
We use the direct-pixel–fitting code pPXF of (Cappellari & Emsellem, 2004) to fit the stellar continuum. To achieve adequate signal-to-noise (S/N) we use the Voronoi binning scheme of Cappellari & Copin (2003), which determines contiguous bins with uniform S/N, in this case S/N per pixel. The SINFONI pipeline does not return an error array, and so the noise is determined empirically from line-free regions of the spectrum as the variance in the spectrum once large outliers are clipped. In the case of the OSIRIS data, we use the per-pixel error array generated by the reduction pipeline. We then fit the coadded spectrum corresponding to each bin with a weighted combination of stellar templates. Each template is shifted to the systemic velocity of the galaxy and convolved with a Gaussian line-broadening function. A polynomial of fourth order is added to account for nonthermal continuum from the AGN, and potentially flux calibration errors as well. Example fits are shown in Figure 2.
The measurement uncertainties in both velocity and velocity dispersion are determined with Monte Carlo simulations. In the case of the NGC 1194 data, the data reduction software generates an error array. However, for the NGC 4388 data, we use residuals from the best fit (with the emission lines removed) to determine the average sigma. We create 100 perturbed input spectra assuming Gaussian errors in the spectra. We then refit these 100 artificial spectra. The uncertainty in each parameter is calculated as the values encompassing 68% of the trials.
We experimented with a number of fitting regions, including a fit to the bandhead only (, short), a fit to the full region (, full), and an intermediate region (, best). We found that the first fit delivered reliable velocity dispersions, but unstable radial velocities because of the narrow wavelength range, and because the bandhead at is often filled in by [Ca VIII] emission. Fits to the full spectral region suffered from telluric residuals at . The just-right spectral region was therefore the third, intermediate case. The median errors on the velocities are km s-1 for the best, short, and full regions respectively, while the median errors on the dispersion measurements are km s-1. In all cases, we masked high-EW emission lines, including the H2 lines at and also [Si VI], He I, Br, and [Ca VIII].
To bracket uncertainties caused by template mismatch, we utilize two stellar template libraries in fitting the SINFONI data. One is a library of stars observed with SINFONI using the same observational set-up. In this case, no correction for instrumental resolution is required. The native SINFONI templates range from K4III to M5III (plus a K4.5V star) (Lyubenova et al., 2008). As a check, we also use the stellar template library of Wallace & Hinkle (1996), observed at higher spectral resolution. We use this second template set only to test our sensitivity to template mismatch. The Wallace templates cover a wider range in spectral type, including KM supergiants and KM giants. We discuss the stellar template fits to the NGC 4388 data in detail in S 4.1.
Even with different templates, we find good agreement in the two sets of stellar velocity dispersion measurements. Taking as the answer based on the SINFONI templates and as the same for the Wallace templates, we find (where the latter number is simply the standard deviation in this ratio). We find that the two measurements agree within 20% (i.e., within the observational uncertainties) and we find no significant systematic offset. In the case of the OSIRIS data, our primary fitting uses a single K5III star, which provides an acceptable fit to our moderate S/N data.
3.2 Finding the Center
We do not a priori know the location of the black hole, or the precise photometric center of the galaxy. We could use the continuum to determine the photometric center, but then we would be sensitive to obscuration, which is still significant in the NIR (see Figure 1). Instead, we use the equivalent width of the CO bandhead to determine where the active nucleus peaks (Davies et al., 2004, 2007). We use the index definition from Oliva et al. (1995): the index band is , with a continuum band centered on 2.2900 and a width of 0.0003 , and we also followed their prescription to correct for velocity dispersion although this correction is negligible (see also Förster Schreiber, 2000). These authors show that in the absence of an active nucleus, star-forming galaxies have a very uniform CO EW. A declining CO EW towards the galaxy center can be attributed to infill by the nonthermal continuum from the accreting black hole. We show an example in §4.1.
We create an AGN continuum map by taking the CO EW at the edge of the cube (EW=9.5Å in NGC 4388, consistent with stellar-population models) and assuming that all dilution further inwards results from the AGN, such that continuum (AGN) = [total continuum] [1 - CO EW/CO Outer]. The photometric center of the continuum map falls South of the CO EW center. The optical narrow-line region cone is only visible to the South (§4.2.3), so it is sensible that the continuum centroid should be shifted towards the low-reddening side of the disk. The best-fit center also agrees within less than a pixel with the peak H2 and Br emission, although these latter are not as well defined. We will use this position as the center of the cube throughout. In the case of NGC 1194, the CO-derived and photo-centers agree within ″.
3.3 Emission Line Fitting
While Voronoi binning is very useful to create uniform continuum S/N (e.g., Cid Fernandes et al., 2013), it is more difficult to apply to patchy emission-line maps, where by using large bins we may smear out interesting features in the line emission maps. We therefore create a second data cube using a pixel smoothing in the outer regions and a pixel binning in the inner ″ region. With this level of binning, we increase the S/N by a factor of two but still maintain multiple pixels across the PSF. We measure the emission lines from this uniformly gridded cube. In the case of NGC 4388, because we have such high S/N in the continuum, we again perform continuum-subtraction using pPXF before fitting the emission lines. However, there are no strong stellar absorption features beneath the emission lines of interest, and thus for NGC 1194, where the S/N is poor in the continuum, we simply fit a local continuum value.
We fit each emission line independently. We model the intrinsic line shape as a Gaussian, although we allow for up to two Gaussian components for emission lines with S/N in NGC 4388. Particularly in the Br and [Si VI] lines, the line shapes are often non-Gaussian and warrant a second component. In of cases within the central the S/N is sufficient to warrant a two-component fit. We calculate the non-parametric FWHM from the sum of Gaussian components, and from that value a corresponding line dispersion. We also experimented with an empirically determined line-broadening function by fitting a Gauss-Hermite model to the strong sky emission lines, which caused only very minor changes in our fits. We derive errors on all the fitted parameters by fitting 100 artificial spectra that are created as a sum of the original spectrum and a Gaussian random noise array generated from the extracted errors.
4 NGC 4388
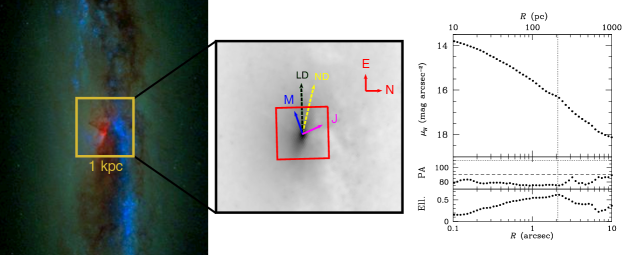
NGC 4388 is an SBb galaxy at a distance of 19 Mpc (Kuo et al., 2011), corresponding to a physical resolution of pc given our seeing. The galaxy magnitude is mag, with a B/T based on fits to the SDSS data (Greene et al., 2010). We show an HST/WFC3 image combining F336W (broad ), F435W (broad ), and F814W (broad ) in Figure 1. With a photometric P.A. of 90°, the galaxy is very nearly edge-on, which is not true for the majority of the megamaser disk galaxies (Braatz et al., 1997; Greenhill et al., 2009). The inclination determined from the large-scale kinematics is 78° (Veilleux et al., 1999a), and the systemic velocity from the same study is km s-1. The gas kinematics show an isophotal twist on arcmin scales, that Veilleux et al. (1999a) successfully model as a bar within the inner 1.5 kpc, with a P.A. of 100° on the sky. The bar is also apparent in the photometry as a boxy bulge.
NGC 4388 is well-known as a galaxy that is falling into the Virgo cluster (Yasuda et al., 1997). Gas is being stripped from the galaxy, as evidenced by an H I and ionized gas tail (Ford et al., 1971; Phillips & Malin, 1982; Pogge, 1988; Corbin et al., 1988; Petitjean & Durret, 1993; Veilleux et al., 1999b; Stoklasová et al., 2009). There is even a detection of the photoionized gas in the soft X-rays (Iwasawa et al., 2003).
We are interested in the center of NGC 4388, in particular because of the megamaser disk on sub-pc scales (Braatz et al., 2004). Based on the megamaser rotation curve, the BH mass is found to be (Kuo et al., 2011). Combined with the bolometric luminosity estimate from Vasudevan et al. (2013), the Eddington ratio is , which is in very rough agreement with our estimate from the [O III] luminosity (Greene et al., 2010). Like most megamaser disk galaxies (Greenhill et al., 2008), the active galactic nucleus (AGN) in NGC 4388 is Compton thick and quite bright in hard X-rays (e.g., Hanson et al., 1990; Takano & Koyama, 1991; Iwasawa et al., 1997; Forster et al., 1999; Fedorova et al., 2011). NGC 4388 has also been seen to change state in the X-ray (Elvis et al., 2004), switching from being Compton thick to Compton thin. Weak broad H has also been reported at the galaxy center (Filippenko & Sargent, 1985; Ho et al., 1997).
4.1 Stellar Kinematics
We first examine stellar rotation and dispersion. We clearly see rotation within our pc field of view that aligns with the disk on larger scales. Following Cappellari et al. (2009), we first use pPXF to fit the average spectrum over all data, excluding a 05 radius around the AGN (Figure 2). In the fiducial fits, we do not fit higher-order Gauss-Hermite moments. We will examine and in §4.1.1 below. All of our default fits employ the SINFONI templates. From this high S/N spectrum we can derive the best-fit spectral mix, which may be degenerate in lower S/N individual spectra. Based on our fit to this average spectrum, we find a dispersion of km s-1, which compares well with our previous measurement of km s-1 (Ho et al., 2009; Greene et al., 2010). The best-fit template is composed of 50% K4/5III, 38% K7III, and 12% M5 II/III stars.
We then fit spatially resolved spectra across the cube, using Voronoi binning to ensure comparable S/N in all bins. We both allow the mix of templates to be a free parameter, and use the best-fit mixture from the high S/N fit to the entire cube. The latter fit has the advantage that by decreasing the number of free parameters, we increase the fitting stability in the AGN-dominated region (Cappellari et al., 2009). However, we find excellent agreement between the two measurements, with the scatter in their fractional difference being only 9%. Thus, we will present results with the stellar templates allowed to vary.
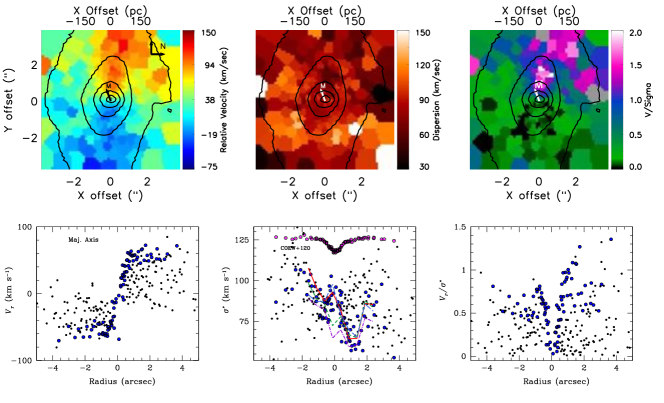
The fitted rotation and dispersion fields are shown in Figure 2. Our best-fit systemic velocity is km s-1, consistent with the measurement of Veilleux et al. (1999a). We do find a systematic difference of km s-1 between the absolute velocity derived when we use the SINFONI stellar templates and that from the Wallace et al. templates. We are not sure of the origin of this difference; it is possible that the SINFONI template stars, while all at rest relative to each other, have not been shifted to a rest velocity. We thus quote an uncertainty of km s-1 in the systemic velocity.
4.1.1 Stellar Rotation Curve
To derive the rotation curve we use the kinemetry formalism of Krajnović et al. (2006), which is similar to ellipse fitting of photometry, but operates on both even and odd moments of the kinematic field. The kinematics are modeled using a sixth order expansion along ellipses with the position angle and ellipticity as free parameters. We show the resulting rotation curve in Figure 4.1.1, along with the best-fit ellipse PA, ellipticity , and the amplitudes of the higher-order terms that encapsulate deviations from simple circular rotation.
We clearly measure rotation in the stellar kinematics, with a maximum amplitude of km s-1. The stellar rotation axis of 90° is aligned with the major axis of the kpc-scale disk. On larger scales, Stoklasová et al. (2009) measure a stellar rotation of 60-80 km s-1 out to ″ ( pc), consistent with ours, which then appears to fall slightly at larger radius.
With km s-1 beyond 1″(100 pc), we find a . Overall, the stars are dispersion-dominated, but we see signs of kinematic components apart from just a bulge. Firstly, for a , we would expect an ellipticity of for an isotropic oblate rotator (Binney, 1978), rather than the that we observe in the isophotes (Figure 1). Secondly, within a radius of the dispersion field actually drops (although the decrement is more pronounced on the East side of the disk). On the same scale, we see a jump in velocity, PA, and ellipticity likely signaling a transition from an inner disk to more bulge-dominated kinematics. Thirdly, we also detect a disk-like structure in the inner 100 pc in the HST/WFC3 F160W image (Figure 1). The nuclear disk appears to have PA°, misaligned with the large-scale disk, and a size very similar to the drop region. We detect this same disk component in more detailed two-dimensional fitting of the HST+ground-based data (R. Läsker et al. in preparation).
The most likely explanation of these observations is that there is a disk within ″ (180 pc) embedded in the larger-scale bulge/bar. Only on unextincted sight lines are the kinematics dominated by the disk component, while on heavily extincted sight lines we are seeing the kinematics in the bulge/bar. The falling rotation curve outside 400 pc may also reflect the increasing dominance of the bulge/bar on larger scales. As additional confirmation of this picture, we refit the stellar kinematics and measure the higher-order Gauss-Hermite moments and (e.g., van der Marel & Franx, 1993). Although individual measurements have only S/N , we do find the classic anti-correlation between and that points to the superposition of a bulge and disk, as seen both in simulations (Hoffman et al., 2009) and data (e.g., Bender et al., 1994; Krajnović et al., 2008; Seth, 2010). We also find two additional hints that the band extinction is higher to the West. Firstly, we find a significantly redder continuum slope to the West side of the disk, corresponding to a differential mag assuming a Cardelli et al. (1989) reddening law. Secondly, we clearly see a dip in the H2 emission on the same scale on the West side of the disk (see §4.2).
Next we will ensure that the drop is real and not an artifact of our fitting procedure.
![[Uncaptioned image]](/html/1405.1430/assets/x4.png)
Properties of the velocity maps as derived from kinemetry (Krajnović et al., 2006) from both the stars (red circles) and and the H2 gas (blue squares). We show, in order from top to bottom, the rotation curve, the position angle (measured East of North), the ellipticity , and the higher-order deviations from a circular velocity pattern. Our kinematic PA is consistent with previous measurements. For reference, we also show the PA of the large-scale disk (90°) and of the megamaser disk (107°). We see that most of the interesting deviations occur within the inner ″ (200 pc). The gas is considerably colder than the stars, with a rotation amplitude of 150 vs 60 km s-1 respectively.
4.1.2 Stellar Dispersion Drop
The AGN is the primary source of uncertainty in our modeling of in the galaxy center. Contamination from the non-thermal central source dilutes the stellar signal, and is degenerate with (e.g., Greene & Ho, 2006). First, we look at the S/N of the dispersion measurements as a function of position. We find that the S/N is always except within of the AGN. This first test suggests that our measurements at ″ (100 pc) should not be dominated by the AGN. Next, we re-run pPXF, but instead of fitting the continuum with the default polynomial of order 4, we only allow a first or second-order polynomial (Figure 2). While it is clear that, particularly in the case of the first-order polynomial, we achieve very poor fits to the nuclear region (), we still find significant evidence for an asymmetric drop. We then return to the Wallace templates (rather than our default SINFONI templates) and try restricting the template set to K dwarfs. We find the same result. Finally, we examine our fits with the template fixed to the mixture derived from the high S/N fit described in §4.1. In all of these cases, although the dispersion profile within 05 is not well determined, we recover the drop on 1″ (100 pc) scales. We therefore conclude that the observed drop is real and that the asymmetry results from patchy reddening. Although in general the North side of the disk is more heavily extincted (§4.2.3), there are also dust lanes extending to the South, which are apparently preferentially affecting the West side of the 100-pc–scale disk.
A falling dispersion towards the center of megamaser disk galaxies is not unexpected. These so-called “-drops” are common both in spiral (e.g, Bottema, 1993; Emsellem et al., 2001; Falcón-Barroso et al., 2006; Peletier et al., 2007; Riffel et al., 2011), and in early-type galaxies (Pinkney et al., 2003; Emsellem et al., 2004; Lyubenova et al., 2008), in the latter often associated with nuclear star clusters (Lyubenova et al., 2013). The typical scale is pc, and the most likely explanation for the falling dispersion is that the galaxy harbors a gas disk that is currently or was recently forming stars. These bright, dynamically cold stars dominate the central dispersion and cause to fall. In fact, NGC 2273, one of the nearer megamaser disk galaxies, has a dramatic drop that coincides with a known disk in the inner pc (Erwin & Sparke, 2003; Barbosa et al., 2006). Hicks et al. (2013) suggest that low central dispersions are more common in active galaxies.
If the drop is caused by a young stellar disk, then we might also expect to see younger stars coinciding with the lower stellar velocity dispersion. We create a median spectrum over the region with km s-1, and rerun pPXF to investigate the mixture of stellar populations using the Wallace templates, which cover a wider range of spectral type. While there is a slight preference for more supergiant light in the region of the drop, we do not find a significant difference in best-fit spectral type as a function of region. The CO EW profile is also quite symmetric and has reached its asymptotic values already in the drop region (Figure 2). With a larger spiral sample, Peletier et al. (2007) also find similar stellar population ages inside and outside of the drop regions.
4.1.3 Stellar Kinematics Summary
We propose that the observed stellar kinematics are the superposition of three distinct components. On kpc-scales, the galaxy disk has PA°. Within our 300 pc aperture, the kinematics are dominated by the hotter bulge/bar (Veilleux et al., 1999a). Based on the highest measurements within the cube, presumably occurring where dust obscuration is highest, we measure km s-1 in the bulge/bar. Then, within the inner 100 pc, we see evidence in both the kinematics and the NIR isophotes for a nuclear disk component at a PA°, misaligned by ° from the large-scale disk and with a . Finally, on pc scales, there is a masing disk at PA°, which is misaligned not only from the kpc-scale disk, but also by ° from the nuclear stellar disk (Greene et al., 2013).
4.2 Gas Fluxes and Kinematics
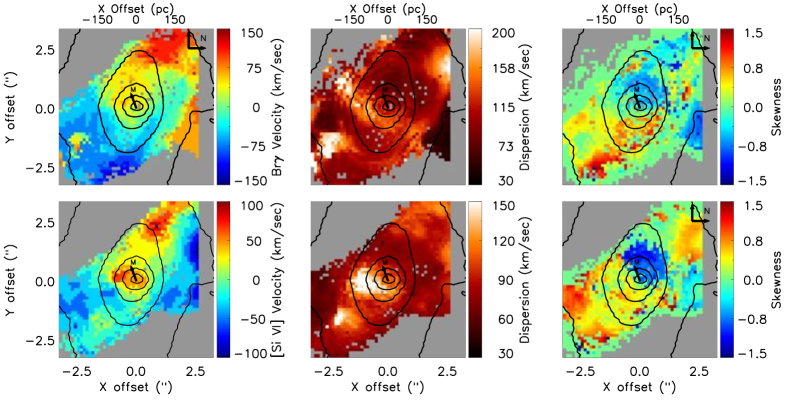
With a best-fit stellar rotation field in hand, we turn to the gas kinematics. We will examine three transitions: H2 1-0S(1), Br, and the coronal line [Si VI]. We note that the [Ca VIII] line, also coronal, has been used to trace the NLR (e.g., Storchi-Bergmann et al., 2009), but is blended with the CO bandhead. Thus we choose to focus on the [Si VI] line here. The two-dimensional velocity and line-ratio fields will provide information about the origins and excitation mechanisms of each transition. The fluxes that we present are the integrated flux from our one or two Gaussian models as described in §3.3. We calculate the FWHM non-parametrically from the sum of both components, and the dispersions are simply calculated as FWHM/2.35. We also measure and present the skewness of the lines, which encapsulates the asymmetry in the two-component fits.
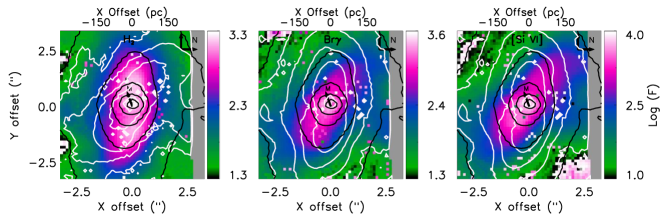
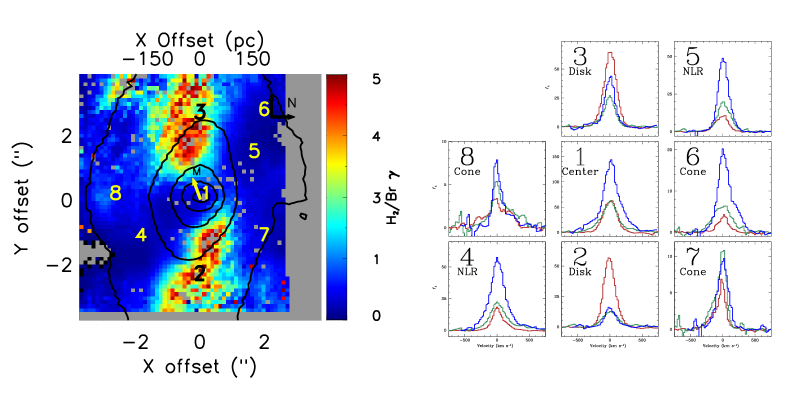
In Figure 3, we show the distribution of fluxes in the H2, Br, and [Si VI] emission lines, while in Figures 4, 4.2.1, and 5, we summarize their kinematics. We see that the overall morphology of the H2 follows the stellar continuum, and is even more flattened than the stellar distribution, suggesting that the emission arises from the nuclear disk. Furthermore, close inspection reveals that the H2 emission is asymmetric, being considerably brighter towards the East. The brighter side of the H2 disk is coincident with the observed drop in the stellar distribution; we can directly see the extinction of the H2 in the region where the drop is also extincted. In contrast, the high-ionization lines are oriented at PA, aligned with the jet on similar scales, and also with the [O III] emission that traces the narrow-line region (NLR; Fig. 4.2.1). The Br mostly follows the high-ionization lines (Fig. 5). Their light distribution strongly suggests that their emission arises in front of the disk in projection, since the [Si VI] is actually brighter towards the West (similar to the [O III]). Based partially on these flux distributions, as well as the kinematics and line ratios presented below, we will suggest that the H2 mainly traces star formation in the nuclear disk, while Br and [Si VI] trace the NLR (e.g., Rodríguez-Ardila et al., 2004; Storchi-Bergmann et al., 2009; Riffel & Storchi-Bergmann, 2011; Mazzalay et al., 2013b).
4.2.1 Molecular Hydrogen Kinematics
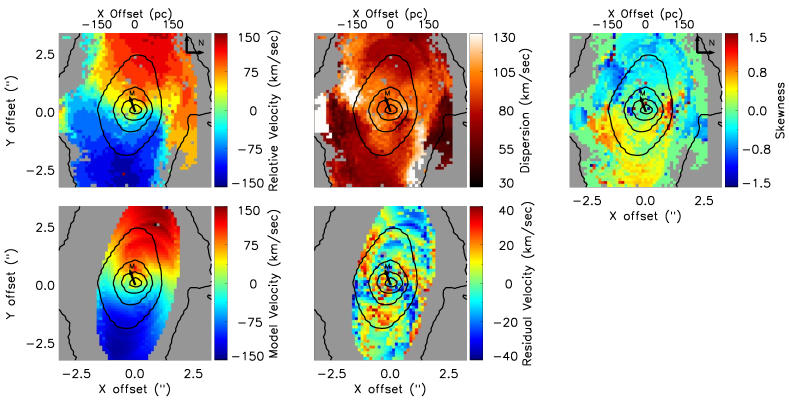
We focus first on the H2 kinematics (Figure 4). As with the stellar kinematics above, we fit the H2 velocity field using kinemetry. The best-fit rotation curve, PA, and eccentricity are shown in blue in Figure 4.1.1. With V/, the gas is considerably colder than the stars, but we are not seeing pure rotation. The rotation field shows an -shaped kink. The twist is apparent as a discontinuity in the H2 ellipticity and PA in the rotation profiles at (150 pc), a similar radius to the changing stellar kinematics. In the skewness map, along the high-dispersion kink, we see a tendency for red asymmetry, which is plausibly attributed to the superposition of two velocity components. Interior to the twist, the kinematic PA of the gas on pc scales appears to align with the megamaser disk. Thus, it is possible that whatever mechanism causes this kink is responsible for supplying material on pc scales.
On the same scales, we find a two-armed spiral in the dispersion map, with an inner PA . We find a corresponding three-arm spiral pattern in the residual map by subtracting the best-fit rotation model from the observed velocity field. To interpret these trends, we recall that any mode perturbation can cause deviations in the even velocity moments, including density and dispersion, and due to geometry (and ) deviations in the odd velocity moments (e.g., Canzian, 1993). We propose a few mechanisms that may explain these kinematic properties.
First, in the study by van de Ven & Fathi (2010) of the inner region of NGC 1097, similar signatures were explained as the result of a two-arm nuclear spiral in the disk plane (see also Davies et al., 2009). Given that the nuclear disk in NGC4388 is nearly edge-on, such a co-planar spiral density wave seems unlikely. The second possibility is that we are seeing the superposition of the kpc-scale disk and the 100 pc nuclear disk that we saw in the stellar kinematics. However, the gas PA, while approximately aligned with the maser disk on sub-pc scales, does not align with the stellar disk of PA°. The final possibility is that the twist we observe here is related to the kink from the bar observed on kpc scales (e.g., Veilleux et al., 1999a). Only with our upcoming AO observations can we address the pc gas kinematics definitively, and hopefully help determine what is driving the gas inward towards the AGN.
![[Uncaptioned image]](/html/1405.1430/assets/x7.png)
We show the correspondence between the optical and NIR high-ionization lines. In greyscale we show the [Si VI] emission map over the same field-of-view displayed in all other maps above. We use [Si VI] to represent the purest and highest S/N view of the NLR as traced by emission lines within our cube. The narrow-band [O III] Å image from HST is overlaid as red contours. The scale bar indicates (pc). The blue arrows schematically indicate the edges of the ionization cone that we see hints of in the [Si VI] and Br maps. The radio emission as imaged by Falcke et al. (1998) follows the ionized gas closely on these scales, and then opens into a plume to the North-East (off of this image).
4.2.2 Molecular Hydrogen Excitation
The H2 shows very regular rotation along the orientation of the large-scale galaxy disk outside of the inner 1″ (100 pc). Additional information is encoded in the ratios of H2 to Br (Figure 6), and ratios of different H2 transitions (Figure 7). Typically, in the hard ionizing field of the NLR, the ratio of H2 to Br takes a value H2/Br, while it is in star-forming regions (Larkin et al., 1998; Moorwood & Oliva, 1990; Rodríguez-Ardila et al., 2004, 2005; Riffel et al., 2010). Finally, in dense spiral arms, even higher ratios of H2/Br are observed. Riffel et al. (2013a) suggest that the increased H2 emission arises from the higher gas densities within spiral arms (see also Riffel et al., 2013b). NGC 4388 obeys these trends in general (Figure 6). Along the disk, the H2 is strong, and the ratio has values , as is commonly seen in spiral arms, while in the galaxy center, the line ratio ranges from H2/Br, values common for Seyfert galaxies.
The only surprising region lies off the disk along a ° angle East of North above and below the galaxy plane, where the Br emission is strongest. Here, the H2/Br ratio is very low . Such low ratios are reportedly associated with star-forming regions (e.g., Moorwood & Oliva, 1994; Larkin et al., 1998; Rodríguez-Ardila et al., 2004, 2005; Riffel et al., 2013a). However, in this case, the Br and [Si VI] morphologies match both the orientation of the radio jet and the NLR traced by [O III] in the optical. Thus, we suggest that the low H2 relative to Br in these regions is instead due to very low densities of the NLR (Dors et al., 2012).
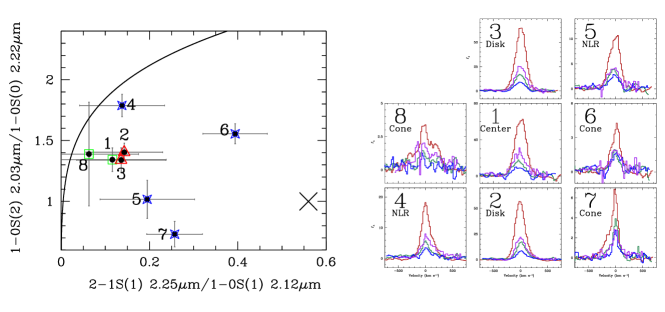
We now construct spectra in characteristic regions to examine both the H2 line ratios and the line kinematics. We select regions of the map based on the H2/Br line ratio and construct high S/N spectra from the continuum-subtracted cubes. Region 1 is the center, defined as all pixels with CO EWÅ that lie within of the center. We extract two regions in the disk (H2/Br; regions 2 & 3) and two regions in the NLR (H2/Br; regions 4 & 5). Finally, we sample gas that falls beyond the main galaxy and overlaps with the [O III] ionization cone (region 8), as well as two regions North of the disk, towards the Northern radio lobe (regions 6 & 7). The extracted spectra for the strong transitions (H2, Br, and [Si VI]) from each region are shown in Figure 6, the spectra from different H2 transitions are shown in Figure 7, and measured properties from these spectra are presented in Table 1. Because we fit the lines using an instrumental profile, the linewidths are naturally corrected for instrumental resolution. Each line is fitted independently. In fact, as shown in Figure 7, the centroids and line shapes for the different transitions can differ, particularly for regions in the NLR ionization cone.
For each region, we can ask about the excitation mechanisms of the H2. There are two ways to excite the warm H2: thermal processes or fluorescence via UV radiation. The thermal processes that can in principle heat the gas include shocks, X-ray emission, or heating by UV emission.
The predicted line ratios of various H2 transitions provide diagnostics of the primary excitation mechanism. Specifically, if fluorescence dominates the excitation, then the ratio of H2 2-1S(1) 2.25/1-0S(1) 2.12 is expected to be while the 1-0S(2) 2.03/1-0S(0) 2.22 ratio is expected to be (Black & van Dishoeck, 1987). We show this pair of ratios and the expectation for pure thermal emission as the solid line, while the region dominated by fluorescence is shown schematically with the large X at the lower right in Figure 7. There is room for some UV fluorescence, but these line ratios suggest that the bulk of the excitation is thermal. Similar conclusions have been drawn for larger samples of Seyfert galaxies (Veilleux et al., 1997; Quillen et al., 1999; Rigopoulou et al., 2002).
Our excitation diagram is constructed for the integrated line profile but, in fact the line ratio is clearly a function of velocity, particularly for the line emission arising from the NLR ionization cones. We do not have sufficient S/N to construct line ratios for the line core and line wings separately, but these different line shapes are pointing to different dominant excitation mechanisms in the line wings. Higher S/N is needed to quantitatively examine velocity-dependent line ratios.
We are still left with the question of which thermal process dominates the excitation. Previous work has drawn various conclusions, with Veilleux et al. (1997) for instance favoring shocks in outflows, Quillen et al. (1999) favoring a mix of processes including emission from photo-dissociation regions, Storchi-Bergmann et al. (2009) favoring X-ray heating or shocks, and so on. Recent papers have favored X-ray heating in the vicinity of an AGN (e.g., Hicks et al., 2009). However, in our case, the fact that there is little H2 coming the NLR while the bulk of the H2 emission on these scales follows the morphology of the starlight (Figure 3) strongly suggests that the H2 is predominantly excited by stellar processes (e.g., UV radiation and/or shocks from supernovas) rather than the AGN.
4.2.3 The Narrow-line Region
Bridging the gap between the accretion flow on pc scales and the large-scale ionized gas outflow, we can examine the ionized gas emission on 100 pc scales. In this region, the radio emission is complex, extends predominantly North-South (perpendicular to the disk) and contains two unresolved peaks and a more diffuse “bubble” to the north (Stone et al., 1988; Hummel & Saikia, 1991). Falcke et al. (1998) show that the Northern radio source is coincident with the optical nucleus, while the Southern radio knot is coincident with a bright region of ionized gas seen in [O III], strongly suggesting a jet-ISM interaction. High-ionization gas is present to the South of the nucleus in our data cubes as well. Previous near-infrared spectra (e.g., Winge et al., 2000; Knop et al., 2001; Imanishi, 2003) show extended H2 coincident with the galaxy disk, and high-ionization gas emission from Br and [Si VI] coincident with the nucleus and ionization cone. With our high spatial resolution and three-dimensional coverage, we can robustly disentangle the disk and NLR kinematics.
The Br and [Si VI] emission lines show similar spatial distributions that parallel the NLR emission seen in [O III] (Figures 3 and 4.2.1). Their emission is distributed at an angle of PA, tracing the general orientation of the radio jet seen on similar scales (Falcke et al., 1998). The ionization cone seen in [O III] continues to the South-West beyond the SINFONI field-of-view (Pogge, 1988; Veilleux et al., 1999a; Stoklasová et al., 2009), and is filled with radio plasma (Falcke et al., 1998). To the North, beyond our field of view, the jet opens into another wide angle fan. It is likely that the Southern ionization cone sits in front of the galaxy disk, while the Northern one (which we can see in this map and in the radio but not in the optical) is extincted by the galaxy disk.
![[Uncaptioned image]](/html/1405.1430/assets/x11.png)
In Figure 5, we show the velocity and FWHM fields for Br and [Si VI]. Both the morphology and the kinematics differ from that seen in the H2. Specifically, we do not see coherent rotation in either transition. The skewness plots are also interesting. In both transitions we see redshifted gas towards the South-West and blue-shifted gas towards the North-East. Our interpretation is that we are seeing bulk motion of the gas along the jet, which apparently points towards us to the North and away from us to the South of the galaxy disk. In both cases we are probing the region of the NLR where the jet has “broken-out” of the galaxy disk. The higher velocity gas is moving along the walls of the bicone, as accelerated by the jet (e.g., Storchi-Bergmann et al., 2010; Riffel et al., 2013b).
The coadded spectra from different regions reveal a similar story. In the disk regions (regions 2 & 3), where there is little emission from the NLR gas, we find strong and narrow H2, and weak, but rather broad, Br and [Si VI]. In the NLR regions (4 & 5), Br and [Si VI] are stronger and slightly broader than in the disk regions. The line profiles are most complex at positions 6, 7, and 8, regions that are also bright in [O III] emission and where we see the strongest skewness in the lines (Fig. 4.2.1 & Fig. 5). We clearly see the red wing in the spectra from regions 6 & 8, and the corresponding blue wing in the spectra from region 7.
![[Uncaptioned image]](/html/1405.1430/assets/x12.png)
Three-band HST/WFC3 image of NGC 1194 including F336W, F438W, and F814W (Greene et al., 2013). As indicated, North is up and East to the left in this image. We show the OSIRIS field of view (″ or 900340 pc) with the yellow box, oriented along the major axis of the galaxy as our observation was.
Again in line with recent work (e.g., Storchi-Bergmann et al., 2010), we find that the high-ionization lines and hydrogen recombination lines trace “feedback”. That is, the emission in these lines is dominated by extraplanar gas likely excited by the AGN, and perhaps entrained by the nuclear jet. This NLR emission is also aligned roughly perpendicular to the megamaser disk on sub-pc scales.
Finally, we ask whether there is a broad component to the Br, since Ho et al. (1997) detect a weak broad base to the H line in NGC 4388, with a FWHM of 3900 km s-1. Within the central nuclear point source emission, all the species have lines that are broad and symmetric (Table 1). However, we find no evidence for a true broad-line component in Br. Instead, all the transitions have comparable widths. Neither Veilleux et al. (1997) nor Lutz et al. (2002) detect broad emission from Br or Br in their long-slit NIR spectra either. Perhaps the broad component detected in the optical is scattered broad emission rather than directly transmitted light (e.g., Liu et al., 2009).
5 NGC 1194
NGC 1194 is an inclined (°) S0 galaxy at Mpc. The galaxy PA is 145°, and we aligned the IFU along the major axis. Given our PSF of , we are resolving 40 pc scales with our AO-assisted observations. Thus we achieve very comparable spatial resolution to the NGC 4388 observations presented above. We have detected the large-scale disk in NGC 1194 in H I, and find a circular velocity of km s-1 (Sun et al., 2013). From SDSS imaging, we find a bulge-to-total ratio of (Greene et al., 2010).
The BH in NGC 1194 has a mass of , one of the most massive in the megamaser disk sample. NGC 1194 is in the IRAS-selected 12 sample (Rush et al., 1993), and in the SWIFT/BAT 22 month sample (Tueller et al., 2010). It has a hard X-ray luminosity of log from 14-195 keV, but is not Compton thick (Georgantopoulos et al., 2011). Depending on the bolometric correction, the Eddington ratio is (Vasudevan et al., 2009), considerably lower than NGC 4388. The galaxy was also part of the HST/[O III] snapshot survey of Schmitt et al. (2003). They find extended [O III] emission with an extent of 700 pc along the major axis of the galaxy, and 470 pc along the minor axis. The nucleus was detected in FIRST and at 8.4 GHz by Thean et al. (2000), with a flux density of 0.9 mJy, and an upper limit on the radio core size of 52 pc.
![[Uncaptioned image]](/html/1405.1430/assets/x13.png)
Three spectra from the NGC 1194 data cube; due to telluric residuals we do not show the region from µm. From top to bottom, we show spectra within the inner 018 (50 pc), between 02 and 05 (140 pc), and then 05 to 1″ (140-280 pc). Going from the center outward, we can see the continuum change from AGN-dominated to galaxy-dominated, the H2 equivalent width increase, and the [Ca VIII] line strength decrease. These trends are qualitatively similar to NGC 4388 above, although we have far less detailed spatial information. In red, we overplot our best-fit composite stellar template over the restricted region that we fit, and as above the strong emission lines were masked in the fit.
There are three existing band spectra of NGC 1194 (Sosa-Brito et al., 2001; Imanishi & Alonso-Herrero, 2004; Davies et al., 2005) on ″ (900 pc) scales. In all cases the CO bandhead is detected, but the line emission is very weak. Davies et al. do not detect Br, but marginally detect the H2 line.
5.1 Stellar and Gas Kinematics
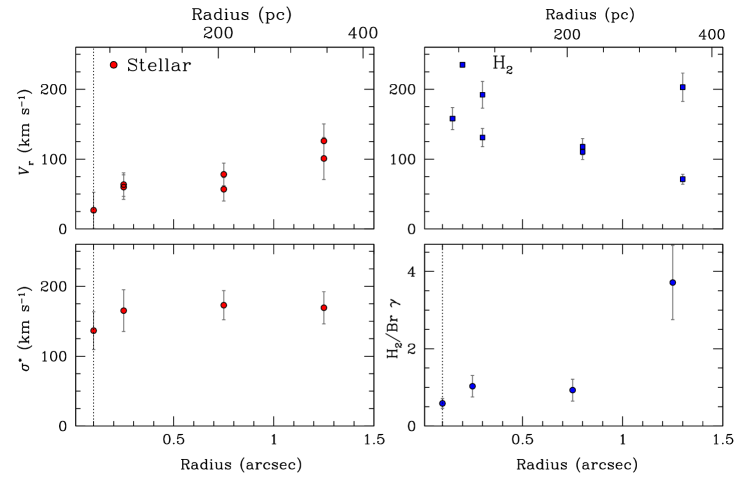
Due to the heavy binning required to achieve adequate S/N, we cannot derive much spatially resolved information for this galaxy. In terms of the gas, the Br and [Si VI] flux distributions are very centrally concentrated, with a FWHM that is consistent with that of the continuum. The H2 emission is clearly extended, but the distribution is quite patchy. We therefore construct average spectra in annuli, taking the central spectrum within the FWHM of the PSF (016). Then we construct six spectra with outer radii of 05, 1″, and 15 (140, 280, and 420 pc) respectively, on either side of the galaxy minor axis. Three examples of these spectra are shown in Figure 5.
We can measure the radial velocities and stellar velocity dispersions reliably in these coadded spectra, using pPXF as above. We do find that the stars are rotating, with an amplitude of km s-1 (Figure 8). In contrast, we do not detect a clear rotation curve in the gas. Instead, the velocities are very asymmetric. Asymmetric velocities in high-ionization lines are often attributed to outflow (e.g., Müller-Sánchez et al., 2011; Mazzalay et al., 2013a), and are sometimes seen in H2 as well (e.g., Riffel & Storchi-Bergmann, 2011), which may be the explanation here. Another possibility is that we are seeing spiral arms or some other non-axisymmetric gas distribution that is unrelated to the AGN. Our limited S/N prevents us from distinguishing between these cases. Neither the [Si VI] nor the Br is spatially extended enough to measure reliable velocities beyond the central region.
5.2 Gas Emission Lines
All of the gas emission lines fluxes are weak, and the intrinsic luminosities are also low. It is perhaps not surprising that this S0 galaxy is gas poor compared to NGC 4388 above, based simply on their respective morphology. On the other hand, the center of NGC 1194 is quite dusty, so there must be some associated gas, and indeed we detect atomic hydrogen in this galaxy on large scales (Sun et al., 2013). The strongest gas emission comes from the high-ionization [Si VI] line, but as mentioned above it is only marginally spatially resolved. Thus, we suspect that the emission from this transition and Br emerge from the inner NLR. In contrast, the H2 is clearly spatially resolved. In analogy with NGC 4388 above, these different gas morphologies may be suggesting that the H2 is excited by both the AGN and stellar processes. We also measure the spatially resolved ratio of H2/Br, and find that the ratio is lowest in the galaxy center (having AGN-like values) and then rises outward, perhaps indicating an increased contribution to the H2 from stellar processes. These line ratios may suggest that the asymmetric velocities we observe in the H2 are due to non-circular motions in the inner regions of the galaxy (e.g., spiral arms) rather than outflow.
6 Summary
We have analyzed integral-field band observations of two megamaser disk galaxies. Our data probe pc scales in both galaxies, and thus allow us to study the distributions of stars and gas at the centers of these galaxies to investigate AGN fueling. In NGC 1194, an S0, there is very little gas, and with our S/N ratios, we cannot say much about the two-dimensional velocity or dispersion fields. However, in NGC 4388 we have excellent S/N, and uncover a variety of interesting features:
-
1.
The stellar velocity field demonstrates well-ordered rotation aligned with the kpc-scale disk. Although there is net rotation in the stars, still they are kinematically hot, with , likely dominated by the dispersion in the kpc-scale bulge.
-
2.
In the inner 1″ (100 pc), we also see evidence for a nuclear disk, offet in PA by 15° from the kpc-scale disk. The evidence includes disky isophotes in the HST/WFC3 F160W image and a distinct drop in stellar velocity dispersion on one side of the putative disk (the other side apparently extincted). Features like this, so called drops, have been seen in the centers of a number of nearby spirals (e.g., Emsellem et al., 2001; Peletier et al., 2007), and there is some hint that they are more common among actively accreting galaxies (Hicks et al., 2013). We note that this 100 pc-scale nuclear disk is misaligned by 35° from the megamaser disk on sub-pc scales.
-
3.
The H2 gas also shows regular kinematics on pc scales, with a well-defined rotation field that is aligned with the kpc-scale disk. With a higher rotation amplitude, the gas is considerably colder than the stars (). We also see a kink in the rotation curve on pc scales. Intriguingly, the H2 rotation within 100 pc appears to align with the megamaser disk. However, the physical origin of the kinematic twist is not yet clear.
-
4.
Based on H2 diagnostic line ratios, we conclude that the molecular hydrogen is mainly excited by thermal processes. Based on the morphology and kinematics of the H2 gas, we speculate that these thermal processes are mostly associated with stars rather than radiation from the AGN (e.g., Storchi-Bergmann et al., 2010; Riffel & Storchi-Bergmann, 2011).
-
5.
In contrast, the Br and high-ionization lines (particularly [Si VI]) have a completely different spatial distribution and kinematics. They trace the inner narrow-line region, also seen on 500 pc scales in [O III], as well as the 100 pc-scale jet.
In the future, we hope to analyze a larger sample of megamaser disk galaxies in this manner. Combined with direct tracers of the cold molecular gas (e.g., with ALMA), as well as high-resolution imaging from HST, we hope to build a multi-phase map of AGN fueling from 100 to 0.1 pc (Greene et al., 2013).
References
- Ann & Thakur (2005) Ann, H. B., & Thakur, P. 2005, ApJ, 620, 197
- Balick & Heckman (1982) Balick, B., & Heckman, T. M. 1982, ARA&A, 20, 431
- Barbosa et al. (2006) Barbosa, F. K. B., Storchi-Bergmann, T., Cid Fernandes, R., Winge, C., & Schmitt, H. 2006, MNRAS, 371, 170
- Bender et al. (1994) Bender, R., Saglia, R. P., & Gerhard, O. E. 1994, MNRAS, 269, 785
- Binney (1978) Binney, J. 1978, MNRAS, 183, 501
- Black & van Dishoeck (1987) Black, J. H., & van Dishoeck, E. F. 1987, ApJ, 322, 412
- Bonnet et al. (2004) Bonnet, H., et al. 2004, in The ESO Messenger, Vol. 117
- Bottema (1993) Bottema, R. 1993, A&A, 275, 16
- Braatz et al. (2004) Braatz, J. A., Henkel, C., Greenhill, L. J., Moran, J. M., & Wilson, A. S. 2004, ApJ, 617, L29
- Braatz et al. (1997) Braatz, J. A., Wilson, A. S., & Henkel, C. 1997, ApJS, 110, 321
- Canzian (1993) Canzian, B. 1993, ApJ, 414, 487
- Cappellari & Copin (2003) Cappellari, M., & Copin, Y. 2003, MNRAS, 342, 345
- Cappellari & Emsellem (2004) Cappellari, M., & Emsellem, E. 2004, PASP, 116, 138
- Cappellari et al. (2009) Cappellari, M., Neumayer, N., Reunanen, J., van der Werf, P. P., de Zeeuw, P. T., & Rix, H.-W. 2009, MNRAS, 394, 660
- Cardelli et al. (1989) Cardelli, J. A., Clayton, G. C., & Mathis, J. S. 1989, ApJ, 345, 245
- Cid Fernandes et al. (2013) Cid Fernandes, R., et al. 2013, A&A, 557, A86
- Combes et al. (2014) Combes, F., et al. 2014, A&A, submitted (arXiv:1401.4120)
- Corbin et al. (1988) Corbin, M. R., Baldwin, J. A., & Wilson, A. S. 1988, ApJ, 334, 584
- Dahari (1985) Dahari, O. 1985, ApJS, 57, 643
- Davies (2007) Davies, R. I. 2007, MNRAS, 375, 1099
- Davies et al. (2009) Davies, R. I., Maciejewski, W., Hicks, E. K. S., Tacconi, L. J., Genzel, R., & Engel, H. 2009, ApJ, 702, 114
- Davies et al. (2007) Davies, R. I., Müller Sánchez, F., Genzel, R., Tacconi, L. J., Hicks, E. K. S., Friedrich, S., & Sternberg, A. 2007, ApJ, 671, 1388
- Davies et al. (2005) Davies, R. I., Sternberg, A., Lehnert, M. D., & Tacconi-Garman, L. E. 2005, ApJ, 633, 105
- Davies et al. (2004) Davies, R. I., Tacconi, L. J., & Genzel, R. 2004, ApJ, 602, 148
- Dors et al. (2012) Dors, Jr., O. L., Riffel, R. A., Cardaci, M. V., Hägele, G. F., Krabbe, Á. C., Pérez-Montero, E., & Rodrigues, I. 2012, MNRAS, 422, 252
- Dumas et al. (2007) Dumas, G., Mundell, C. G., Emsellem, E., & Nagar, N. M. 2007, MNRAS, 379, 1249
- Eisenhauer et al. (2003) Eisenhauer, F., et al. 2003, in Proceedings of the SPIE, ed. M. Iye & A. F. M. Moorwood
- Ellison et al. (2011) Ellison, S. L., Patton, D. R., Mendel, J. T., & Scudder, J. M. 2011, MNRAS, 418, 2043
- Elvis et al. (2004) Elvis, M., Risaliti, G., Nicastro, F., Miller, J. M., Fiore, F., & Puccetti, S. 2004, ApJ, 615, L25
- Emsellem et al. (2001) Emsellem, E., Greusard, D., Combes, F., Friedli, D., Leon, S., Pécontal, E., & Wozniak, H. 2001, A&A, 368, 52
- Emsellem et al. (2004) Emsellem, E., et al. 2004, MNRAS, 352, 721
- Englmaier & Shlosman (2000) Englmaier, P., & Shlosman, I. 2000, ApJ, 528, 677
- Erwin & Sparke (2003) Erwin, P., & Sparke, L. S. 2003, ApJS, 146, 299
- Falcke et al. (1998) Falcke, H., Wilson, A. S., & Simpson, C. 1998, ApJ, 502, 199
- Falcón-Barroso et al. (2006) Falcón-Barroso, J., et al. 2006, MNRAS, 369, 529
- Fedorova et al. (2011) Fedorova, E. V., Beckmann, V., Neronov, A., & Soldi, S. 2011, MNRAS, 417, 1140
- Filippenko & Sargent (1985) Filippenko, A. V., & Sargent, W. L. W. 1985, ApJS, 57, 503
- Ford et al. (1971) Ford, Jr., W. K., Rubin, V. C., & Roberts, M. S. 1971, AJ, 76, 22
- Forster et al. (1999) Forster, K., Leighly, K. M., & Kay, L. E. 1999, ApJ, 523, 521
- Förster Schreiber (2000) Förster Schreiber, N. M. 2000, AJ, 120, 2089
- García-Burillo & Combes (2012) García-Burillo, S., & Combes, F. 2012, Journal of Physics Conference Series, 372, 012050
- García-Burillo et al. (2009) García-Burillo, S., et al. 2009, A&A, 496, 85
- Georgantopoulos et al. (2011) Georgantopoulos, I., et al. 2011, A&A, 534, A23
- Greene & Ho (2006) Greene, J. E., & Ho, L. C. 2006, ApJ, 641, 117
- Greene et al. (2010) Greene, J. E., et al. 2010, ApJ, 721, 26
- Greene et al. (2013) —. 2013, ApJ, 771, 121
- Greenhill et al. (2009) Greenhill, L. J., Kondratko, P. T., Moran, J. M., & Tilak, A. 2009, ApJ, 707, 787
- Greenhill et al. (2008) Greenhill, L. J., Tilak, A., & Madejski, G. 2008, ApJ, 686, L13
- Haan et al. (2009) Haan, S., Schinnerer, E., Emsellem, E., García-Burillo, S., Combes, F., Mundell, C. G., & Rix, H.-W. 2009, ApJ, 692, 1623
- Hanson et al. (1990) Hanson, C. G., Skinner, G. K., Eyles, C. J., & Willmore, A. P. 1990, MNRAS, 242, 262
- Herrnstein et al. (2005) Herrnstein, J. R., Moran, J. M., Greenhill, L. J., & Trotter, A. S. 2005, ApJ, 629, 719
- Hicks et al. (2013) Hicks, E. K. S., Davies, R. I., Maciejewski, W., Emsellem, E., Malkan, M. A., Dumas, G., Müller-Sánchez, F., & Rivers, A. 2013, ApJ, 768, 107
- Hicks et al. (2009) Hicks, E. K. S., Davies, R. I., Malkan, M. A., Genzel, R., Tacconi, L. J., Müller Sánchez, F., & Sternberg, A. 2009, ApJ, 696, 448
- Ho et al. (1997) Ho, L. C., Filippenko, A. V., Sargent, W. L. W., & Peng, C. Y. 1997, ApJS, 112, 391
- Ho et al. (2009) Ho, L. C., Greene, J. E., Filippenko, A. V., & Sargent, W. L. W. 2009, ApJS, 183, 1
- Hoffman et al. (2009) Hoffman, L., Cox, T. J., Dutta, S., & Hernquist, L. 2009, ApJ, 705, 920
- Hummel & Saikia (1991) Hummel, E., & Saikia, D. J. 1991, A&A, 249, 43
- Hunt et al. (2008) Hunt, L. K., et al. 2008, A&A, 482, 133
- Imanishi (2003) Imanishi, M. 2003, ApJ, 599, 918
- Imanishi & Alonso-Herrero (2004) Imanishi, M., & Alonso-Herrero, A. 2004, ApJ, 614, 122
- Iwasawa et al. (1997) Iwasawa, K., Fabian, A. C., Ueno, S., Awaki, H., Fukazawa, Y., Matsushita, K., & Makishima, K. 1997, MNRAS, 285, 683
- Iwasawa et al. (2003) Iwasawa, K., Wilson, A. S., Fabian, A. C., & Young, A. J. 2003, MNRAS, 345, 369
- Kim et al. (2012) Kim, W.-T., Seo, W.-Y., Stone, J. M., Yoon, D., & Teuben, P. J. 2012, ApJ, 747, 60
- Knop et al. (2001) Knop, R. A., Armus, L., Matthews, K., Murphy, T. W., & Soifer, B. T. 2001, AJ, 122, 764
- Kondratko et al. (2005) Kondratko, P. T., Greenhill, L. J., & Moran, J. M. 2005, ApJ, 618, 618
- Krajnović et al. (2006) Krajnović, D., Cappellari, M., de Zeeuw, P. T., & Copin, Y. 2006, MNRAS, 366, 787
- Krajnović et al. (2008) Krajnović, D., et al. 2008, MNRAS, 390, 93
- Kuo et al. (2013) Kuo, C. Y., Braatz, J. A., Reid, M. J., Lo, K. Y., Condon, J. J., Impellizzeri, C. M. V., & Henkel, C. 2013, ApJ, 767, 155
- Kuo et al. (2008) Kuo, C.-Y., Lim, J., Tang, Y.-W., & Ho, P. T. P. 2008, ApJ, 679, 1047
- Kuo et al. (2011) Kuo, C. Y., et al. 2011, ApJ, 727, 20
- Larkin et al. (2006) Larkin, J., et al. 2006, in Society of Photo-Optical Instrumentation Engineers (SPIE) Conference Series, Vol. 6269, Society of Photo-Optical Instrumentation Engineers (SPIE) Conference Series
- Larkin et al. (1998) Larkin, J. E., Armus, L., Knop, R. A., Soifer, B. T., & Matthews, K. 1998, ApJS, 114, 59
- Liu et al. (2009) Liu, X., Zakamska, N. L., Greene, J. E., Strauss, M. A., Krolik, J. H., & Heckman, T. M. 2009, ApJ, 702, 1098
- Lo (2005) Lo, K. Y. 2005, ARA&A, 43, 625
- Lodato & Bertin (2003) Lodato, G., & Bertin, G. 2003, A&A, 398, 517
- Lutz et al. (2002) Lutz, D., Maiolino, R., Moorwood, A. F. M., Netzer, H., Wagner, S. J., Sturm, E., & Genzel, R. 2002, A&A, 396, 439
- Lyubenova et al. (2008) Lyubenova, M., Kuntschner, H., & Silva, D. R. 2008, A&A, 485, 425
- Lyubenova et al. (2013) Lyubenova, M., van den Bosch, R. C. E., Côté, P., Kuntschner, H., van de Ven, G., Ferrarese, L., Jordán, A., Infante, L., & Peng, E. W. 2013, MNRAS, 431, 3364
- Maciejewski (2004) Maciejewski, W. 2004, MNRAS, 354, 892
- Maciejewski et al. (2002) Maciejewski, W., Teuben, P. J., Sparke, L. S., & Stone, J. M. 2002, MNRAS, 329, 502
- Martini et al. (2013) Martini, P., Dicken, D., & Storchi-Bergmann, T. 2013, ApJ, 766, 121
- Martini et al. (2003) Martini, P., Regan, M. W., Mulchaey, J. S., & Pogge, R. W. 2003, ApJ, 589, 774
- Mazzalay et al. (2013a) Mazzalay, X., Rodríguez-Ardila, A., Komossa, S., & McGregor, P. J. 2013a, MNRAS, 430, 2411
- Mazzalay et al. (2013b) Mazzalay, X., et al. 2013b, MNRAS, 428, 2389
- Mihos & Hernquist (1994) Mihos, J. C., & Hernquist, L. 1994, ApJ, 431, L9
- Miyoshi et al. (1995) Miyoshi, M., Moran, J., Herrnstein, J., Greenhill, L., Nakai, N., Diamond, P., & Inoue, M. 1995, Nature, 373, 127
- Moorwood & Oliva (1990) Moorwood, A. F. M., & Oliva, E. 1990, A&A, 239, 78
- Moorwood & Oliva (1994) —. 1994, ApJ, 429, 602
- Müller-Sánchez et al. (2011) Müller-Sánchez, F., Prieto, M. A., Hicks, E. K. S., Vives-Arias, H., Davies, R. I., Malkan, M., Tacconi, L. J., & Genzel, R. 2011, ApJ, 739, 69
- Oliva et al. (1995) Oliva, E., Origlia, L., Kotilainen, J. K., & Moorwood, A. F. M. 1995, A&A, 301, 55
- Peletier et al. (2007) Peletier, R. F., et al. 2007, MNRAS, 379, 445
- Petitjean & Durret (1993) Petitjean, P., & Durret, F. 1993, A&A, 277, 365
- Phillips & Malin (1982) Phillips, M. M., & Malin, D. F. 1982, MNRAS, 199, 905
- Pinkney et al. (2003) Pinkney, J., et al. 2003, ApJ, 596, 903
- Pogge (1988) Pogge, R. W. 1988, ApJ, 332, 702
- Quillen et al. (1999) Quillen, A. C., Alonso-Herrero, A., Rieke, M. J., Rieke, G. H., Ruiz, M., & Kulkarni, V. 1999, ApJ, 527, 696
- Reid et al. (2009) Reid, M. J., Braatz, J. A., Condon, J. J., Greenhill, L. J., Henkel, C., & Lo, K. Y. 2009, ApJ, 695, 287
- Reid et al. (2013) Reid, M. J., Braatz, J. A., Condon, J. J., Lo, K. Y., Kuo, C. Y., Impellizzeri, C. M. V., & Henkel, C. 2013, ApJ, 767, 154
- Riffel et al. (2011) Riffel, R., Riffel, R. A., Ferrari, F., & Storchi-Bergmann, T. 2011, MNRAS, 416, 493
- Riffel et al. (2013a) Riffel, R., Rodríguez-Ardila, A., Aleman, I., Brotherton, M. S., Pastoriza, M. G., Bonatto, C., & Dors, O. L. 2013a, MNRAS, 430, 2002
- Riffel & Storchi-Bergmann (2011) Riffel, R. A., & Storchi-Bergmann, T. 2011, MNRAS, 417, 2752
- Riffel et al. (2010) Riffel, R. A., Storchi-Bergmann, T., & Nagar, N. M. 2010, MNRAS, 404, 166
- Riffel et al. (2013b) Riffel, R. A., Storchi-Bergmann, T., & Winge, C. 2013b, MNRAS, 430, 2249
- Rigopoulou et al. (2002) Rigopoulou, D., Kunze, D., Lutz, D., Genzel, R., & Moorwood, A. F. M. 2002, A&A, 389, 374
- Rodríguez-Ardila et al. (2004) Rodríguez-Ardila, A., Pastoriza, M. G., Viegas, S., Sigut, T. A. A., & Pradhan, A. K. 2004, A&A, 425, 457
- Rodríguez-Ardila et al. (2005) Rodríguez-Ardila, A., Riffel, R., & Pastoriza, M. G. 2005, MNRAS, 364, 1041
- Rush et al. (1993) Rush, B., Malkan, M. A., & Spinoglio, L. 1993, ApJS, 89, 1
- Schmitt et al. (2003) Schmitt, H. R., Donley, J. L., Antonucci, R. R. J., Hutchings, J. B., & Kinney, A. L. 2003, ApJS, 148, 327
- Seth (2010) Seth, A. C. 2010, ApJ, 725, 670
- Shlosman et al. (1990) Shlosman, I., Begelman, M. C., & Frank, J. 1990, Nature, 345, 679
- Simões Lopes et al. (2007) Simões Lopes, R. D., Storchi-Bergmann, T., de Fátima Saraiva, M., & Martini, P. 2007, ApJ, 655, 718
- Sosa-Brito et al. (2001) Sosa-Brito, R. M., Tacconi-Garman, L. E., Lehnert, M. D., & Gallimore, J. F. 2001, ApJS, 136, 61
- Stoklasová et al. (2009) Stoklasová, I., Ferruit, P., Emsellem, E., Jungwiert, B., Pécontal, E., & Sánchez, S. F. 2009, A&A, 500, 1287
- Stone et al. (1988) Stone, Jr., J. L., Wilson, A. S., & Ward, M. J. 1988, ApJ, 330, 105
- Storchi-Bergmann et al. (2007) Storchi-Bergmann, T., Dors, Jr., O. L., Riffel, R. A., Fathi, K., Axon, D. J., Robinson, A., Marconi, A., & Östlin, G. 2007, ApJ, 670, 959
- Storchi-Bergmann et al. (2010) Storchi-Bergmann, T., Lopes, R. D. S., McGregor, P. J., Riffel, R. A., Beck, T., & Martini, P. 2010, MNRAS, 402, 819
- Storchi-Bergmann et al. (2009) Storchi-Bergmann, T., McGregor, P. J., Riffel, R. A., Simões Lopes, R., Beck, T., & Dopita, M. 2009, MNRAS, 394, 1148
- Sun et al. (2013) Sun, A.-L., Greene, J. E., Impellizzeri, C. M. V., Kuo, C.-Y., Braatz, J. A., & Tuttle, S. 2013, ApJ, 778, 47
- Takano & Koyama (1991) Takano, S., & Koyama, K. 1991, PASJ, 43, 1
- Thean et al. (2000) Thean, A., Pedlar, A., Kukula, M. J., Baum, S. A., & O’Dea, C. P. 2000, MNRAS, 314, 573
- Tueller et al. (2010) Tueller, J., et al. 2010, ApJS, 186, 378
- van Dam et al. (2006) van Dam, M. A., et al. 2006, PASP, 118, 310
- van de Ven & Fathi (2010) van de Ven, G., & Fathi, K. 2010, ApJ, 723, 767
- van der Marel & Franx (1993) van der Marel, R. P., & Franx, M. 1993, ApJ, 407, 525
- Vasudevan et al. (2009) Vasudevan, R. V., Mushotzky, R. F., Winter, L. M., & Fabian, A. C. 2009, MNRAS, 399, 1553
- Vasudevan et al. (2013) Vasudevan, R. V., et al. 2013, ApJ, 763, 111
- Veilleux et al. (1999a) Veilleux, S., Bland-Hawthorn, J., & Cecil, G. 1999a, AJ, 118, 2108
- Veilleux et al. (1999b) Veilleux, S., Bland-Hawthorn, J., Cecil, G., Tully, R. B., & Miller, S. T. 1999b, ApJ, 520, 111
- Veilleux et al. (1997) Veilleux, S., Goodrich, R. W., & Hill, G. J. 1997, ApJ, 477, 631
- Wallace & Hinkle (1996) Wallace, L., & Hinkle, K. 1996, ApJS, 107, 312
- Walsh et al. (2012) Walsh, J. L., van den Bosch, R. C. E., Barth, A. J., & Sarzi, M. 2012, ApJ, 753, 79
- Winge et al. (2000) Winge, C., Storchi-Bergmann, T., Ward, M. J., & Wilson, A. S. 2000, MNRAS, 316, 1
- Wizinowich et al. (2006) Wizinowich, P. L., et al. 2006, PASP, 118, 297
- Yasuda et al. (1997) Yasuda, N., Fukugita, M., & Okamura, S. 1997, ApJS, 108, 417