Submitted to Proceedings of the National Academy of Sciences of the United States of America \urlwww.pnas.org/cgi/doi/10.1073/pnas.0709640104 \issuedateIssue Date \issuenumberIssue Number \frutigerboldcondensedat 19.5pt
Submitted to Proceedings of the National Academy of Sciences of the United States of America
Gas Loss in Simulated Galaxies as They Fall into Clusters
Abstract
We use high-resolution cosmological hydrodynamic galaxy formation simulations to gain insights on how galaxies lose their cold gas at low redshift as they migrate from the field to the high density regions of clusters of galaxies. We find that beyond three cluster virial radii, the fraction of gas-rich galaxies is constant, representing the field. Within three cluster-centric radii, the fraction of gas-rich galaxies declines steadily with decreasing radius, reaching near the cluster center. Our results suggest that galaxies start to feel the impact of the cluster environment on their gas content well beyond the cluster virial radius. We show that almost all gas-rich galaxies at the cluster virial radius are falling in for the first time at nearly radial orbits. Furthermore, we find that almost no galaxy moving outward at the cluster virial radius is gas-rich (with gas to baryon ratio greater than ). These results suggest that galaxies that fall into clusters lose their cold gas within a single radial round-trip.
keywords:
cosmology — observations — large-scale structure of Universe — intergalactic medium — clusters of galaxies1 Significance Statement
Observations show that galaxies located in dense environments such as clusters of galaxies are mostly dominated by an old stellar population with little or no star-formation nor cold gas. This effect is likely caused by ram-pressure stripping of the gas in galaxies as they travel with high speed through the hot intracluster gas that permeates all clusters. But where and when do galaxies start losing their cold gas? What are their trajectories and how long does it take them to lose their gas? In this paper, we use high-resolution cosmological simulations to investigate these questions of how galaxies lose their cold gas as they fall into clusters of galaxies.
2 INTRODUCTION
It has long been known that the local environment affects galaxy properties. Earlier work [1, 2, 3, 4] showed that the fraction of early-type galaxies increases dramatically towards the central regions of clusters of galaxies, while the less dense regions of the field are dominated by spiral galaxies. Similarly, the ”color-density relation” [5, 6, 7, 8] indicates that red, old galaxies are found preferentially in over-dense environments, while galaxies with bluer, younger stellar populations are more common in the field. This color bimodality is linked to a transition in star formation rates between the low-density field and the high-density regions inside clusters [9, 4]. Nevertheless, we still do not have a complete picture of the process through which blue, late-type, star-forming galaxies in the field transform into red, early-type galaxies when entering a cluster. We know that cold gas in galaxies is spatially extended and often distributed far beyond the optical disks [10]. Cosmologically, some of the cold gas that feeds galaxy formation may come from the intergalactic medium [11, 12]. Observations suggest that neutral hydrogen feeds galaxies and turns into molecular hydrogen at a high column density of cm-2 [13] within which star formation is observed to occur. Together, these facts suggest that the amount of neutral hydrogen supply may ultimately set the rate of star formation. The environmental dependence of galaxy properties may thus be related to the availability of cold gas in or around galaxies. This expectation is supported by observations of galaxies in different environments showing the well-known depletion of both cold gas and star-formation towards the high-density central regions of clusters; this is likely caused by ram-pressure stripping of the cold gas by the hot intracluster medium (plus additional gravitational interactions) in the dense environments (see e.g., [14, 15, 16, 17, 18, 19, 20, 21, 22, 23, 24], and references therein). Recent detailed observations of on-going gas depletion from galaxies in clusters are presented by the VLA survey of HI in Virgo galaxies showing long tails of stripped gas behind galaxies, where the gas clumps in the tails are accelerated by ram-pressure, leaving behind streams of new stars [24, 22]. Long tails of HI and ionized gas are observed in galaxies in several nearby clusters, consistent with the above picture (e.g., [21, 22, 25, 26, 27]).
In this study, we utilize an Adaptive Mesh Refinement (AMR) cluster simulation to investigate where galaxies lose their cold gas () as a function of their distance from the cluster center, as well as the orbital trajectories of these galaxies. The physical processes responsible for the transition of the blue, late-type, star-forming galaxies into red, early-type galaxies when falling into clusters depend on the local density of the environment, and in return they are related to the radial distance from the cluster center. Therefore, the radial distribution of gas-rich galaxies from the innermost regions of clusters and up to several virial radii away from the cluster center can provide important information about galaxy evolution and the density-morphology relation. We also study the distribution of velocity orientations for gas-rich galaxies and for the general galaxy population since the efficiency of the processes driving galaxy evolution may depend on the orbital trajectories of these galaxies and the time they spend traversing the cluster before losing all their gas. While we focus on the questions of where and when galaxies lose their cold gas, and what the trajectories of the infalling galaxies are, our analysis is consistent with ram pressure stripping playing a major role in removing the cold gas from galaxies ([28, 29, 30, 31, 22, 23], and references therein). Gravitational interactions [32] may provide additional contributions to the gas dispersal or removal. We discuss this in a more detailed analysis presented in [33] where we demonstrate that hydrodynamic processes such as ram-pressure stripping play a dominant role in affecting cold gas content in galaxies, although the effectiveness of gas removal by ram pressure stripping is strongly dependent on the internal properties of galaxies.
3 SIMULATIONS
3.1 Hydrocode and Simulation Parameters
We perform cosmological simulations with the adaptive mesh refinement (AMR) Eulerian hydro code Enzo [34, 35]. Our simulations feature the largest sample of galaxies in a fully cosmological setting with sufficient resolution to study gas removal, and they include the most detailed physical processes as discussed below. This enables a greatly improved understanding of the gas loss behaviour. It is useful to compare with some relevant previous work on this subject. In [36], N-body simulations are combined with semi-analytic treatments of hydrodynamic effects. A significant advantage of their work is a very large cosmological volume, hence a large sample of clusters, but with a significant drawback due to the less realistic treatment for the gas. In [37], high resolution hydrodynamic simulations are used to investigate ram-pressure stripping for a variety of conditions. Nevertheless, their setup for both the structure of galaxies being stripped and the intra-cluster medium are highly idealized. Procedure-wise, we first run a low resolution simulation with a periodic box of Mpc (comoving) on a side. We identify a region centered on a cluster of mass at . We then resimulate with high resolution the chosen region embedded in the outer Mpc box to properly take into account the large-scale tidal field and appropriate boundary conditions at the surface of a refined region. The refined region has a comoving size of Mpc3 and represents a matter density fluctuation on that volume. The dark matter particle mass in the refined region is . The refined region is surrounded by two layers (each of Mpc) of buffer zones with particle masses successively larger by a factor of for each layer, which then connects with the outer root grid that has a dark matter particle mass times that in the refined region. We choose the mesh refinement criterion such that the resolution is always smaller than pc (physical), corresponding to a maximum mesh refinement level of at . An identical comparison run that has four times better resolution of pc/h and eight times better mass resolution (dark matter particle mass of ) was also run down to and relevant comparisons between the two simulations are made to understand effects of limited resolution on our results. The simulations include a metagalactic UV background [38], and a model for shielding of UV radiation [39]. They also include metallicity-dependent radiative cooling [40]. Our simulations solve relevant gas chemistry chains for molecular hydrogen formation [41], molecular formation on dust grains [35], and metal cooling extended down to K [42]. Star particles are created in cells that satisfy a set of criteria for star formation proposed by [43]. Each star particle is tagged with its initial mass, creation time, and metallicity; star particles typically have masses of .
Supernova feedback from star formation is modeled following [39]. Feedback energy and ejected metal-enriched mass are distributed into 27 local gas cells centered at the star particle in question, weighted by the specific volume of each cell, which is to mimic the physical process of supernova blastwave propagation that tends to channel energy, momentum and mass into the least dense regions (with the least resistance and cooling). The primary advantages of this supernova energy based feedback mechanism are three-fold. First, nature does drive winds in this way and energy input is realistic. Second, it has only one free parameter , namely, the fraction of the rest mass energy of stars formed that is deposited as thermal energy on the cell scale at the location of supernovae. Third, the processes are treated physically, obeying their respective conservation laws (where they apply), allowing transport of metals, mass, energy and momentum to be treated self-consistently and taking into account relevant heating/cooling processes at all times. We allow the entire feedback processes to be hydrodynamically coupled to the surroundings and subject to relevant physical processes such as cooling and heating. The total amount of explosion kinetic energy from Type II supernovae with a Chabrier initial mass function (IMF) is (where is the speed of light), for a mass of star formed. Taking into account the contribution of prompt Type I supernovae, we use in our simulations. Observations of local starburst galaxies indicate that nearly all of the SF produced kinetic energy is used to power galactic superwinds [44]. Supernova feedback is important primarily for regulating SF and for transporting energy and metals into the intergalactic medium. The extremely inhomogeneous metal enrichment process demands that both metals and energy (and momentum) are correctly modeled so that they are transported in a physically sound way (albeit still approximate at the current resolution).
We use the following cosmological parameters that are consistent with the WMAP7-normalized [45] CDM model: , , , , and .
3.2 Simulated Galaxy Catalogs
We identify galaxies in our high resolution simulations using the HOP algorithm [46] operating on the stellar particles; this algorithm is tested to be robust and insensitive to specific choices of parameters within reasonable ranges. Galaxies above a mass of are clearly identified in our simulation. The luminosity of each stellar particle is computed for each of the Sloan Digital Sky Survey (SDSS) five bands using the GISSEL stellar synthesis code [47], by supplying the formation time, metallicity and stellar mass. Collecting luminosity and other quantities of member stellar particles, gas cells and dark matter particles yields the following physical parameters for each galaxy: position, velocity, total mass, stellar mass, gas mass, mean formation time, mean stellar metallicity, mean gas metallicity, star formation rate (SFR), luminosities in five SDSS bands (and related colors), and others. At redshift , we identify 14 groups and clusters of mass to , which are the ”clusters” in the subsequent analysis. At a spatial resolution of pc/h (physical) with thousands of well resolved galaxies at , the simulated galaxy catalogs represent an excellent tool to study galaxy formation and evolution.
4 RESULTS
4.1 Radial Distribution of Gas-Rich Galaxies
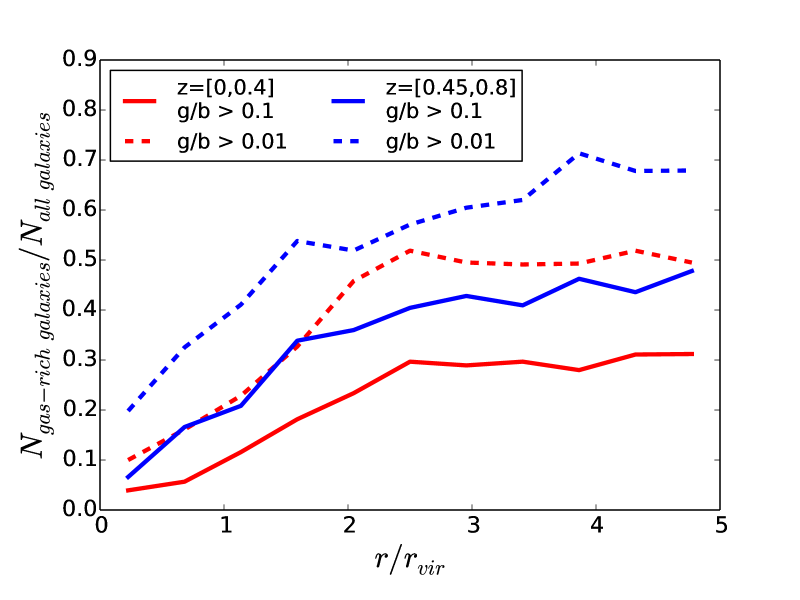
Figure 1 shows the fraction of gas-rich galaxies as a function of the cluster-centric distance in units of the virial radius of the cluster, where the virial radius is defined as the radius within which the mass overdensity is times the critical density. We consider two redshift ranges, (red curves) and (blue curves), as well as two different thresholds in the gas to total baryon ratio: (dashed curves) and (solid curves). This ratio is defined to be the cold () gas-fraction relative to total baryons in galaxies within their . As we can see in Figure 1, the fraction of gas-rich galaxies beyond three virial radii of the cluster approaches a constant value for both thresholds in gas to total baryon ratio. A clear trend is observed inward of cluster virial radii: the fraction of gas-rich galaxies decreases monotonically with decreasing cluster-centric distance. This trend is in good agreement with observations that the HI gas depletion increases with decreasing cluster-centric distance inward of about two virial radii [15, 48, 18, 49, 20, 50, 51, 52, 24]. Intriguingly, observations indicate that the distribution of star formation rates of cluster galaxies begins to change, compared with the field population, at a clustercentric radius of virial radii. This effect with clustercentric radius is most noticeable for strongly star-forming galaxies [9]. Since cold gas is the fuel for star formation, our finding for the cold gas dependence on cluster-centric distance provides a natural physical explanation for the observed trend of galaxy properties as a function of environment.
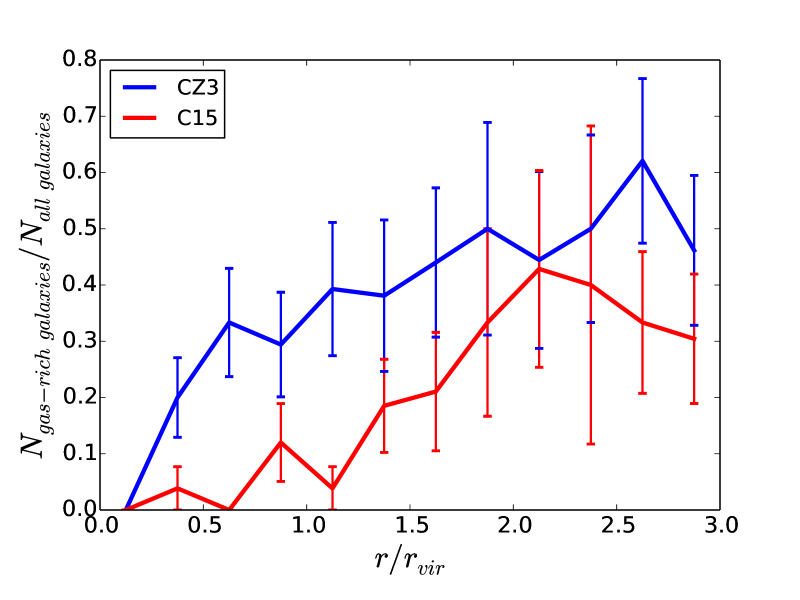
It is prudent to perform a numerical convergence test on the relevant results obtained above. In Figure 2 we show a comparison between our fiducial run “CZ3” and a higher resolution run “C15” (4 times better resolution), at redshifts and . While an absolute agreement is not expected, the results are encouraging and self-consistent. In the higher resolution run “C15”, star formation in smaller galaxies () is much better captured than in “CZ3”. Thus, more gas is converted into stars in these systems, and star formation begins at earlier times in “C15” than in “CZ3”. As a result, we expect the absolute amount of cold gas around galaxies at low redshift in “C15” to be lower than in “CZ3”, as is indeed seen in Fig. 2. Nevertheless, the same trend is observed in both runs: there is a monotonic decrease in the fraction of gas-rich galaxies with decreasing cluster-centric distance within of the cluster center, and there is a flattening in the gas fraction at larger radii.
Observations suggest that the gas-fraction in galaxies, observed as , decreases with their stellar mass (and/or their halo mass), and with the mass of the cluster in which they are located ([52, 53], and references therein). The trend of in our simulations is found to be consistent with the observed decrease of galactic gas-fraction with increasing galaxy mass as well as with increasing cluster mass. We find that the trend versus is not limited to the cluster environment but it is also seen outside of clusters. These results are to be presented elsewhere.
4.2 Trajectories of Infalling Gas-Rich Galaxies
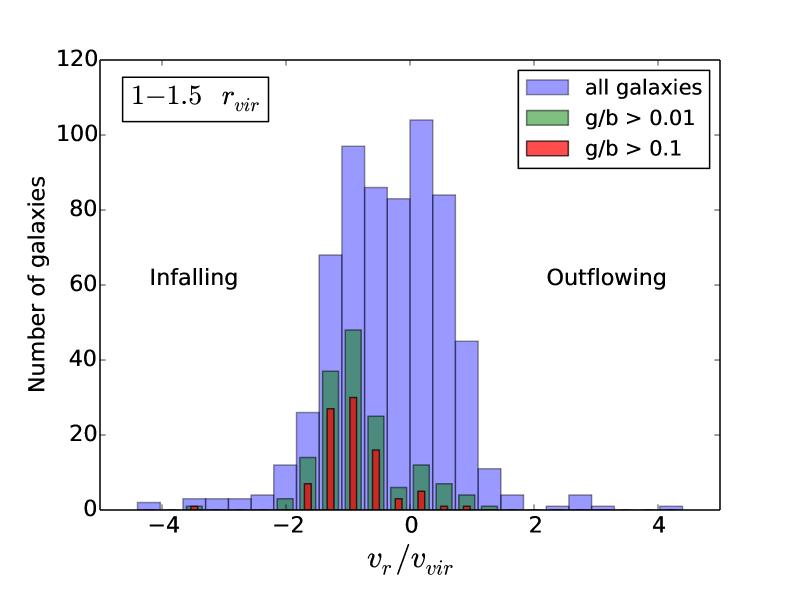
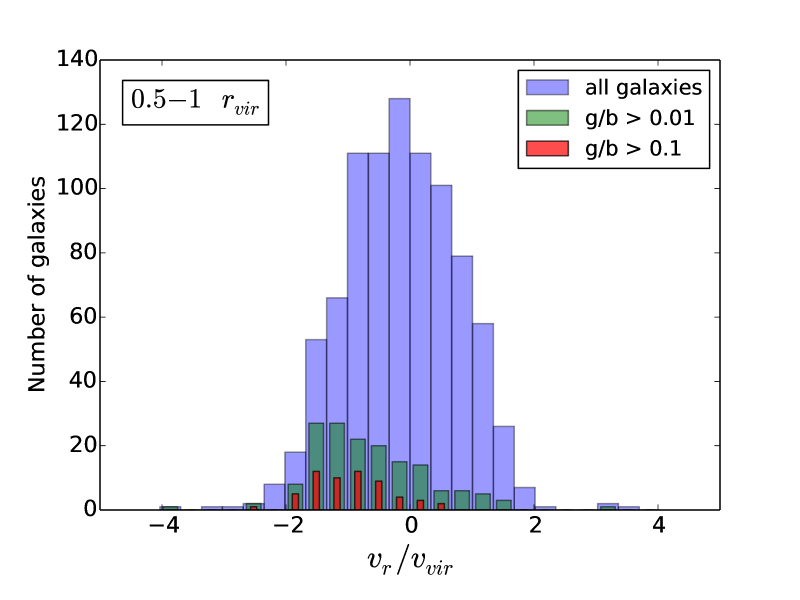
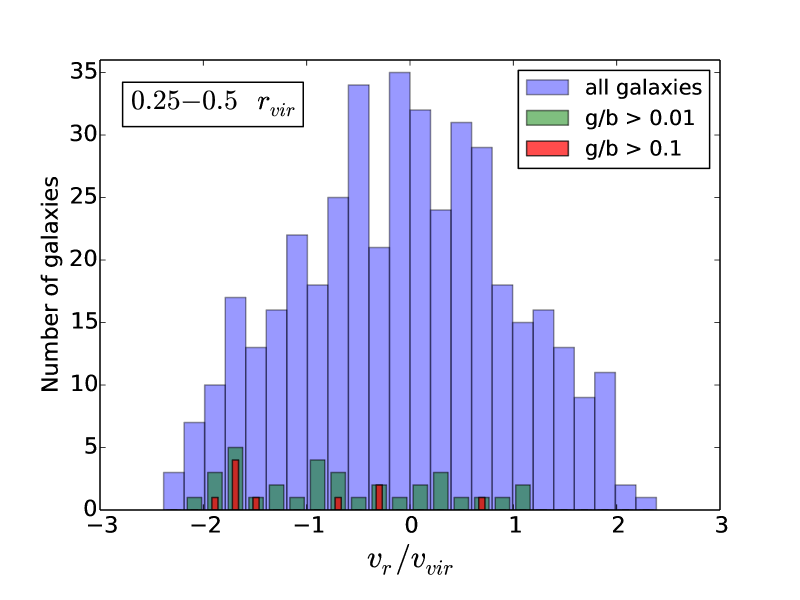
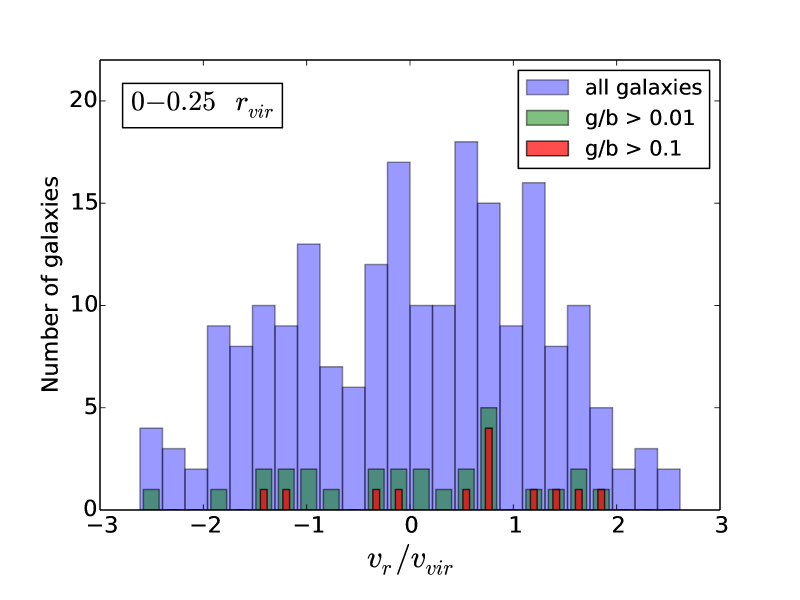
We examine two additional questions: What are the orbits of gas-rich galaxies in and around clusters? How long does it take for the gas-rich galaxies to lose gas upon entering a cluster? Figure 3 shows histograms of gas-rich galaxies as a function of their radial velocity (in units of the cluster virial velocity), for four radial ranges at . Infalling galaxies are defined to have negative radial velocities, whereas outgoing galaxies have positive radial velocities. It is seen that in the radial range (top-left panel) gas-rich galaxies preferentially have negative velocities with an amplitude peaking at about unity (), which should be compared to the general galaxy population that displays a nearly symmetric distribution peaked around zero. It is also interesting to note that there are nearly no gas-rich galaxies with positive velocities (i.e. there are no outgoing gas-rich galaxies; only infalling galaxies can be gas-rich). Examination of the other three panels indicates that the gas-rich galaxies’ tendency for negative velocities persists through the radial range (top-right panel), then decreases between (bottom-left panel), and finally disappears in the innermost radial range . Note that corresponds to about kpc, which is expected to be well resolved by our simulations. Taken together, we conclude that gas-rich galaxies tend to enter the cluster in radial infalling orbits, and they continue to lose their gas until about ; within of the cluster center their velocities are “randomized” and their gas has been lost. Most gas-rich galaxies, once entering the cluster virial radius, do not come back out gas-rich with outgoing radial velocities at radii larger than .
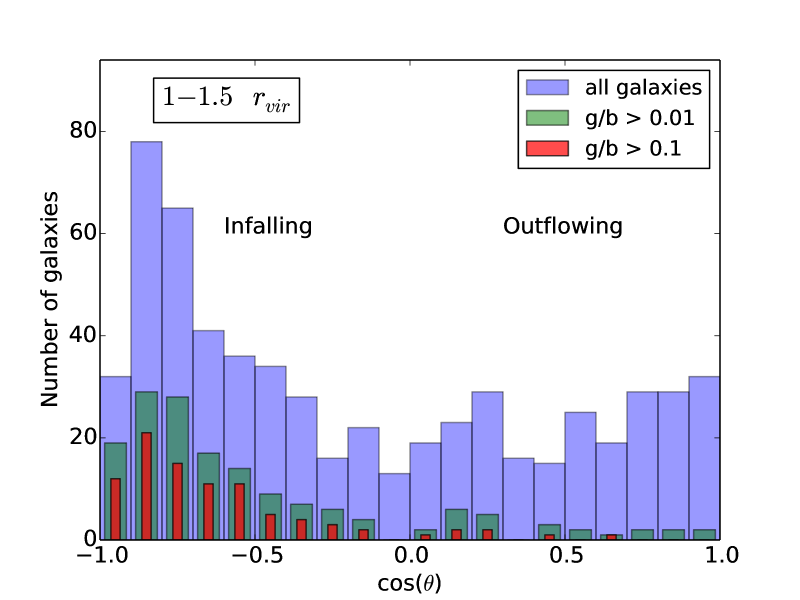
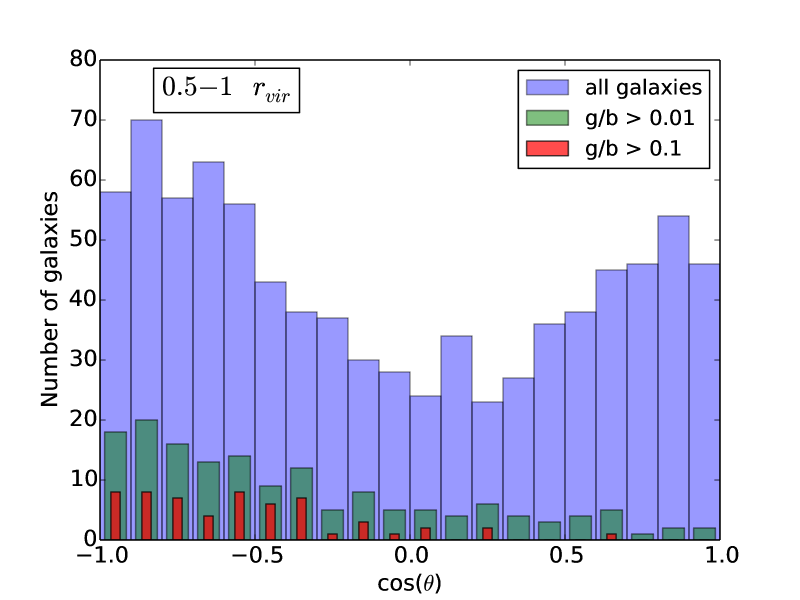
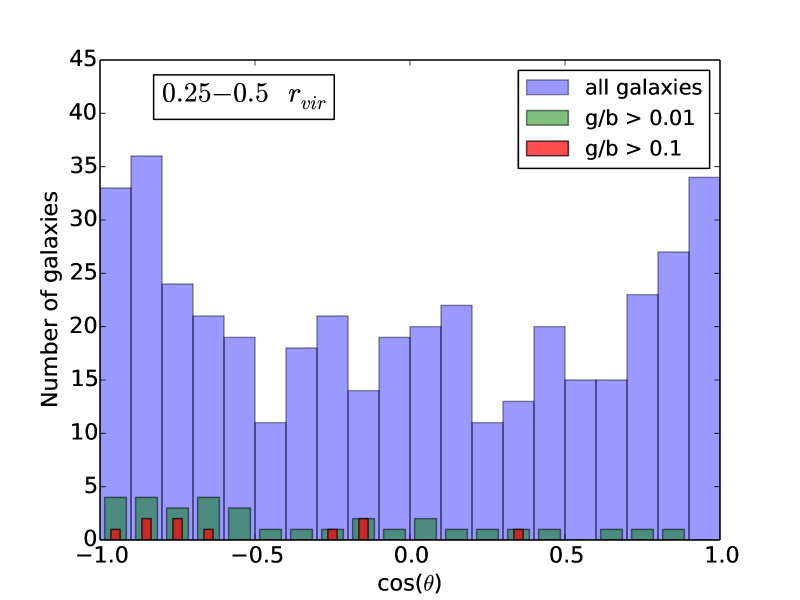
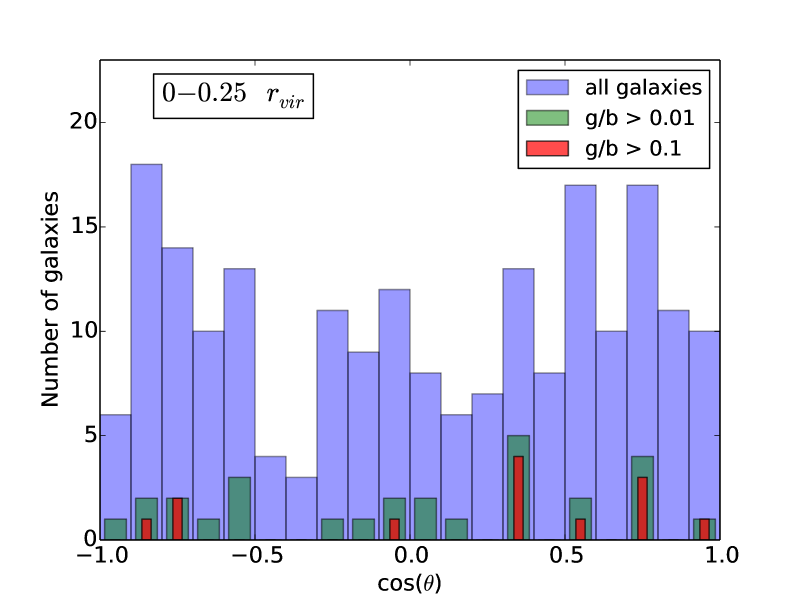
Figure 4 shows histograms of gas-rich galaxies with respect to for four radial ranges at . The angle is measured between the velocity vector and the position vector of a given galaxy, thus corresponds to a velocity vector pointing exactly towards the center of the cluster, while corresponds to a velocity vector pointing away from the center of the cluster. In accord with the results shown in Figure 3, we see that gas-rich galaxies tend to be infalling with close to , which is most clear in the radial range (top-left panel), but still visible up to (bottom-left panel). In the range (bottom-right panel) the distribution of gas rich galaxies has become symmetric.
Our conclusion that most gas-rich galaxies enter the cluster on radial infalling orbits (Figures 3 and 4) is supported by the 2-sample Kolmogorov-Smirnov (KS) test results reported in Table 1. We use the KS test to compute the probability that the distributions of gas-rich galaxies and the general population of galaxies as a function of and would appear as disparate as they are in our simulation if they were drawn from the same underlying parent distributions, for different cluster-centric radial ranges: , , , . At cluster-centric distances greater than , the KS test yields very low P-values for both the distributions in radial velocities () and velocity orientations (). For instance, the KS test for the distributions of radial velocities (Figure 3) indicates that the hypothesis that the sample from the general galaxy population and the sample of gas-rich galaxies (gas fraction ) have the same underlying parent distribution has a probability of for , for , and for . Thus, the KS test confirms that gas-rich galaxies on the outskirts of clusters fall in on radial orbits.
The results presented in Figure 3 and Figure 4 are consistent with observations. For example, recent observations of 23 groups of galaxies by Rasmussen et al. [51] find direct evidence for a suppressed star-formation rate in member galaxies out to scales of , in agreement with the simulations results described above. Similar observations suggesting a suppressed star formation rate and/or increased gas depletion up to in clusters are presented by [48, 54, 9, 55, 56, 49, 50, 57], and references therein. In addition, galaxies near the virial radius of the Virgo cluster tend to have long one-sided H I tails pointing away from M87 [21], suggesting that these galaxies are falling in on radial trajectories (see [22] for a detailed analysis). Similar results are observed for the Coma cluster [25], where a kpc tail is seen in the member galaxy NGC suggesting ram-pressure stripping on radial infall of the galaxy on its first passage through the cluster. Long tails of HI gas and ionized gas are also observed in the cluster Abell 1367, revealing galaxies in the process of being stripped-out of their gas [26, 27]. Kenney et al. [24] provide a detailed observational study of the transformation of a Virgo cluster dwarf irregular galaxy into a dwarf elliptical by ram-pressure stripping; the observations show a long tail of gas clumps being accelerated by ram-pressure and leaving behind streams of new stars, nicely consistent with ram-pressure stripping by the intracluster gas. To our knowledge, there is no observed galaxy that has a gas tail pointing toward the center of a cluster.
Observations also suggest that late-type galaxies have slightly more radial orbits than early-type galaxies [58, 59, 60, 61], consistent with the results presented here. Our results indicate that gas-bearing galaxies in clusters outside , should have been accreted within a time-frame that is shorter than the cluster dynamical time, because otherwise they would have lost their gas. This is consistent with the observational evidence in [25] and with the gas-bearing early-type dwarf galaxies in the Virgo cluster [62]. Galaxies appear to be falling into groups and clusters on radial orbits, and lose their gas within one travel time through the cluster center.
5 CONCLUSIONS
We use cosmological hydrodynamic adaptive mesh refinement simulations to examine the properties of galaxies in and around clusters and groups of galaxies at redshifts . We investigate more than galaxies of masses greater than , resolved at a resolution of kpc/h. We focus on finding the radial distribution of gas-rich galaxies around clusters/groups of total masses greater than , in order to learn where and when galaxies lose their cold gas at low redshift as they migrate from the field to the high density regions of clusters of galaxies. Our conclusions are summarized below.
(1) We find that beyond three virial radii from the center of the cluster, the fraction of galaxies rich in cold gas is nearly constant, i.e., approaching the field regions.
(2) Within three cluster-centric virial radii, the fraction of galaxies rich in cold gas decreases steadily with decreasing radius, reaching near the cluster center. Our results thus indicate that the cluster environment has a strong impact on the cold gas content of infalling galaxies up to distances as large as three virial radii from the cluster center.
(3) We find that nearly all galaxies rich in cold gas at the virial radius of a cluster fall into the cluster for the first time on nearly radial orbits; at distances greater than one virial radius from the cluster center, we find almost no gas-rich galaxies (with cold gas to baryon ratio greater than ) that are moving outward with positive radial velocities.
(4) These results suggest that galaxies that fall into clusters lose their cold gas within a single radial round-trip around the center of the cluster.
The results obtained above are in broad agreement with extant observations and provide useful insight on the relationship between cold gas content and star formation, and the observed dependence of galaxy properties on the local environment.
Acknowledgements.
We would like to thank Claire Lackner for providing the SQL based merger tree construction software. Computing resources were in part provided by the NASA High-End Computing (HEC) Program through the NASA Advanced Supercomputing (NAS) Division at Ames Research Center. This work is supported in part by grant NASA NNX11AI23G.References
- [1] Morgan WW (1962) Some Characteristics of Galaxies. ApJ 135:1.
- [2] Oemler, Jr. A (1974) The Systematic Properties of Clusters of Galaxies. Photometry of 15 Clusters. ApJ 194:1–20.
- [3] Dressler A (1980) Galaxy morphology in rich clusters - Implications for the formation and evolution of galaxies. ApJ 236:351–365.
- [4] Kauffmann G, et al. (2004) The environmental dependence of the relations between stellar mass, structure, star formation and nuclear activity in galaxies. MNRAS 353:713–731.
- [5] Hogg DW, et al. (2004) The Dependence on Environment of the Color-Magnitude Relation of Galaxies. ApJ 601:L29–L32.
- [6] Blanton MR, Eisenstein D, Hogg DW, Schlegel DJ, Brinkmann J (2005) Relationship between Environment and the Broadband Optical Properties of Galaxies in the Sloan Digital Sky Survey. ApJ 629:143–157.
- [7] Bamford SP, et al. (2009) Galaxy Zoo: the dependence of morphology and colour on environment. MNRAS 393:1324–1352.
- [8] McGee SL, et al. (2011) The Dawn of the Red: star formation histories of group galaxies over the past 5 billion years. MNRAS 413:996–1012.
- [9] Gómez PL, et al. (2003) Galaxy Star Formation as a Function of Environment in the Early Data Release of the Sloan Digital Sky Survey. ApJ 584:210–227.
- [10] Hoffman GL, et al. (1993) Arecibo mapping of three extended H I galaxy disks and conjectures on what lies beyond. AJ 106:39–55.
- [11] Kereš D, Katz N, Weinberg DH, Davé R (2005) How do galaxies get their gas? MNRAS 363:2–28.
- [12] Dekel A, Birnboim Y (2006) Galaxy bimodality due to cold flows and shock heating. MNRAS 368:2–20.
- [13] Zwaan MA, Prochaska JX (2006) Where Is the Molecular Hydrogen in Damped Ly Absorbers? ApJ 643:675–679.
- [14] Giovanelli R, Haynes MP (1983) The H I extent and deficiency of spiral galaxies in the Virgo cluster. AJ 88:881–908.
- [15] Giovanelli R, Haynes MP (1985) Gas deficiency in cluster galaxies - A comparison of nine clusters. ApJ 292:404–425.
- [16] Cayatte V, van Gorkom JH, Balkowski C, Kotanyi C (1990) VLA observations of neutral hydrogen in Virgo Cluster galaxies. I - The Atlas. AJ 100:604–634.
- [17] Dressler A, et al. (1999) A Spectroscopic Catalog of 10 Distant Rich Clusters of Galaxies. ApJS 122:51–80.
- [18] Solanes JM, et al. (2001) The H I Content of Spirals. II. Gas Deficiency in Cluster Galaxies. ApJ 548:97–113.
- [19] Koopmann RA, Kenney JDP (2004) H Morphologies and Environmental Effects in Virgo Cluster Spiral Galaxies. ApJ 613:866–885.
- [20] Boselli A, Gavazzi G (2006) Environmental Effects on Late-Type Galaxies in Nearby Clusters. PASP 118:517–559.
- [21] Chung A, van Gorkom JH, Kenney JDP, Crowl H, Vollmer B (2009) VLA Imaging of Virgo Spirals in Atomic Gas (VIVA). I. The Atlas and the H I Properties. AJ 138:1741–1816.
- [22] Vollmer B, et al. (2012) Ram pressure stripping of the multiphase ISM and star formation in the Virgo spiral galaxy NGC 4330. A&A 537:A143.
- [23] Bahé YM, McCarthy IG, Balogh ML, Font AS (2013) Why does the environmental influence on group and cluster galaxies extend beyond the virial radius? MNRAS 430:3017–3031.
- [24] Kenney JDP, et al. (2014) Transformation of a Virgo Cluster Dwarf Irregular Galaxy by Ram Pressure Stripping: IC3418 and Its Fireballs. ApJ 780:119.
- [25] Fossati M, Gavazzi G, Boselli A, Fumagalli M (2012) 65 kpc of ionized gas trailing behind NGC 4848 during its first crossing of the Coma cluster. A&A 544:A128.
- [26] Gavazzi G, et al. (2001) 75 Kiloparsec Trails of Ionized Gas behind Two Irregular Galaxies in A1367. ApJ 563:L23–L26.
- [27] Scott TC, et al. (2010) Probing evolutionary mechanisms in galaxy clusters: neutral atomic hydrogen in Abell1367. MNRAS 403:1175–1192.
- [28] Cen R (2014) On the Origin of the Hubble Sequence: I. Insights on Galaxy Color Migration from Cosmological Simulations. ApJ 781:38.
- [29] Gunn JE, Gott JRI (1972) On the Infall of Matter Into Clusters of Galaxies and Some Effects on Their Evolution. ApJ 176:1–+.
- [30] Tonnesen S, Bryan GL, van Gorkom JH (2007) Environmentally Driven Evolution of Simulated Cluster Galaxies. ApJ 671:1434–1445.
- [31] Brüggen M, Heinz S, Roediger E, Ruszkowski M, Simionescu A (2007) Shock heating by Fanaroff-Riley type I radio sources in galaxy clusters. MNRAS 380:L67–L70.
- [32] Vollmer B (2003) NGC 4654: Gravitational interaction or ram pressure stripping? A&A 398:525–539.
- [33] Cen R (2013) How Galaxies Become Red: Insights from Cosmological Simulations. ArXiv e-prints.
- [34] Bryan GL, Norman ML (1999) ed S. B. Baden NPC (IMA Volumes on Structured Adaptive Mesh Refinement Methods, No. 117), p 165.
- [35] Joung MR, Cen R, Bryan GL (2009) Galaxy Size Problem at z = 3: Simulated Galaxies are too Small. ApJ 692:L1–L4.
- [36] Brüggen M, De Lucia G (2008) Ram-pressure histories of cluster galaxies. MNRAS 383:1336–1342.
- [37] Tonnesen S, Bryan GL (2009) Gas Stripping in Simulated Galaxies with a Multiphase Interstellar Medium. ApJ 694:789–804.
- [38] Haardt F, Madau P (1996) Radiative Transfer in a Clumpy Universe. II. The Ultraviolet Extragalactic Background. ApJ 461:20.
- [39] Cen R, Nagamine K, Ostriker JP (2005) Quantitative Signatures of Galactic Superwinds on Ly Clouds and Metal-Line Systems. ApJ 635:86–99.
- [40] Cen R, Kang H, Ostriker JP, Ryu D (1995) Background X-Ray Emission from Hot Gas in CDM and CDM+ Lambda Universes: Spectral Signatures. ApJ 451:436–+.
- [41] Abel T, Anninos P, Zhang Y, Norman ML (1997) Modeling primordial gas in numerical cosmology. New Astronomy 2:181–207.
- [42] Dalgarno A, McCray RA (1972) Heating and Ionization of HI Regions. ARA&A 10:375–+.
- [43] Cen R, Ostriker JP (1992) Galaxy formation and physical bias. ApJ 399:L113–L116.
- [44] Heckman TM (2001) Galactic Superwinds at Low and High Redshift, Astronomical Society of the Pacific Conference Series eds Hibbard JE, Rupen M, van Gorkom JH Vol. 240, p 345.
- [45] Komatsu E, et al. (2010) Seven-Year Wilkinson Microwave Anisotropy Probe (WMAP) Observations: Cosmological Interpretation. ArXiv e-prints.
- [46] Eisenstein DJ, Hu W (1998) Baryonic Features in the Matter Transfer Function. ApJ 496:605.
- [47] Bruzual G, Charlot S (2003) Stellar population synthesis at the resolution of 2003. MNRAS 344:1000–1028.
- [48] Balogh ML, et al. (1998) The Dependence of Cluster Galaxy Star Formation Rates on the Global Environment. ApJ 504:L75.
- [49] Rines K, Geller MJ, Kurtz MJ, Diaferio A (2005) CAIRNS: The Cluster and Infall Region Nearby Survey. III. Environmental Dependence of H Properties of Galaxies. AJ 130:1482–1501.
- [50] Chung SM, et al. (2011) A WISE View of Star Formation in Local Galaxy Clusters. ApJ 743:34.
- [51] Rasmussen J, et al. (2012) The Suppression of Star Formation and the Effect of the Galaxy Environment in Low-redshift Galaxy Groups. ApJ 757:122.
- [52] Catinella B, et al. (2013) The GALEX Arecibo SDSS Survey - VIII. Final data release. The effect of group environment on the gas content of massive galaxies. MNRAS 436:34–70.
- [53] Cortese L, Catinella B, Boissier S, Boselli A, Heinis S (2011) The effect of the environment on the H I scaling relations. MNRAS 415:1797–1806.
- [54] Lewis I, et al. (2002) The 2dF Galaxy Redshift Survey: the environmental dependence of galaxy star formation rates near clusters. MNRAS 334:673–683.
- [55] Treu T, et al. (2003) A Wide-Field Hubble Space Telescope Study of the Cluster Cl 0024+16 at z = 0.4. I. Morphological Distributions to 5 Mpc Radius. ApJ 591:53–78.
- [56] Tanaka M, Goto T, Okamura S, Shimasaku K, Brinkmann J (2004) The Environmental Dependence of Galaxy Properties in the Local Universe: Dependences on Luminosity, Local Density, and System Richness. AJ 128:2677–2695.
- [57] Chung EJ, Kim S (2014) Molecular gas mass and star formation of 12 Virgo spiral galaxies along the ram pressure time sequence, American Astronomical Society Meeting Abstracts Vol. 223, p 453.21.
- [58] Giraud E (1986) The orbits of H I-deficient spiral galaxies in the Virgo cluster. A&A 167:25–33.
- [59] Dressler A (1986) The morphological types and orbits of H I-deficient spirals in clusters of galaxies. ApJ 301:35–43.
- [60] Vollmer B, Cayatte V, Balkowski C, Duschl WJ (2001) Ram Pressure Stripping and Galaxy Orbits: The Case of the Virgo Cluster. ApJ 561:708–726.
- [61] Biviano A, Katgert P (2004) The ESO Nearby Abell Cluster Survey. XIII. The orbits of the different types of galaxies in rich clusters. A&A 424:779–791.
- [62] Hallenbeck G, et al. (2012) Gas-bearing Early-type Dwarf Galaxies in Virgo: Evidence for Recent Accretion. AJ 144:87.
| Distance Range | Gas Fraction | D-statistic | P-value | |
|---|---|---|---|---|
| Virial Radius | ||||
| Virial Radius | ||||
| Virial Radius | ||||
| Virial Radius | ||||
| Virial Radius | ||||
| Virial Radius | ||||
| Virial Radius | ||||
| Virial Radius | ||||