INPOP new release: INPOP13c
Abstract
Based on the use of MESSENGER radiotracking data in the construction of new Mercury ephemerides ([12]) a new planetary ephemerides INPOP13c was built including Mercury improvements but also improvements on the Mars orbit and on the tie of INPOP planetary ephemerides to ICRF in general.
1 INPOP13c
The MESSENGER mission was the first mission dedicated to the study on Mercury. The spacecraft orbits the smallest and the Sun closest planet of the solars system since 2011. ([12]) described the methods and procedures used for the analysis of the MESSENGER Doppler and range data included in the construction of the Mercury improved ephemerides, INPOP13a.
INPOP13c is an upgraded version of INPOP13a, fitted to LLR observations, and including new observations of Mars and Venus deduced from MEX, Mars Odyssey and VEX tracking ([9], [10] , [8]). The Pluto orbit was also improved with a better iterative procedure. Tables 7 and 8 resume the data samples and the obtained residuals with INPOP13c and INPOP10e common to the two ephemerides when Table 9 exhibits the residuals obtained for the data samples added since INPOP10e. Thanks to this supplementary material, a better extrapolation capability of the Mars ephemerides appears clearly in Tables 9, 4 and 5 as well as better consistencies between DE and INPOP ephemerides (see for example Table 2). The section 2 presents comparisons between INPOP13c, INPOP10e ([3]) and DE430 ([5]).
Adjustment of the gravitational mass of the sun was performed as recommended by the IAU resolution B2 as well as the sun oblateness (J2), the ratio between the mass of the earth and the mass of the moon (EMRAT) and the mass of the Earth-Moon barycenter. Estimated values are presented on Table 1.
Masses of planets as well as procedures of estimations of the asteroid masses perturbing the inner planet orbits are the same as in INPOP10e and INPOP13a. Comparisons between asteroid masses obtained with INPOP13c and values gathered in [1] are given and discussed in section 3.
| INPOP13c | INPOP10e | DE430 | |
| 1 | 1 | 1 | |
| (EMRAT-81.3000) 10-4 | (5.694 0.010) | (5.700 0.020) | () |
| J2⊙ 10-7 | (2.30 0.25) | (1.80 0.25) | 1.80 |
| GM⊙ - 132712440000 [km s-2] | (44.487 0.17) | (50.16 1.3) | 40.944 |
| AU - 1.49597870700 1011 [m] | 0.0 | 0.0 | (-0.3738 3 ) |
| [M⊙ / M] - 328900 | 0.55314 0.00033 | 0.55223 0.004 | 0.55915 NC |
2 Estimation of uncertainties
Mercury
Venus
Mars
Jupiter
Saturn
Uranus
Neptune
Pluto
| Geocentric | INPOP13c - INPOP10e | INPOP13c - DE430 | INPOP10e - DE423 | ||||||
|---|---|---|---|---|---|---|---|---|---|
| Differences | 1980-2020 | 1980-2020 | 1980-2020 | ||||||
| mas | mas | km | mas | mas | km | mas | mas | km | |
| Mercury | 1.4 | 3.8 | 0.51 | 0.69 | 0.61 | 0.12 | 1.58 | 1.7 | 0.65 |
| Venus | 0.17 | 0.22 | 0.023 | 0.33 | 0.16 | 0.017 | 0.85 | 0.42 | 0.045 |
| Mars | 1.19 | 0.38 | 0.204 | 0.35 | 0.21 | 0.129 | 2.1 | 0.62 | 0.47 |
| Jupiter | 0.52 | 0.23 | 0.60 | 6.85 | 9.55 | 2.98 | 0.81 | 0.74 | 1.11 |
| Saturn | 0.24 | 0.72 | 0.25 | 0.75 | 0.49 | 1.72 | 0.82 | 0.53 | 1.82 |
| Uranus | 1.64 | 0.46 | 11.52 | 37.0 | 24.1 | 442.47 | 98.1 | 38.9 | 359.73 |
| Neptune | 24.4 | 9.65 | 1081 | 31.0 | 53.1 | 904.1 | 51.0 | 91.3 | 2054.8 |
| Pluton | 800.0 | 122.3 | 37384.1 | 112.0 | 39.8 | 465.4 | 703.2 | 152.7 | 37578.6 |
| Earth Barycentric | XYZ | VxVyVz |
|---|---|---|
| Differences | ||
| km | mm.s-1 | |
| INPOP13c - INPOP10e | 0.104 | 0.0177 |
| INPOP13c - DE430 | 0.3763 | 0.0467 |
| INPOP10e-DE423 | 0.84 | 0.113 |
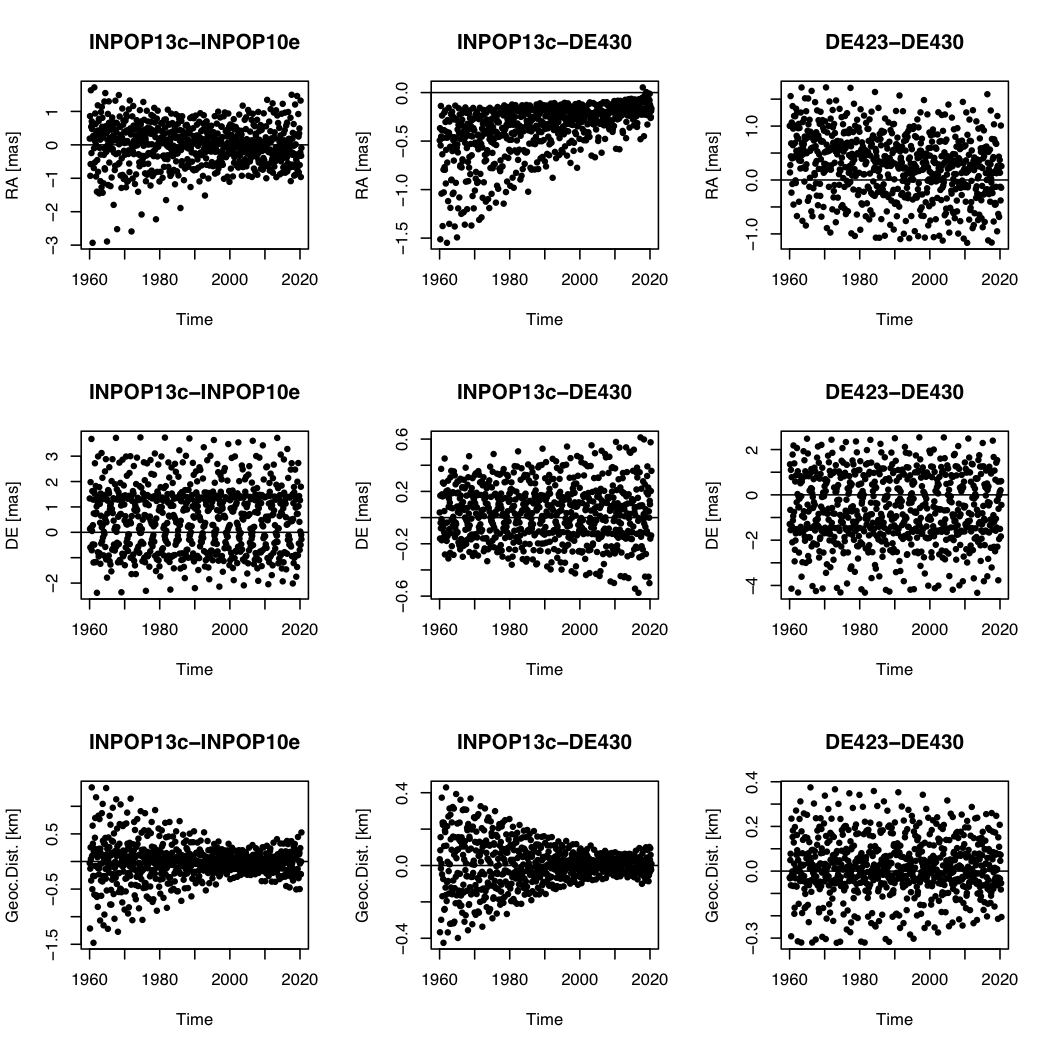
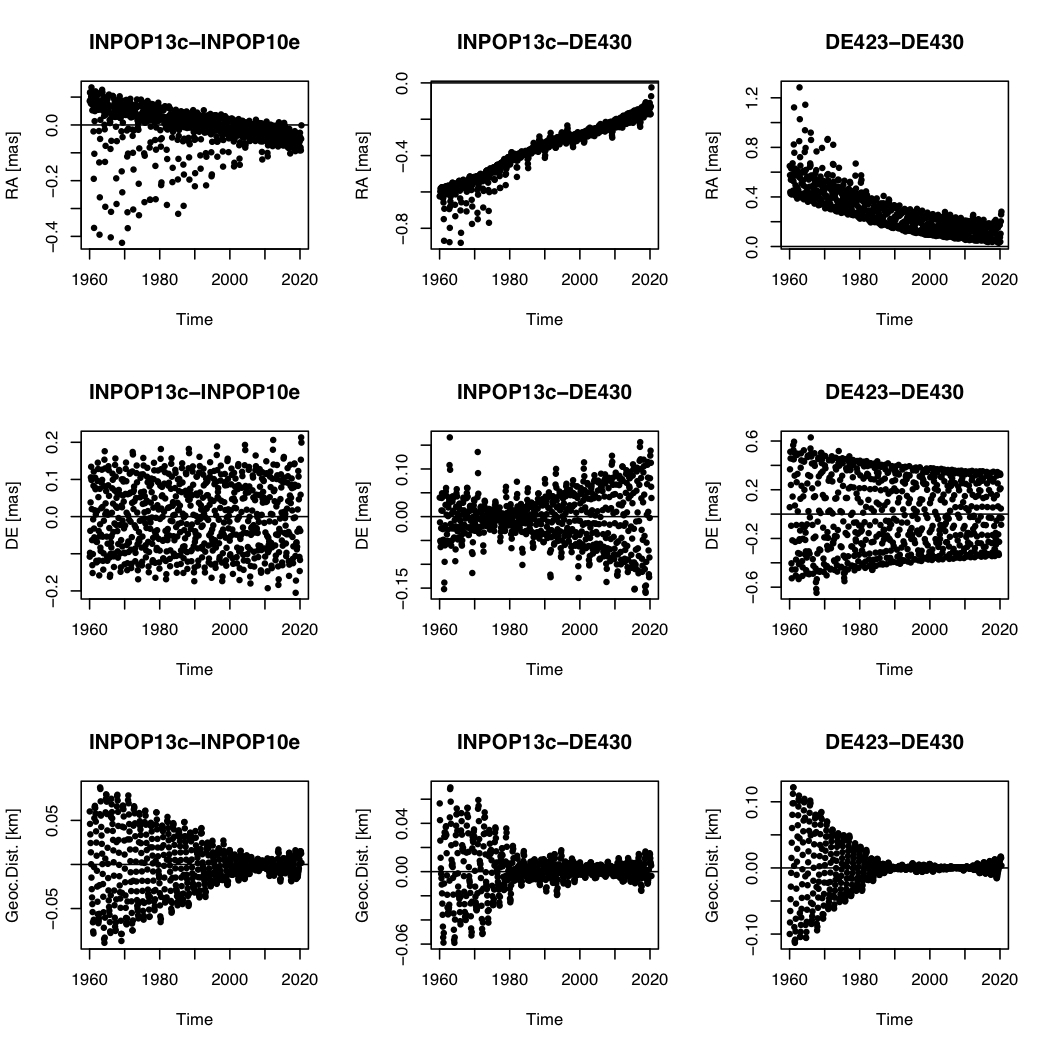
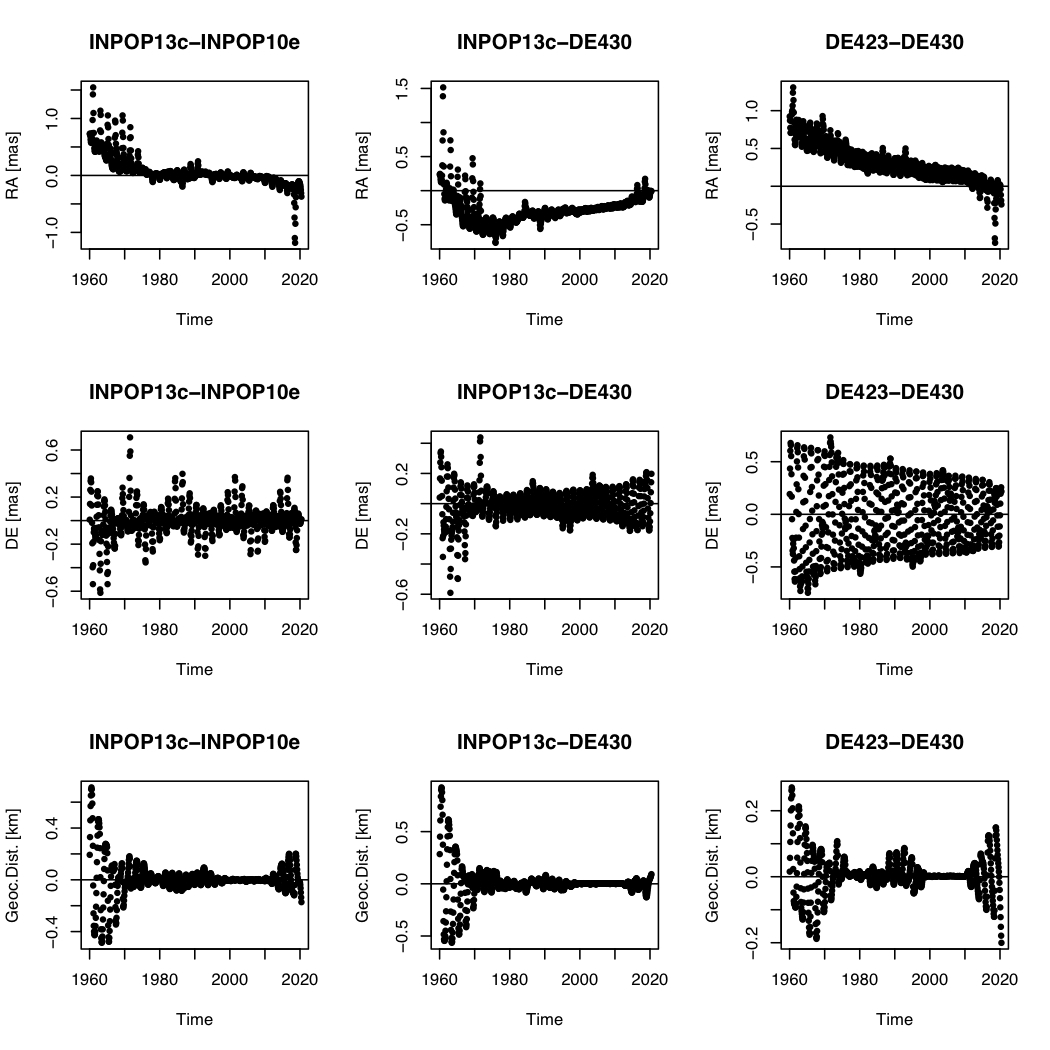
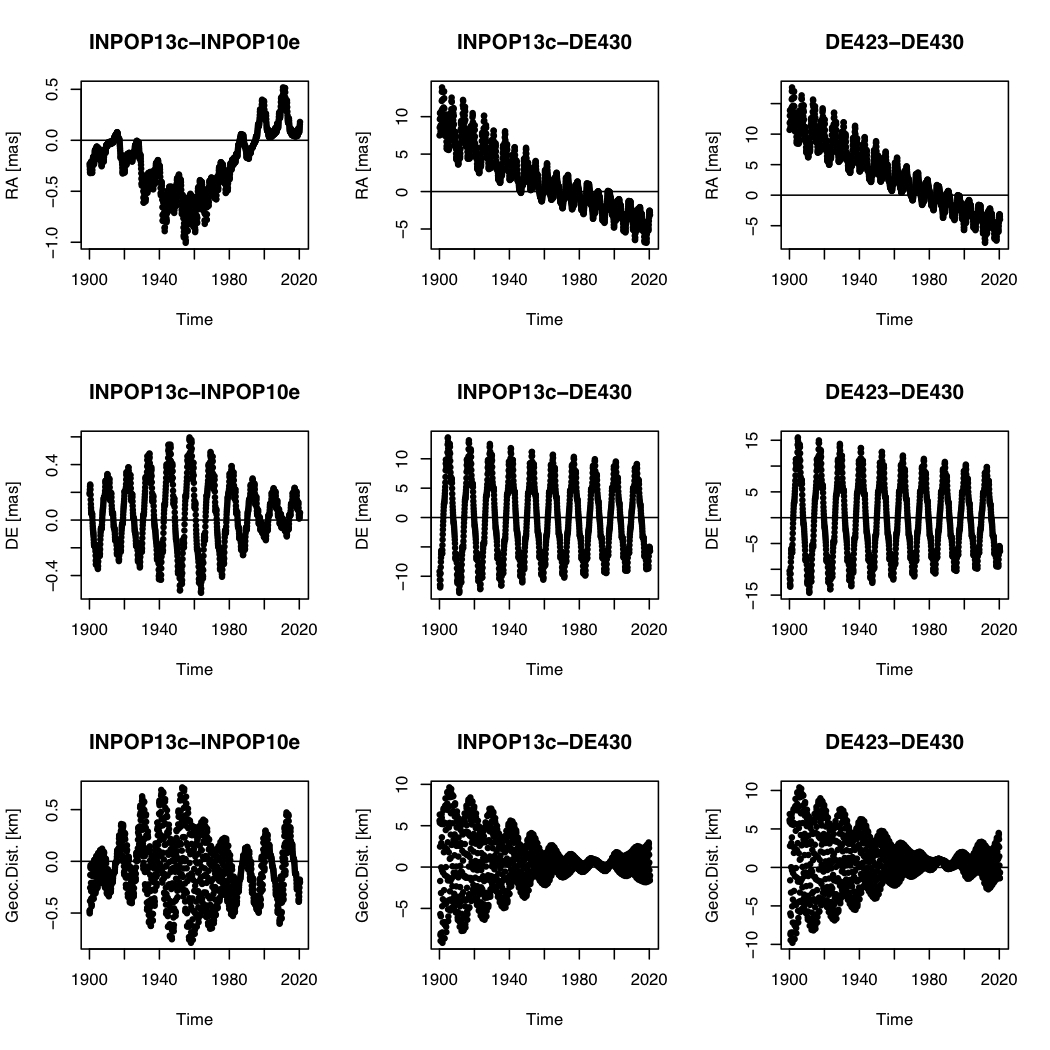
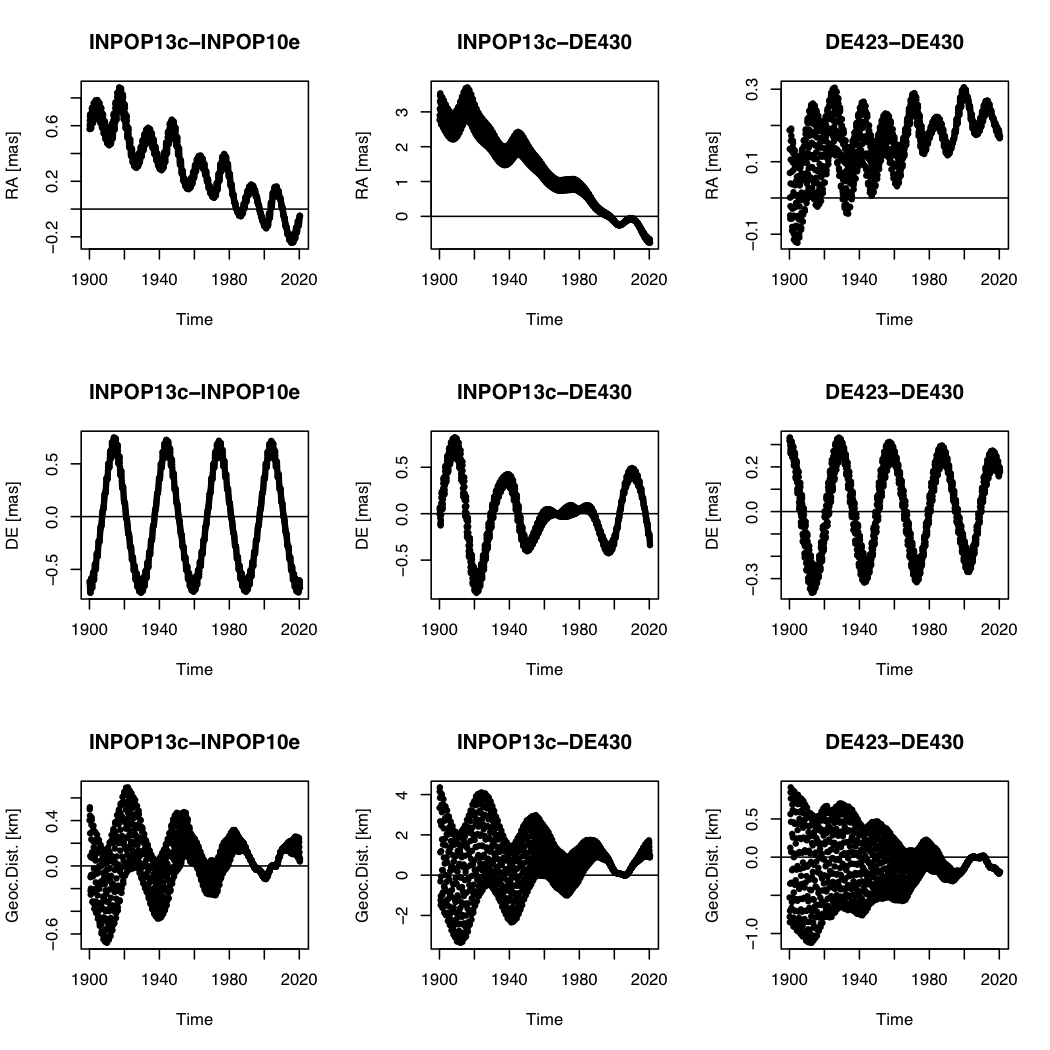
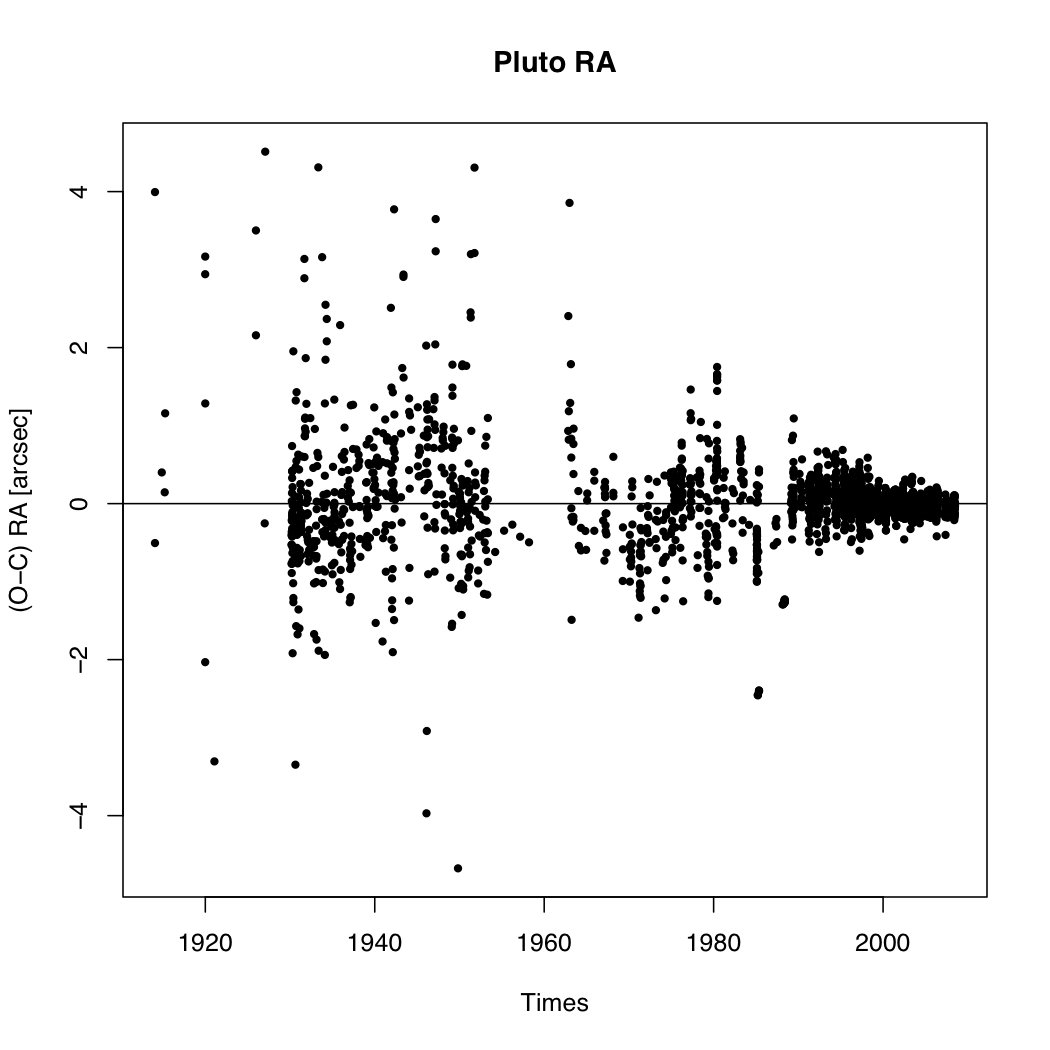
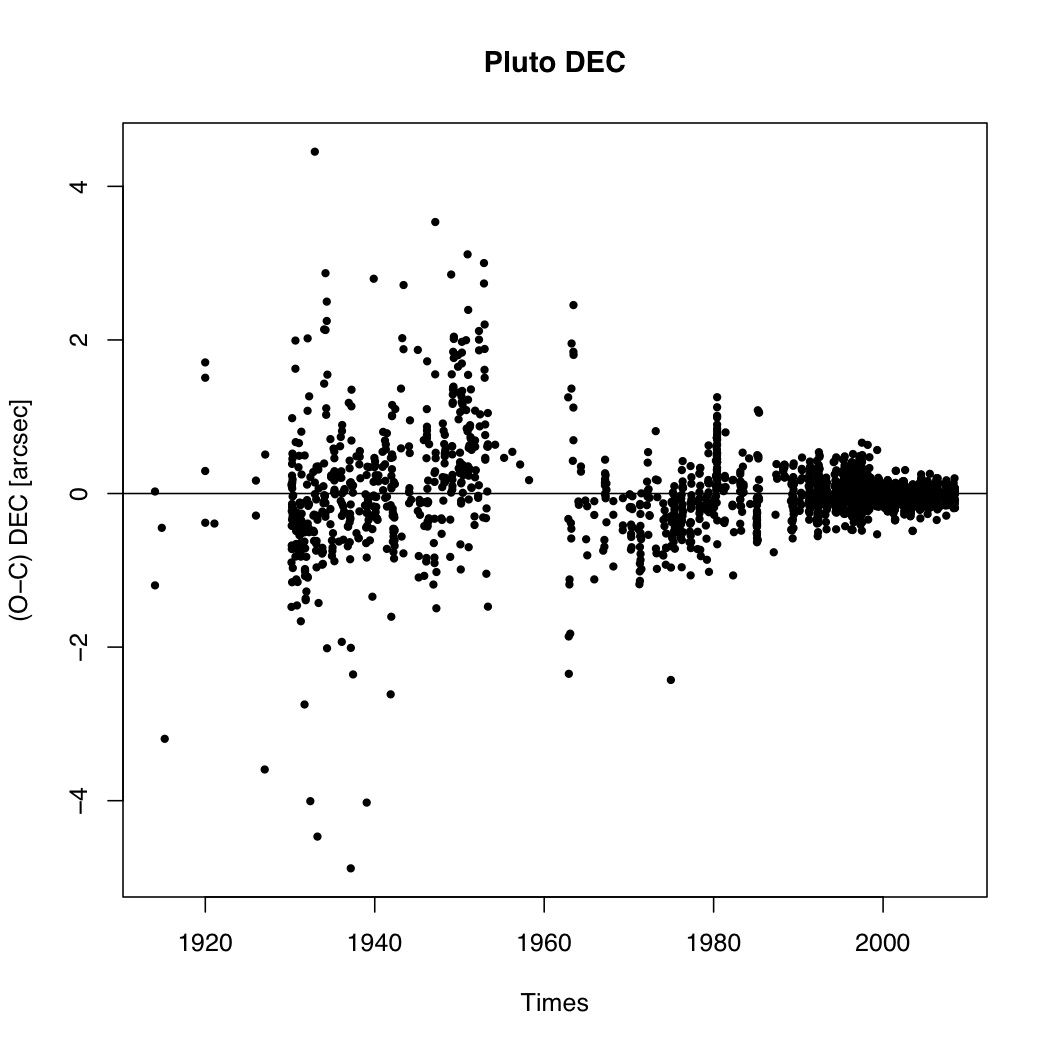
Figures 1 to 8 present the differences in right ascension, declination and geocentric distances between INPOP13c, INPOP10e, DE430 and DE423 ([4]) over 120 years. The comparisons between INPOP13c and INPOP10e show the improvement of INPOP13c due to the addition of new data samples. DE430 was fitted on about the same sample as INPOP13c except for Saturn Cassini normal points which were reprocessed (for more details see [5]). The comparisons between INPOP13c and DE430 give then an estimation of the ephemerides uncertainties induced by the use of different procedures of data analysis and of weighting schema. The differences DE430-DE423 are also plotted. The Tables 2 and 3 give the maximum differences obtained by comparisons between the same ephemerides on a 1980 to 2020 interval.
For the inner planets the differences pictured on Figures 1,2 and 3 show a good consistency between DE430, INPOP13c and INPOP10e.
For Mercury, the impact of the MESSENGER range bias used for INPOP13c and DE430 construction is clear on the post-2010 period. One can notice an increase of the differences in geocentric distances between INPOP13c and INPOP10e with the time. This increase does not appear in the DE423-DE430 differences. This fact could be explained by the lack of accurate observations before 2008 and the launch of MESSENGER. It is also noticed in the comparisons of the postfit residuals of Mariner data set in the Table 7.
The Table 9 illustrates the improvement brought by the use of the MESSENGER range bias in the construction of INPOP13c by comparing INPOP13c postfit residuals and residuals obtained with INPOP10e.
The one-order of magnitude improvement is consistent with INPOP13a ([12]) and is also illustrated on the Figures of the Table 5.
For Venus, one can note that the differences between DE423 and DE430 are one-order of magnitude larger than those between INPOP13c, INPOP10e and DE430 demonstrating an improvement of the accuracy of Venus orbit, especially through the computation of the geocentric distances. A common increase of the one-way range residuals of a factor 3 for INPOP13c and INPOP10 after 2010 shown on Table 9 and on plots of the Table 5 illustrates a confirmed degradation of the VEX transpondeur with time.
For Mars, as one can see on Figure 3 and on Table 2 the differences from one ephemeris to another one are quite equivalent for angles and geocentric distances. This illustrates the intensive works done in the past few years for improving the extrapolation capabilities of the ephemerides for the highly perturbed Mars orbit. The figures of the Tables 4 and 5 also show the improvement of the smoothness of the postfit residuals obtained with INPOP13c.
In terms of reference frame, the VLBI observations of Mars orbiters give the strongest link to ICRF2 as explained in [5]. As the INPOP13c-DE430 differences obtained for and are below 0.5 mas and as the postfit residuals of INPOP13c VLBI Mars observations are also below 0.5 mas, the link of INPOP13c to ICRF2 is garenteed to at least 0.5 mas over the observational time interval (from 1989.13 to 2007.97) but also over the interval of ephemeris comparisons (from 1980 to 2020). Globally we can notice very small differences ( mas) in angular geocentric quantities over 60 years for inner planets.
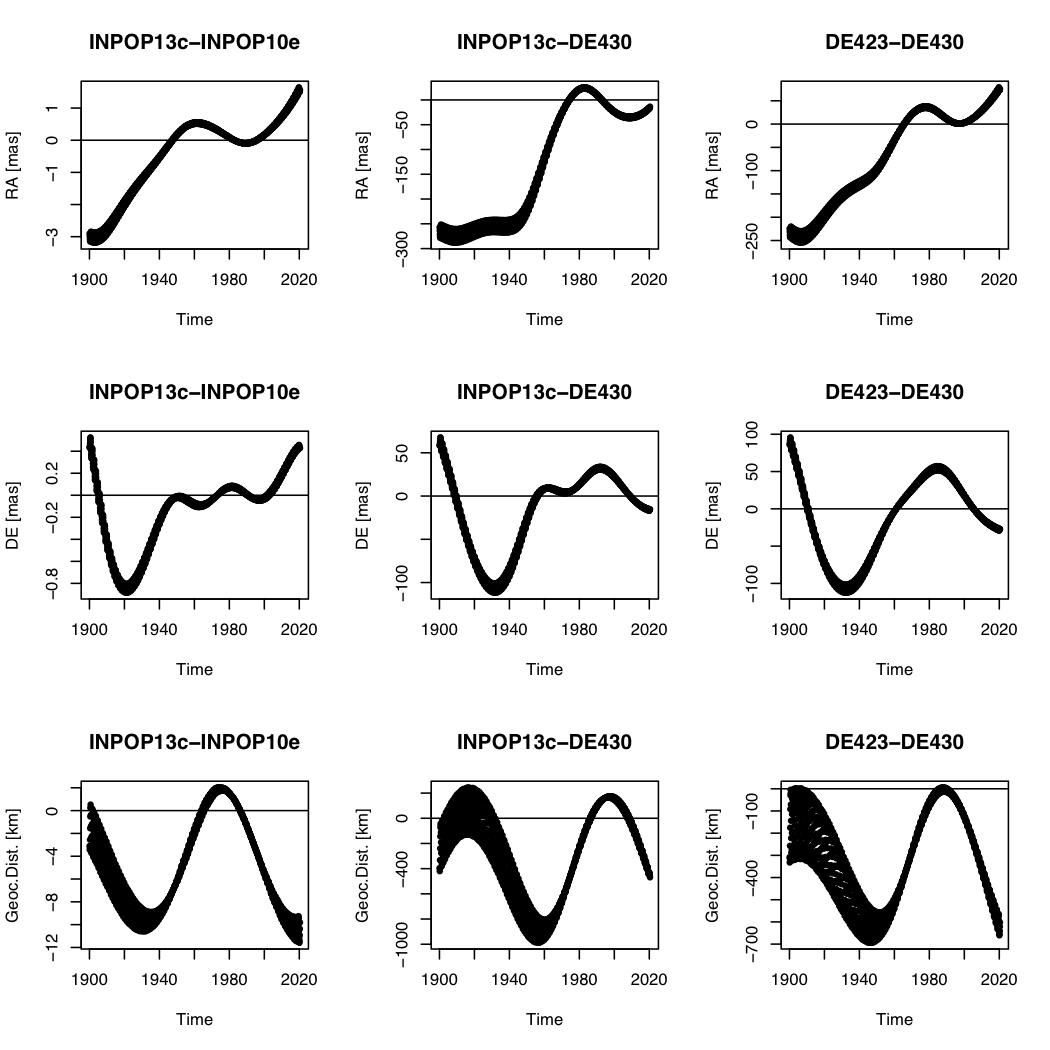
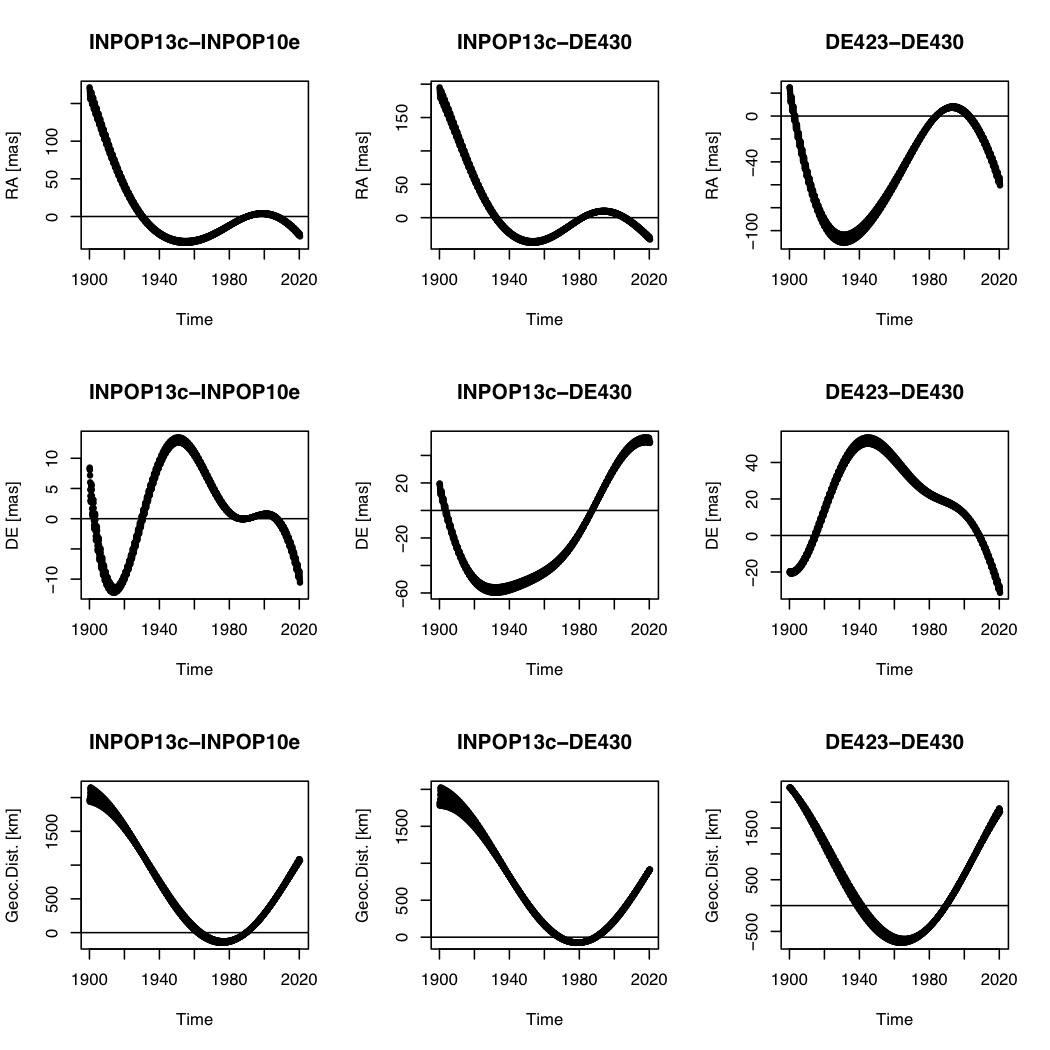
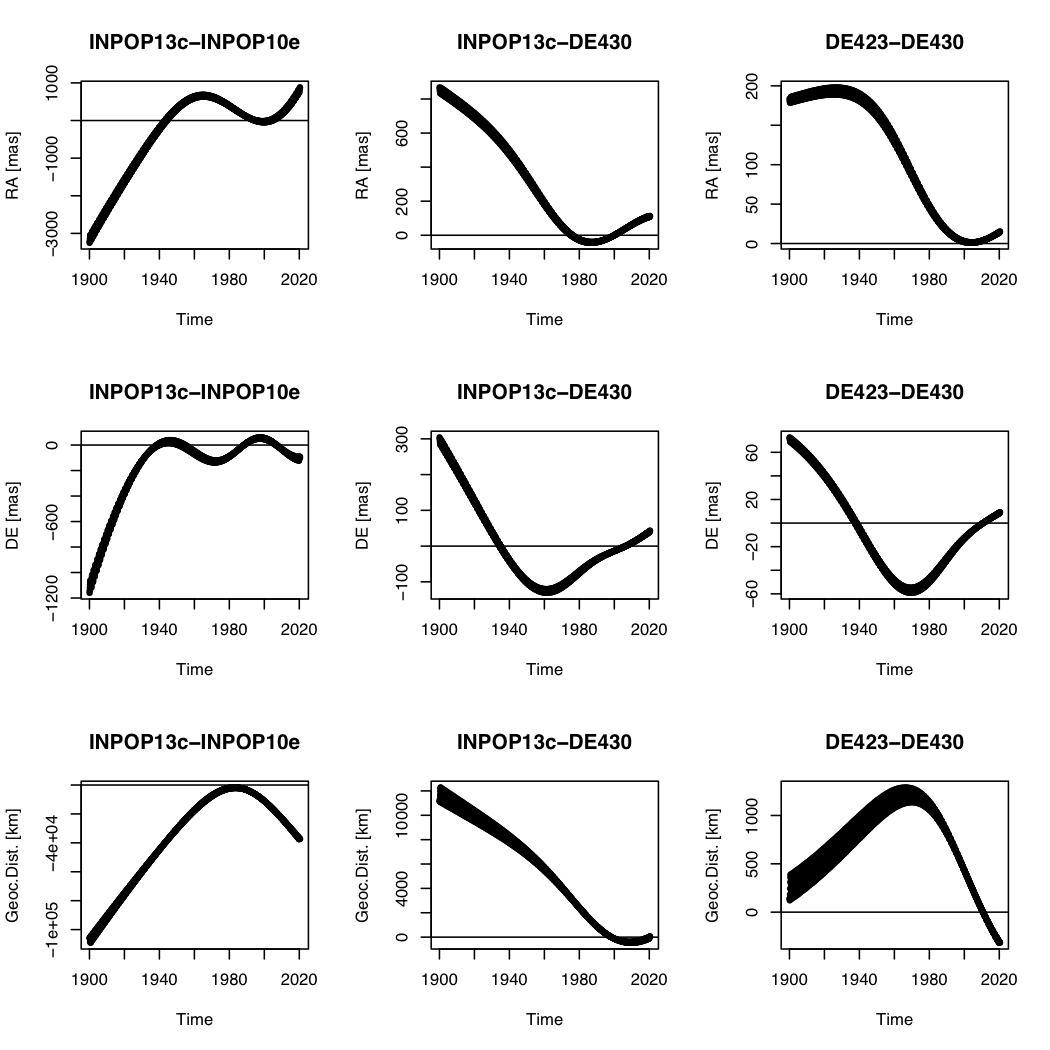
For the outer planets, differences are showed on Figures 4, 5, 6 and 7. A summary of the maximum differences is given on Table 2 and postfit residuals are presented on Tables 7 and 8.
The Jupiter differences show an non-negligeable discrepency between INPOP13c, INPOP10e and DE423 in one hand and DE430 in the other hand. This appears for all quantities (, and geocentic distances) reaching about 15 mas in for DE423-DE430 and INPOP13c-DE430 over 1 century and about 10 mas over the contemporary interval (from 1980 to 2020). On the opposite, the maximum differences obtained by comparing INPOP13c to INPOP10e or INPOP10e to DE423 (see Table 2) do not present such offsets. These results could be explained by the change of weights used for the construction of the ephemerides. The uncertainties of the Jupiter modern observations were indeed not well estimated due to failures in the operational procedures (for example with the Galileo High Gain Antenna) or due to indirect measurements during flybys ([5]). One can then wait to have better inputs from the future Junon mission which is supposed to reach Jupiter in 2015.
Despite the use of new analysed Cassini tracking data in DE430, the differences of the Saturn orbits estimated with INPOP ephemerides and DE430 are less important than the Jupiter differences. They are also consistent with the expected accuracy of the observations used to constraint the orbit: angular differences are below 1 mas thanks to VLBI tracking of the Cassini spacecraft and differences in geocentric distances are about 1 km over the observational interval.
For Uranus and Neptune, the differences INPOP13c-DE430 and DE430-DE423 are compatible with the expected accuracy of the observations used for the construction of the ephemerides as given by the Table 2 maximum differences for the contemporary interval and by the postfit residuals of Table 8.
For Pluto, the large differences after 1960 pictured on Figure 8 and on Figure 9 are essentially induced by the important dispersions of photographic residuals used before the sixties for fitting the ephemerides. By the scanning of the photographic plates and by making a new analysis in using the future Gaia catalogue, one should be able to reduce drastically the noise of these data sets and then the uncertainties of the ephemerides for Pluto orbit. The arrival of the New Horizon spacecraft should help as well especially for the estimation of the size of the darwf planet’s orbit. One can note however the good agreement of the ephemerides for the recent period thanks to the stellar occultation used for INPOP and DE constructions.
| INPOP13c | INPOP10e |
|---|---|
![[Uncaptioned image]](/html/1405.0484/assets/figures/VKG13b.jpg) |
![[Uncaptioned image]](/html/1405.0484/assets/figures/VKG10e.jpg) |
![[Uncaptioned image]](/html/1405.0484/assets/figures/MGS13b.jpg) |
![[Uncaptioned image]](/html/1405.0484/assets/figures/MGS10e.jpg) |
![[Uncaptioned image]](/html/1405.0484/assets/figures/ODY13b.jpg) |
![[Uncaptioned image]](/html/1405.0484/assets/figures/ODY10e.jpg) |
| INPOP13c | INPOP10e |
|---|---|
![[Uncaptioned image]](/html/1405.0484/assets/figures/mars13b_4.jpg) |
![[Uncaptioned image]](/html/1405.0484/assets/figures/mars10e_4.jpg) |
![[Uncaptioned image]](/html/1405.0484/assets/figures/MSG_inpop13b.jpg) |
![[Uncaptioned image]](/html/1405.0484/assets/figures/MSG_10e.jpg) |
![[Uncaptioned image]](/html/1405.0484/assets/figures/VEX13b.jpg) |
![[Uncaptioned image]](/html/1405.0484/assets/figures/VEX10e.jpg) |
3 Asteroid masses
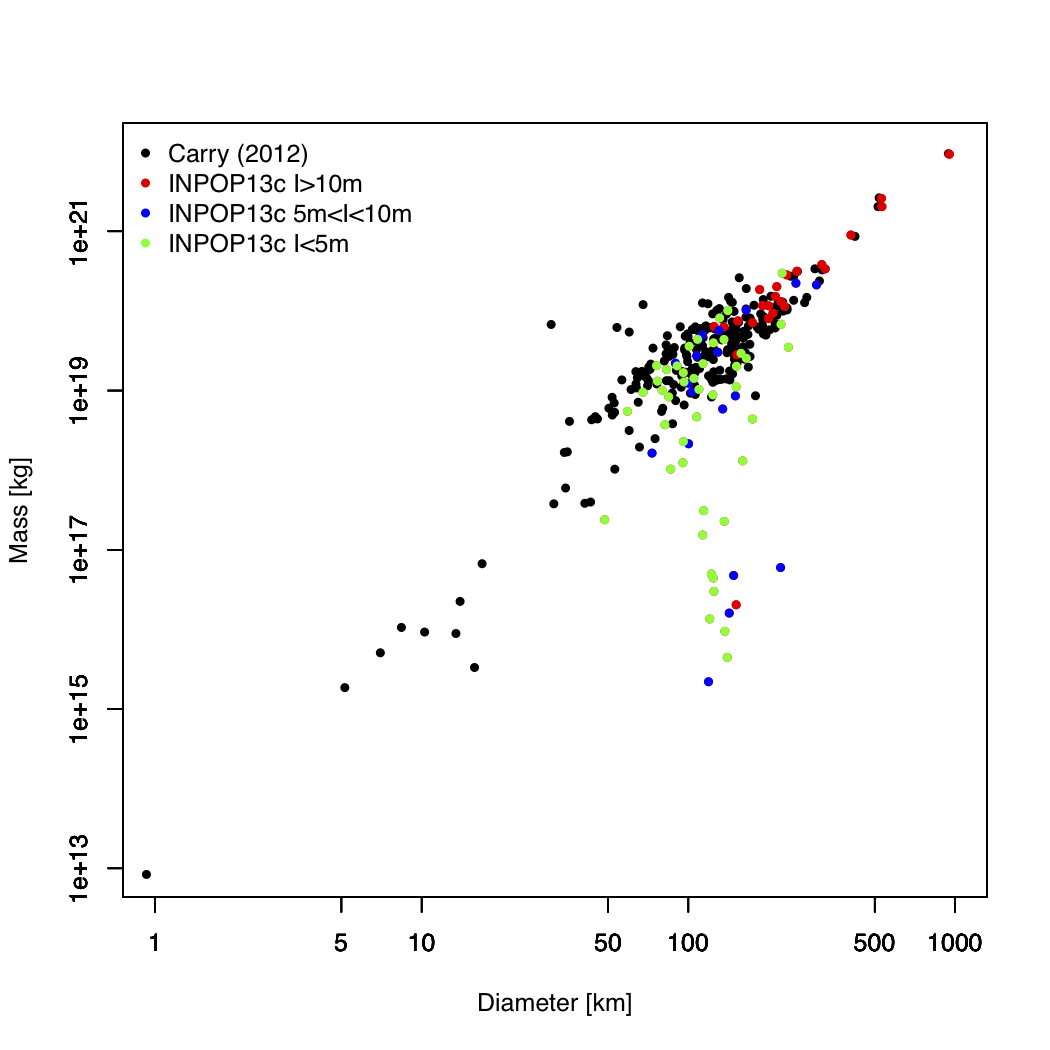
139 asteroids are used in INPOP13c with 87 asteroid masses actually estimated during the fit, 52 being fixed to masses derived from taxonomic classes and diameter estimations or to better mass estimations deduced from binary system or spacecraft flybys. No asteroid ring is considered in INPOP13c. Comparisons between the 87 asteroid masses obtained during the INPOP13c fit and masses collected by [1] are presented in Tables 10 and 11 and in Figure 10. Figure 10 pictures a log-log relation between asteroid masses and asteroid diameters as shown in [1] and [2]. Such a trend is a good tool for analyzing the quality of asteroid masses deduced from INPOP13c. One can first notice than asteroids having their masses deduced from planetary ephemerides have their diameters bigger than 50 kilometers. Only big objects can induce perturbations detectable thought inner planet observations.
Three families of asteroids are furthermore be considered on Figure 10: the big perturbers (in red) of the Earth-Mars distances inducing more than 10 meters on the geocentric distances of Mars over a 40-year interval (as defined in [7]), the asteroids inducing a modification between 5 to 10 meters of the geocentric distances of Mars over the same interval of time (in blue) and the small perturbers (in green) modifying the Earth-Mars distances by less than 5 meters. As it appears clearly on Figure 10, the estimations of the first two classes are quite compatible with the one obtained by [1] and follow generally well the trend with the diameters. The estimations of the smallest perturbers are, however, less compatible with the trend.
The 42 masses of the first two classes of asteroids are gathered in Table 10. They represent 48% of the whole sample of the estimated masses and can be used for computing mean values of C, S, B and M densities as defined in [2] and mean cumulated masses for each of these classes as the results given in Table 6. The comparison to [1] obtained for the same sample of 42 masses confirms the consistency of the two samples. The comparison to estimations published by [2] and obtained for a whole population of asteroids indicates that most of the perturbing objects belong to the C and S taxonomic classes when a lack of M-class objects seems to correspond to less perturbing objects (small or far from Mars).
4 Lunar Laser Ranging
INPOP13c is fitted to LLR observations from 1969 to 2013. Compared to INPOP10e, more than 700 observations from CERGA, 800 from Apollo and 50 from Matera have beed added in the fit. The number of parameters fitted is now 66 instead of 65 for INPOP10e:
-
•
an offset for Apollo observations between december 2010 and april 2012 has been added
-
•
because of its better significance (ratio between the fitted value and the formal error), the Moon’s Love number is now fitted instead of Moon’s coefficient of potential (fixed to LP150Q value)
The values of all fitted parameters are given in Tables 12, 13 and 14. Their formal errors (1) come from the covariance matrix of the least square fit and can be much smaller than the physical uncertainties.
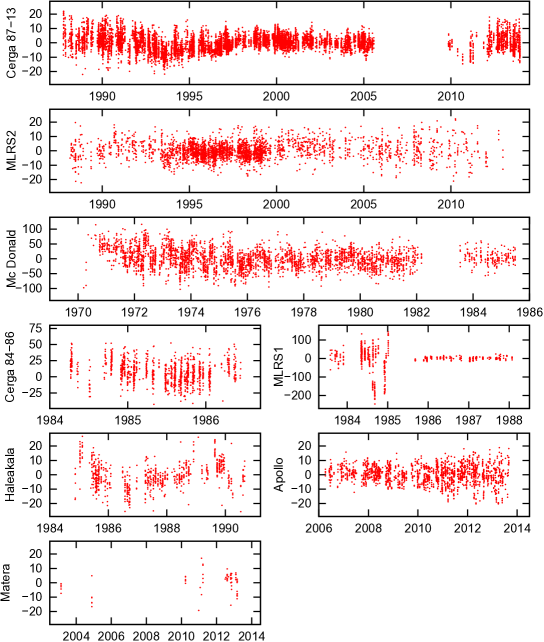
On table 15 and figure 11 are given the LLR residuals. The degradation on recent data was already noticed with INPOP10e, but it is amplified with INPOP13c. For Cerga, the residuals grow from 4 to 6 centimeters between before and after 2009. For Apollo, the standard deviation grows continuously from 5 to 7.6 centimeters between 2006 and 2013. These increases of residuals would vanish with the fit of the tectonic plate motion for the corresponding stations, but we think the problem comes from the dynamical model, with a lack that can be partly compensated by a change in station motion.
On table 16 is shown a comparison of residuals between INPOP13c and several JPL’s solutions. JPL’s residuals are here obtained by applying the same reduction process (model of light propagation) to the planetary and lunar motions of the corresponding JPL’s solution. Only parameters involved in the reduction (see tables 13 and 14) are refitted. Residuals computed here are then certainly different from the ones computed directly by the JPL. One can see for DE421 a small degradation on Apollo data (from 4.5 cm to 5.1 cm); this solution was released in 2008 and it is normal to observe such a degradation on data that were not available at this time, and thus not used to constrain the parameters. It should be stressed that DE421 residuals are better than the ones of INPOP13c (even on recent data); it thus demonstrates the better quality (extrapolation capabilities) of DE421 dynamical model. For DE430, residuals are improved relativ to the ones of DE421; the dynamical model is slightly different (Earth tides, degrees of Moon’s and Earth’s potential) and it is fitted to the latest data. The bad behaviour of INPOP13c compared to JPL’s solutions is thus certainly due to a lack in the dynamical model (missing interaction?). The main difference between INPOP and JPL’s solutions is the presence (since DE418) of a lunar liquid core interacting with the mantle. Its equations are given in [13, eqs. 6,7,8]:
| (1) |
In these expressions,
-
•
and are respectively the inertia matrices of the mantle and the fluid core
-
•
and are the instant rotation vectors of the mantle and the fluid core
-
•
is the gravitational torque exerted by external bodies (Sun, Earth, …)
-
•
is the torque due to interactions at core/mantle boundary
-
•
and are the moments of inertia of the axisymetrical fluid core
-
•
is the direction of the pole of the mantle
-
•
is a friction coefficient at the core/mantle boundary
Analysis of DE431 residuals are then interesting. This solution, similar to DE430, is briefly described in [5] and [5]. In order to provide a long term solution (especially in the past), the friction torque at the lunar core/mantle boundary has been neglected ( in eq. 1). In table 16, one can see that its behaviour on recent data is the same as INPOP13c’s one, with standard deviations of residuals increasing with time for both Apollo and Cerga; the values reached are often greater than with INPOP13c. This indicates that not only a lunar core is necessary, but also that the friction torque at the core/mantle boudary must not be neglicted.
INPOP13c does not take into account any lunar core yet, even if expressions 1 are already implemented in the equations of motions. The problem is that with fixed values of physical parameters (, and ) close to DE421, DE423 or DE430 ones, after fit of 69 other parameters (the 66 ones fitted in INPOP13c and the initial conditions of the core’s instant vector of rotation), there is no significant improvement on residuals. This is why the Lunar core has not been activated for INPOP13c.
In conclusion, INPOP13c is not a solution as good as DE430 (or DE421) on LLR observations, even if it is improved compared to INPOP10e (fitted to more recent data). A work is still in progress in order to determine optimal values for the physical parameters of the Lunar core, certainly farther away from JPL’s ones.
| C-Class | S-Class | B-Class | M-Class | V-Class | |
|---|---|---|---|---|---|
| This paper | |||||
| Cumulated mass [kg] | 1.1973e+21 | 1.61e+20 | 2.04e+20 | 2.2e+19 | 2.590e+20 |
| % of total mass | 65% | 9 % | 11 % | 1.2 % | 14 % |
| % without CPVB | 14 % | 9 % | 0 % | 1.2% | 0 % |
| Density [g.cm-3] | 2.19 1.89 | 2.89 1.79 | 2.59 | 2.40 2.26 | 3.32 |
| (DeMeo and Carry 2013)[2] | |||||
| Cumulated mass [kg] | 1.42e+21 | 2.27e+20 | 3.0e+20 | 8.82+19 | 2.59e+20 |
| % of total mass | 52% | 8.4 % | 11.10 % | 3.26 % | 9.59 % |
| % without CPVB | 14 % | 8.4 % | 3.5 % | 3.26 % | 0.01 % |
| Density [g.cm-3] | 1.33 0.58 | 2.72 0.54 | 2.38 0.45 | 3.49 1.00 | 1.93 1.07 |
| (Carry 2012)[1] | |||||
| Cumulated mass [kg] | 1.18864e+21 | 1.5007e+20 | 2.04e+20 | 2.863e+19 | 2.63e+20 |
| % of total mass | 65% | 8.2 % | 11.10 % | 1.56 % | 14 % |
| % without CPVB | 13% | 8.2% | 0 % | 1.56% | 0 % |
| Density [g.cm-3] | 1.54 0.55 | 2.85 1.04 | 2.30 | 4.53 2.38 | 3.00 |
| Type of data | Nbr | Time Interval | INPOP10e | INPOP13c | |||
| Mercury | range [m] | 462 | 1971.29 - 1997.60 | -45.3 | 872.499 | -101.524 | 861.494 |
| Mercury Mariner | range [m] | 2 | 1974.24 - 1976.21 | -31.850 | 109.191 | -196.405 | 19.636 |
| Mercury flybys Mess | ra [mas] | 3 | 2008.03 - 2009.74 | 0.738 | 1.485 | 0.901 | 1.355 |
| Mercury flybys Mess | de [mas] | 3 | 2008.03 - 2009.74 | 2.422 | 2.517 | 2.472 | 2.408 |
| Mercury flybys Mess | range [m] | 3 | 2008.03 - 2009.74 | -5.067 | 5.804 | 3.190 | 7.699 |
| Venus | VLBI [mas] | 46 | 1990.70 - 2010.86 | 1.590 | 2.602 | 1.591 | 2.575 |
| Venus | range [m] | 489 | 1965.96 - 1990.07 | 500.195 | 2234.924 | 504.569 | 2237.636 |
| Venus Vex | range [m] | 22145 | 2006.32 - 2009.78 | -0.004 | 4.093 | 1.042 | 5.079 |
| Mars | VLBI [mas] | 96 | 1989.13 - 2007.97 | -0.004 | 0.407 | 0.018 | 0.418 |
| Mars Mex | range [m] | 13842 | 2005.17 - 2009.78 | 0.485 | 3.189 | -0.465 | 1.840 |
| Mars MGS | range [m] | 13091 | 1999.31 - 2006.83 | -0.341 | 3.805 | 0.362 | 3.777 |
| Mars Ody | range [m] | 5664 | 2006.95 - 2010.00 | 0.280 | 4.155 | 1.55 | 2.30 |
| Mars Path | range [m] | 90 | 1997.51 - 1997.73 | -6.289 | 13.663 | 19.324 | 14.096 |
| Mars Vkg | range [m] | 1257 | 1976.55 - 1982.87 | -1.391 | 39.724 | -1.494 | 41.189 |
| Jupiter | VLBI [mas] | 24 | 1996.54 - 1997.94 | -0.291 | 11.068 | -0.450 | 11.069 |
| Jupiter | ra [arcsec] | 6532 | 1914.54 - 2008.49 | -0.039 | 0.297 | -0.039 | 0.297 |
| Jupiter | de [arcsec] | 6394 | 1914.54 - 2008.49 | -0.048 | 0.301 | -0.048 | 0.301 |
| Jupiter flybys | ra [mas] | 5 | 1974.92 - 2001.00 | 2.368 | 3.171 | 2.554 | 2.961 |
| Jupiter flybys | de [mas] | 5 | 1974.92 - 2001.00 | -10.825 | 11.497 | -10.853 | 11.425 |
| Jupiter flybys | range [m] | 5 | 1974.92 - 2001.00 | -907.0 | 1646.210 | -985.957 | 1775.627 |
| Saturne | ra [arcsec] | 7971 | 1913.87 - 2008.34 | -0.006 | 0.293 | -0.006 | 0.293 |
| Saturne | de [arcsec] | 7945 | 1913.87 - 2008.34 | -0.012 | 0.266 | -0.012 | 0.266 |
| Saturne VLBI Cass | ra [mas] | 10 | 2004.69 - 2009.31 | 0.215 | 0.637 | 0.113 | 0.630 |
| Saturne VLBI Cass | de [mas] | 10 | 2004.69 - 2009.31 | 0.280 | 0.331 | -0.115 | 0.331 |
| Saturne Cassini | ra [mas] | 31 | 2004.50 - 2007.00 | 0.790 | 3.879 | 0.663 | 3.883 |
| Saturne Cassini | de [mas] | 31 | 2004.50 - 2007.00 | 6.472 | 7.258 | 5.906 | 7.284 |
| Saturne Cassini | range [m] | 31 | 2004.50 - 2007.00 | -0.013 | 18.844 | 0.082 | 23.763 |
| Type of data | Nbr | Time Interval | INPOP10e | INPOP13c | |||
| Uranus | ra [arcsec] | 13016 | 1914.52 - 2011.74 | 0.007 | 0.205 | 0.007 | 0.205 |
| Uranus | de [arcsec] | 13008 | 1914.52 - 2011.74 | -0.006 | 0.234 | -0.006 | 0.234 |
| Uranus flybys | ra [arcsec] | 1 | 1986.07 - 1986.07 | -0.021 | 0.000 | -0.021 | 0.000 |
| Uranus flybys | de [arcsec] | 1 | 1986.07 - 1986.07 | -0.028 | 0.000 | -0.028 | 0.000 |
| Uranus flybys | range [m] | 1 | 1986.07 - 1986.07 | 19.738 | 0.000 | 20.771 | 0.000 |
| Neptune | ra [arcsec] | 5395 | 1913.99 - 2007.88 | 0.000 | 0.258 | 0.003 | 0.258 |
| Neptune | de [arcsec] | 5375 | 1913.99 - 2007.88 | -0.000 | 0.299 | -0.002 | 0.299 |
| Neptune flybys | ra [arcsec] | 1 | 1989.65 - 1989.65 | -0.012 | 0.000 | -0.011 | 0.000 |
| Neptune flybys | de [arcsec] | 1 | 1989.65 - 1989.65 | -0.005 | 0.000 | -0.005 | 0.000 |
| Neptune flybys | range [m] | 1 | 1989.65 - 1989.65 | 69.582 | 0.000 | 51.507 | 0.000 |
| Pluto | ra [arcsec] | 2458 | 1914.06 - 2008.49 | 0.034 | 0.654 | 0.020 | 0.574 |
| Pluto | de [arcsec] | 2462 | 1914.06 - 2008.49 | 0.007 | 0.539 | 0.001 | 0.525 |
| Pluto Occ | ra [arcsec] | 13 | 2005.44 - 2009.64 | 0.003 | 0.047 | -0.100 | 0.044 |
| Pluto Occ | de [arcsec] | 13 | 2005.44 - 2009.64 | -0.006 | 0.018 | 0.000 | 0.027 |
| Pluto HST | ra [arcsec] | 5 | 1998.19 - 1998.20 | -0.033 | 0.043 | -0.018 | 0.044 |
| Pluto HST | de [arcsec] | 5 | 1998.19 - 1998.20 | 0.028 | 0.048 | -0.026 | 0.048 |
| Type of data | Nbr | Time Interval | INPOP10e | INPOP13c | |||
| Mercure Messenger | range [m] | 371 | 2011.39 - 2013.20 | 7.239 | 189.739 | 4.008 | 12.387 |
| Venus Vex | range [m] | 2825 | 2009.78 - 2011.45 | 1.84 | 16.54 | 5.12 | 15.70 |
| Mars Mex | range [m] | 12268 | 2009.78 - 2013.00 | 3.646 | 23.296 | 1.234 | 5.571 |
| Mars Ody | range [m] | 3510 | 2010.00 - 2012.00 | 4.834 | 9.586 | 0.741 | 1.778 |
| IAU designation | INPOP13c | 1- | Impact | diam | Carry 2012 | 1- | T-Class |
|---|---|---|---|---|---|---|---|
| kg | kg | m | km | kg | kg | ||
| 4 | 2.590564e+20 | 1.157098e+18 | 1198.9530440 | 530.00 | 2.63e+20 | 5.00e+18 | V |
| 1 | 9.291844e+20 | 3.844558e+18 | 793.7412482 | 952.40 | 9.44e+20 | 6.00e+18 | G |
| 2 | 2.041335e+20 | 2.714066e+18 | 146.2695538 | 532.00 | 2.04e+20 | 4.00e+18 | B |
| 324 | 1.138045e+19 | 5.419632e+17 | 93.5357526 | 229.44 | 1.03e+19 | 1.00e+18 | CP |
| 10 | 8.980667e+19 | 7.853611e+18 | 77.0025537 | 407.12 | 8.63e+19 | 5.20e+18 | C |
| 19 | 8.003182e+18 | 9.346277e+17 | 59.0689816 | 200.00 | 8.60e+18 | 1.46e+18 | G |
| 3 | 2.834174e+19 | 1.300802e+18 | 55.6392528 | 233.92 | 2.73e+19 | 2.90e+18 | S |
| 704 | 3.821399e+19 | 4.131905e+18 | 34.4922565 | 316.62 | 3.28e+19 | 4.50e+18 | F |
| 532 | 1.310927e+19 | 1.512167e+18 | 32.7144140 | 222.39 | 1.15e+19 | 2.80e+18 | S |
| 9 | 1.165527e+19 | 1.205371e+18 | 29.6062727 | 190.00 | 8.39e+18 | 1.67e+18 | S |
| 7 | 1.162482e+19 | 9.666165e+17 | 27.8218292 | 199.83 | 1.29e+19 | 2.10e+18 | S |
| 29 | 1.517009e+19 | 1.903232e+18 | 26.6731763 | 212.22 | 1.29e+19 | 2.00e+18 | S |
| 13 | 9.372223e+18 | 2.364485e+18 | 22.0382227 | 207.64 | 8.82e+18 | 4.25e+18 | G |
| 15 | 3.149656e+19 | 1.569941e+18 | 21.5545880 | 255.33 | 3.14e+19 | 1.80e+18 | S |
| 6 | 1.855289e+19 | 1.282286e+18 | 21.1504947 | 185.18 | 1.39e+19 | 1.00e+18 | S |
| 14 | 2.813508e+18 | 9.790674e+17 | 18.1615646 | 152.00 | 2.91e+18 | 1.88e+18 | S |
| 11 | 7.499181e+18 | 1.387315e+18 | 17.3007697 | 153.33 | 5.91e+18 | 4.50e+17 | S |
| 8 | 6.288016e+18 | 7.000950e+17 | 12.6635308 | 135.89 | 9.17e+18 | 1.75e+18 | S |
| 45 | 2.021796e+19 | 2.393618e+18 | 11.7902641 | 214.63 | 5.79e+18 | 1.40e+17 | FC |
| 41 | 7.131347e+18 | 6.700157e+17 | 11.5682732 | 174.00 | 6.31e+18 | 1.10e+17 | C |
| 405 | 6.376346e+18 | 3.743249e+17 | 11.3784687 | 124.90 | 1.38e+18 | 1.40e+17 | C |
| 145 | 2.042610e+15 | 2.192145e+15 | 11.0486157 | 151.14 | 2.08e+18 | 5.70e+17 | C |
| 511 | 3.371614e+19 | 5.716552e+18 | 10.2480612 | 326.06 | 3.38e+19 | 1.02e+19 | C |
| 52 | 2.124138e+19 | 4.905582e+18 | 9.8407320 | 302.50 | 2.38e+19 | 5.80e+18 | CF |
| 16 | 2.229501e+19 | 3.642799e+18 | 9.7005515 | 253.16 | 2.72e+19 | 7.50e+18 | M |
| 419 | 3.030678e+18 | 9.012887e+17 | 9.5851372 | 129.01 | 1.72e+18 | 3.40e+17 | F |
| 23 | 2.730810e+18 | 5.714392e+17 | 9.0667512 | 107.53 | 1.96e+18 | 9.00e+16 | S |
| 488 | 8.576408e+17 | 3.383274e+18 | 8.6136830 | 150.13 | 2.48e+18 | 1.14e+18 | C |
| 230 | 4.342298e+18 | 1.927946e+18 | 7.6195204 | 108.99 | 1.89e+18 | 1.90e+17 | S |
| IAU designation | INPOP13c | 1- | Impact | diam | Carry 2012 | 1- | T-Class |
|---|---|---|---|---|---|---|---|
| kg | kg | m | km | kg | kg | ||
| 187 | 5.686063e+18 | 7.819741e+17 | 7.5924498 | 130.40 | 1.80e+18 | 8.50e+17 | C |
| 111 | 5.869674e+17 | 1.980823e+18 | 6.9848015 | 134.55 | 1.76e+18 | 4.40e+17 | C |
| 109 | 2.209681e+18 | 5.165756e+17 | 6.8652431 | 89.44 | NA | NA | GC |
| 42 | 2.145282e+17 | 6.694597e+17 | 6.8289220 | 100.20 | 1.58e+18 | 5.20e+17 | S |
| 63 | 9.693634e+17 | 2.797805e+17 | 6.4510297 | 103.14 | 1.53e+18 | 1.50e+17 | S |
| 12 | 4.976460e+18 | 4.138827e+17 | 6.1587944 | 112.77 | 2.45e+18 | 4.60e+17 | S |
| 144 | 1.605988e+15 | 1.992285e+15 | 6.0865220 | 142.38 | 5.30e+18 | 1.20e+18 | C |
| 5 | 2.204297e+14 | 4.293857e+17 | 5.5329555 | 119.07 | 2.64e+18 | 4.40e+17 | S |
| 48 | 5.994443e+15 | 3.760429e+16 | 5.3602865 | 221.80 | 6.12e+18 | 2.96e+18 | CG |
| 59 | 1.025852e+19 | 3.278702e+16 | 5.3247597 | 164.80 | 3.00e+18 | 5.00e+17 | CP |
| 30 | 1.233848e+18 | 2.117636e+18 | 5.3223063 | 100.15 | 1.74e+18 | 4.90e+17 | S |
| 51 | 4.764145e+15 | 5.488586e+17 | 5.1088310 | 147.86 | 2.48e+18 | 8.60e+17 | CU |
| 516 | 1.638896e+17 | 7.806427e+17 | 5.0514023 | 73.10 | 1.43e+18 | 1.33e+18 | M |
| IAU designation | INPOP13c | 1- | Impact | diam | Carry 2013 | 1- |
|---|---|---|---|---|---|---|
| kg | kg | m | km | kg | kg | |
| 89 | 2.017804e+18 | 1.158577e+18 | 4.8149336 | 151.46 | 6.71e+18 | 1.82e+18 |
| 451 | 2.979651e+19 | 6.217767e+18 | 4.7418532 | 224.96 | 1.09e+19 | 5.30e+18 |
| 313 | 1.283921e+18 | 7.546575e+17 | 4.7044991 | 96.34 | NA | NA |
| 554 | 2.286580e+17 | 5.142521e+17 | 4.7036067 | 95.87 | 6.59e+17 | 6.60e+16 |
| 107 | 6.787732e+18 | 2.890148e+18 | 4.6303383 | 222.62 | 1.12e+19 | 3.00e+17 |
| 65 | 3.495611e+18 | 1.697773e+18 | 4.5364039 | 237.26 | 1.36e+19 | 3.10e+18 |
| 21 | 1.677741e+18 | 1.476184e+18 | 4.5269608 | 95.76 | 1.70e+18 | 1.00e+16 |
| 694 | 2.041762e+18 | 8.867518e+17 | 4.1874011 | 90.78 | NA | NA |
| 120 | 4.385643e+17 | 5.288536e+18 | 3.9064935 | 174.10 | NA | NA |
| 46 | 3.971305e+18 | 1.247291e+18 | 3.5594356 | 124.14 | 5.99e+18 | 5.00e+17 |
| 37 | 4.399527e+18 | 3.294685e+17 | 3.5514669 | 108.35 | NA | NA |
| 216 | 4.422420e+15 | 6.267640e+17 | 3.4827870 | 124.00 | 4.64e+18 | 2.00e+17 |
| 164 | 1.420331e+18 | 2.912094e+17 | 3.4332830 | 104.87 | 9.29e+17 | 7.76e+17 |
| 410 | 8.832544e+17 | 2.119148e+17 | 3.3882431 | 123.57 | 6.24e+18 | 3.00e+17 |
| 56 | 1.536408e+16 | 5.755360e+17 | 3.2535822 | 113.24 | 4.61e+18 | 0.00e+00 |
| 34 | 2.178007e+18 | 3.787477e+17 | 3.2274053 | 113.54 | 3.66e+18 | 3.00e+16 |
| 95 | 4.382951e+18 | 6.566998e+17 | 3.0162129 | 136.04 | NA | NA |
| 268 | 4.455482e+14 | 2.584680e+14 | 2.8481781 | 139.89 | 3.25e+18 | 2.26e+18 |
| 814 | 1.032312e+18 | 1.703245e+18 | 2.8300815 | 109.56 | NA | NA |
| 209 | 1.310480e+17 | 6.530118e+18 | 2.5293436 | 159.94 | 4.59e+18 | 7.42e+18 |
| 337 | 5.473158e+17 | 1.595918e+17 | 2.4044223 | 59.11 | 1.08e+18 | 1.60e+17 |
| 386 | 2.542494e+18 | 1.501009e+18 | 2.3365190 | 165.01 | 8.14e+18 | 1.58e+18 |
| 739 | 4.680385e+17 | 1.611940e+18 | 2.2048585 | 107.53 | 1.16e+18 | 1.07e+18 |
| 602 | 3.002039e+15 | 2.484931e+15 | 2.0856729 | 124.72 | 1.02e+19 | 5.00e+17 |
| 141 | 8.167383e+18 | 1.558767e+18 | 1.9991831 | 131.03 | 8.25e+18 | 5.77e+18 |
| 804 | 2.932829e+18 | 9.832968e+17 | 1.9193459 | 157.58 | 5.00e+18 | 1.78e+18 |
| 776 | 1.110207e+18 | 8.848554e+17 | 1.8941086 | 151.17 | 2.20e+18 | 2.71e+18 |
| 127 | 4.973809e+15 | 1.581185e+16 | 1.7862193 | 122.00 | 3.08e+18 | 1.35e+18 |
| 308 | 1.010230e+19 | 2.356410e+18 | 1.7849603 | 140.69 | NA | NA |
| 762 | 9.469866e+14 | 5.543771e+14 | 1.7827179 | 137.08 | 1.40e+18 | 1.00e+17 |
| 72 | 1.031184e+17 | 4.485403e+17 | 1.7669342 | 85.90 | 3.32e+18 | 8.49e+18 |
| 455 | 8.340879e+17 | 8.288418e+17 | 1.6642197 | 84.41 | 1.19e+18 | 1.20e+17 |
| 626 | 3.600162e+18 | 1.432526e+18 | 1.4705847 | 100.73 | 3.24e+18 | 1.30e+18 |
| 503 | 3.725514e+17 | 4.182849e+17 | 1.2278253 | 81.68 | 2.85e+18 | 3.40e+17 |
| 62 | 1.242051e+17 | 3.255760e+18 | 1.1981127 | 95.39 | NA | NA |
| 97 | 1.830943e+18 | 1.484500e+18 | 1.1452324 | 82.83 | 1.33e+18 | 1.30e+17 |
| 675 | 2.053879e+18 | 1.689563e+18 | 0.8847463 | 76.00 | 1.20e+19 | 2.40e+18 |
| 618 | 1.354581e+15 | 7.772176e+14 | 0.8620717 | 120.29 | NA | NA |
| 250 | 1.008119e+18 | 3.968719e+17 | 0.8082673 | 79.75 | NA | NA |
| 287 | 9.492653e+17 | 2.409003e+17 | 0.7241231 | 67.60 | NA | NA |
| 196 | 2.272704e+16 | 6.600523e+17 | 0.7131689 | 136.39 | 4.00e+18 | 1.53e+18 |
| IAU designation | INPOP13c | 1- | Impact | diam | Carry 2013 | 1- |
|---|---|---|---|---|---|---|
| kg | kg | m | km | kg | kg | |
| 33 | 3.321441e+18 | 1.068539e+18 | 0.6208345 | NA | 6.20e+18 | 7.40e+17 |
| 196 | 2.272704e+16 | 1.207070e+15 | 0.7131689 | 136.39 | 4.00e+18 | 1.53e+18 |
| 779 | 1.311013e+18 | 3.501955e+17 | 0.5186778 | 76.62 | NA | NA |
| 388 | 3.106367e+16 | 5.365290e+16 | 0.4414599 | 114.17 | NA | NA |
| 204 | 2.385408e+16 | 8.976265e+16 | 0.2667205 | 48.57 | 6.00e+17 | 1.81e+18 |
| Name | Value | Formal error () |
|---|---|---|
| Reflector | Value | Formal error () | |
|---|---|---|---|
| x | |||
| Apollo XI | y | ||
| z | |||
| x | |||
| Apollo XIV | y | ||
| z | |||
| x | |||
| Apollo XV | y | ||
| z | |||
| x | |||
| Lunakhod 1 | y | ||
| z | |||
| x | |||
| Lunakhod 2 | y | ||
| z | |||
| Love number |
| Station | Value | Formal error () | |
|---|---|---|---|
| x | |||
| Cerga | y | ||
| z | |||
| x | |||
| Mc Donald | y | ||
| z | |||
| x | |||
| MLRS1 | y | ||
| z | |||
| x | |||
| MLRS2 | y | ||
| z | |||
| x | |||
| Haleakala (rec.) | y | ||
| z | |||
| x | |||
| Apollo | y | ||
| z | |||
| x | |||
| Matera | y | ||
| z |
| Station | Period | Mean | Std. dev. | Na | Nk | Nr |
|---|---|---|---|---|---|---|
| Cerga | 1984-1986 | 6.96 | 16.02 | 1188 | 1161 | 27 |
| Cerga | 1987-1995 | -0.58 | 6.58 | 3443 | 3411 | 32 |
| Cerga | 1995-2006 | 0.06 | 3.97 | 4881 | 4845 | 36 |
| Cerga | 2009-2013 | 0.08 | 6.08 | 999 | 990 | 9 |
| Mc Donald | 1969-1983 | -0.23 | 31.86 | 3410 | 3302 | 108 |
| Mc Donald | 1983-1986 | 4.02 | 20.60 | 194 | 182 | 12 |
| MLRS1 | 1983-1984 | 5.92 | 29.43 | 44 | 44 | 0 |
| MLRS1 | 1984-1985 | -7.25 | 77.25 | 368 | 358 | 10 |
| MLRS1 | 1985-1988 | 0.10 | 7.79 | 219 | 207 | 12 |
| MLRS2 | 1988-1996 | -0.43 | 5.36 | 1199 | 1166 | 33 |
| MLRS2 | 1996-2012 | 0.15 | 5.81 | 2454 | 1972 | 482 |
| Haleakala | 1984-1990 | -0.38 | 8.63 | 770 | 739 | 31 |
| Apollo | 2006-2010 | 0.25 | 4.92 | 941 | 940 | 1 |
| Apollo | 2010-2012 | 0.00 | 6.61 | 514 | 414 | 10 |
| Apollo | 2012-2013 | -0.62 | 7.62 | 359 | 359 | 0 |
| Matera | 2003-2013 | 0.13 | 7.05 | 83 | 70 | 13 |
| Station | Period | INPOP13c | DE421 | DE430 | DE431 |
|---|---|---|---|---|---|
| Cerga | 1984-1986 | 16.02 | 14.56 | 14.55 | 14.19 |
| Cerga | 1987-1995 | 6.58 | 5.87 | 5.64 | 6.27 |
| Cerga | 1995-2006 | 3.97 | 3.97 | 3.96 | 4.91 |
| Cerga | 2009-2013 | 6.08 | 3.84 | 3.52 | 6.94 |
| Mc Donald | 1969-1983 | 31.86 | 30.38 | 30.15 | 30.43 |
| Mc Donald | 1983-1986 | 20.60 | 19.54 | 19.83 | 19.58 |
| MLRS1 | 1983-1984 | 29.43 | 27.86 | 27.68 | 28.02 |
| MLRS1 | 1984-1985 | 77.25 | 73.80 | 72.70 | 73.85 |
| MLRS1 | 1985-1988 | 7.79 | 5.54 | 5.45 | 5.96 |
| MLRS2 | 1988-1996 | 5.36 | 5.16 | 4.88 | 5.49 |
| MLRS2 | 1996-2012 | 5.81 | 4.93 | 4.94 | 5.97 |
| Haleakala | 1984-1990 | 8.63 | 8.59 | 8.33 | 8.76 |
| Apollo | 2006-2010 | 4.92 | 4.47 | 4.15 | 6.02 |
| Apollo | 2010-2012 | 6.61 | 4.99 | 4.31 | 7.85 |
| Apollo | 2012-2013 | 7.62 | 5.09 | 4.43 | 8.95 |
| Matera | 2003-2013 | 7.05 | 5.21 | 5.76 | 7.21 |
References
- [1] B. Carry. Asteroid masses. Planetary and Space science, 525:533–538, November 2012.
- [2] F. E. DeMeo and B. Carry. The taxonomic distribution of asteroids from multi-filter all-sky photometric surveys. Icarus, 226:723–741, September 2013.
- [3] A. Fienga, J. Laskar, H. Manche, M. Gastineau, and A. Verma. DPAC INPOP final release: INPOP10e. ArXiv e-prints , 2012.
- [4] W. Folkner. Planetary ephemeris fit to Messenger encounters with Mercury. Technical report, JPL Interoffice Memorandum IOM 343.R-10-001, 2010.
- [5] W. M. Folkner, J. G. Williams, D. H. Boggs, R. S. Park, and P. Kuchynka. The Planetary and Lunar Ephemerides DE430 and DE431. Interplanetary Network Progress Report, 196:C1, February 2014.
- [6] A. S. Konopliv, S. W. Asmar, E. Carranza, W. L. Sjogren, and D. N. Yuan. Recent Gravity Models as a Result of the Lunar Prospector Mission. Icarus, 150:1–18, March 2001.
- [7] P. Kuchynka, J. Laskar, A. Fienga, and H. Manche. A ring as a model of the main belt in planetary ephemerides. A&A, 514:A96+, May 2010.
- [8] J.-C. Marty. Mars odyssey data release. Technical report, 2013. Private communication.
- [9] T. Morley. MEX and VEX data release, 2012. Private communication.
- [10] T. Morley. MEX and VEX data release, 2013. Private communication.
- [11] D. J. Tholen. Asteroid taxonomy from cluster analysis of Photometry. PhD in astronomy, Arizona Univ., Tucson., 1984.
- [12] A. K. Verma, A. Fienga, J. Laskar, H. Manche, and M. Gastineau. Use of MESSENGER radioscience data to improve planetary ephemeris and to test general relativity. A&A, 561:A115, January 2014.
- [13] J. G. Williams. Lunar Core and Mantle. What Does LLR See? In 16th International Workshop on Laser Ranging, October 2008.