The Broad-band X-ray Spectrum of IC 4329A from a Joint NuSTAR/Suzaku Observation
Abstract
We have obtained a deep, simultaneous observation of the bright, nearby Seyfert galaxy IC 4329A with Suzaku and NuSTAR. Through a detailed spectral analysis, we are able to robustly separate the continuum, absorption and distant reflection components in the spectrum. The absorbing column is found to be modest (), and does not introduce any significant curvature in the Fe K band. We are able to place a strong constraint on the presence of a broadened Fe K line ( with and ), though we are not able to constrain any of the parameters of a relativistic reflection model. These results highlight the range in broad Fe K line strengths observed in nearby, bright AGN (roughly an order of magnitude), and imply a corresponding range in the physical properties of the inner accretion disk in these sources. We have also updated our previously reported measurement of the high-energy cutoff of the hard X-ray emission using both observatories rather than just NuSTAR alone: . This high-energy cutoff acts as a proxy for the temperature of the coronal electron plasma, enabling us to further separate this parameter from the plasma’s optical depth and to update our results for these parameters as well. We derive with using a spherical geometry, with for a slab geometry, with both having an equivalent goodness-of-fit.
1 Introduction
X-ray observations of active galactic nuclei (AGN) elucidate many physical processes that drive the production of high-energy photons close to a supermassive black hole (SMBH). In addition to probing the properties of the corona in radio-quiet AGN, X-ray data can constrain the nature of the inner accretion flow by measuring the morphology of the Fe K line. This emission line, with a rest energy of for neutral iron, arises via fluorescence from the accretion disk, which is illuminated by the Compton-scattered continuum X-rays. Given the relatively high cosmic abundance of iron and its high fluorescent yield, coupled with the lack of other lines expected in that part of the spectrum, it is a reasonably “clean” probe of the kinematics of the accreting material.
Narrow (usually unresolved by CCD detectors, i.e., ) Fe K lines have been observed in the vast majority of Seyfert galaxies (Yaqoob & Padmanabhan 2004). In addition to their small width, the lack of variability implies that they originate from the illumination by the primary X-ray source of reprocessing material relatively far from the black hole, likely in the outer disk or torus of Seyfert unification schemes (Antonucci 1993; Urry & Padovani 1995). Indeed, this emission region has been spatially resolved in the Seyfert 2 AGN NGC 4945 (Marinucci et al. 2012), and it lies at a distance from the nucleus of ( for the black hole at its core, where ). The near ubiquity of these features suggests that this distant material is present in almost all Seyfert AGN. In some Seyfert galaxies the Fe K line appears to be broadened (to ), most likely by relativistic effects; e.g., MCG–6-30-15, first observed by Tanaka et al. (1995), and recently also confirmed in NGC 1365 (Risaliti et al. 2013). These sources are two of the best examples of AGN displaying a prominent red wing indicative of fluorescing material close to the innermost stable circular orbit (ISCO) in the accretion disk.
A broad Fe K line originating from material extending to the ISCO allows us to determine whether the black hole is rotating, and if so, to determine its spin and possibly direction as well (for recent reviews, see, e.g., Reynolds 2013 and Brenneman 2013). However, such broad, relativistic emission lines are not observed in all Seyferts observed with high signal-to-noise (S/N) (Nandra et al. 2007; de La Calle Pérez et al. 2010; Brenneman et al. 2012), possibly indicating the absence of relatively cold, Compton-thick gas close to the black hole (though the caveats to line detection detailed in Ballantyne 2010 should also be kept in mind).
Regardless of the mechanism by which they are determined, any inferences regarding the structure, location, and physical conditions of the accretion disk and the corona require a precise, high S/N measurement of the broad-band X-ray spectrum from to . This is necessary in order to disentangle various emission and absorption components contributing to the total observed X-ray emission, described above. A significant advance towards such measurements is provided by the deployment of the focusing hard X-ray telescopes onboard the NuSTAR observatory, the latest in the series of NASA’s Small Explorer satellites. This mission is sensitive in the bandpass of with the updated calibration, and provides a hundredfold improvement of sensitivity in the hard X-ray band over previous instruments (Harrison et al. 2013). The use of NuSTAR in conjunction with X-ray telescopes that are more sensitive at softer energies (e.g., XMM-Newton and Suzaku) yields the highest S/N ever achieved across the bandpass.
Equally important in deriving the physical properties of the disk and corona is the selection of a representative, bright target. One good candidate is the southern Seyfert 1.2 galaxy IC 4329A (, Willmer et al. 1991; , Kalberla et al. 2005; , de La Calle Pérez et al. 2010), which in the hard X-ray/soft -ray band appears similar to an average radio-quiet Seyfert (e.g., Zdziarski et al. 1996). The host galaxy is an edge-on spiral in a pair with IC 4329, separated by arcmin. IC 4329A was one of the first AGN observed to have a Compton reflection component in addition to its strong Fe K line (Piro, Yamauchi, & Matsuoka 1990). As with most other X-ray emitting Seyferts, it is variable, but the variability amplitude during a typical observation is modest: the root mean square fractional variability has been measured at in the RXTE band (Markowitz 2009), and in the band with Swift/BAT (Soldi et al. 2014). The average flux historically ranges from (Beckmann et al. 2006; Verrecchia et al. 2007). IC 4329A has been the subject of many X-ray observations, beginning with the analysis of its simultaneous ROSAT and OSSE spectrum (Zdziarski 1994; Madejski et al. 1995). In harder X-rays, the source has also been observed by BeppoSAX (Perola et al. 2002), ASCA+RXTE (Done, Madejski, & Życki 2000) and INTEGRAL (Molina et al. 2013), which have placed rough constraints on the high-energy cutoff of the power-law (a proxy for coronal temperature) at , and , respectively. Combining the non-simultaneous INTEGRAL and XMM-Newton data further constrained the cutoff energy to (Molina et al. 2009), while a combination of the XMM and BeppoSAX data yielded (Gondoin et al. 2001).
A detailed examination of the ASCA and simultaneous RXTE data revealed that the continuum is indeed described well by the model used to describe the ROSAT+OSSE data (either thermal or non-thermal Comptonization plus neutral, distant reflection), and that the Fe K line is moderately broadened and can be described by a Gaussian with FWHM of (Done et al. 2000). This is consistent with the conclusions of Dadina (2007), who noted a moderately broad Fe K line of similar width and equivalent widths up to in BeppoSAX data, paired with measured reflection fractions up to . Both the ASCA and ROSAT data, as well as the XMM-Newton observations (Steenbrugge et al. 2005), suggest that the soft X-ray spectrum is absorbed by a combination of neutral and partially ionized gas, with a total column of . This is comparable to the host galaxy’s ISM column density (Wilson & Penston 1979). After accounting for the reflection component, the source shows some modest spectral variability of the primary continuum, being softer at higher flux levels (Madejski, Done, & Życki 2001; Miyazawa, Haba, & Kunieda 2009; Markowitz 2009).
Here, we report on results from our simultaneous Suzaku and NuSTAR observation of IC 4329A. We discussed our measurements of the properties of the underlying continuum in Brenneman et al. (2014) (hereafter referred to as paper I), and in this work we update those values and focus on constraining the reprocessing components. In §2, we report on the Suzaku and NuSTAR observations, and in §3 we present a brief timing analysis of the data. Our spectral analysis follows in §4, with a discussion of the inferred accretion disk properties and their implications in §5.
2 Observations and Data Reduction
IC 4329A was observed quasi-continuously and contemporaneously by Suzaku and NuSTAR from August 12-16, 2012 in normal clocking mode. The observations had a roughly efficiency due to Earth occultations. After eliminating Earth occultations, passages through the South Atlantic Anomaly (SAA) and other periods of high background, the Suzaku observation totaled of on-source time from August 13-15, while the NuSTAR observation totaled of on-source time from August 12-16. Count rates, total counts and signal-to-noise (S/N) ratio for each instrument from the two observatories is listed in Table 1.
| Instrument | Exposure (ks) | Count Rate (cts/s) | Total Counts | S/N |
|---|---|---|---|---|
| Suzaku/XIS 0 | ||||
| Suzaku/XIS 1 | ||||
| Suzaku/XIS 3 | ||||
| Suzaku/PIN | ||||
| NuSTAR/FPMA | ||||
| NuSTAR/FPMB |
The Suzaku/XIS data were taken with the telescope at the XIS nominal aimpoint, and were reduced as per the ABC Guide111http://heasarc.gsfc.nasa.gov/docs/suzaku/analysis/abc/, using the latest versions of the CALDB (October 2013) and HEASoft (v6.15) packages as of the time of this writing. After reprocessing the data from XIS 0, XIS 1 and XIS 3 (XIS 2 has been inoperable since November 2006) using the aepipeline script, source and background regions were extracted for each detector within xselect. Source regions were circular and 160 arcseconds in radius centered on the source, while background regions were extracted from as much of the surrounding region on the same chip as possible, avoiding the source region and the calibration sources in the detector corners. We then generated response matrices using the xisresp script at “medium” speed, after which we combined the data from the front-illuminated (FI) XIS 0 and XIS 3 detectors using the addascaspec script in order to maximize S/N. The XIS source and background spectra, as well as the responses, were then grouped to a minimum of 25 counts per channel in order to facilitate robust fitting. For all of the spectral fitting presented later in §4, we evaluate the combined XIS-FI with the XIS 1 spectra between and . The range is ignored due to the presence of calibration features. We allow for a global flux cross-normalization error between the XIS-FI and XIS 1 spectra, fitting it as a free parameter. At , we find it slightly lower than the published value of the XIS 1 cross-normalization relative to the combined XIS-FI data ().222http://heasarc.gsfc.nasa.gov/docs/suzaku/analysis/watchout.html
The HXD/GSO detection of IC 4329A was marginal, but corresponds, very roughly, to in the band. With such a weak detection, we did not use the GSO data in our analysis.
Data from the HXD/PIN instrument were again reduced and reprocessed as per the Suzaku ABC Guide. For background subtraction, we used the “tuned” non X-ray background (NXB) event file for August 2012 from the Suzaku CALDB, along with the appropriate response file and flat field file for epoch 11 data. We modeled the cosmic X-ray background (CXB) contribution as per the ABC Guide, simulating its spectrum in xspec (Arnaud 1996). The simulated CXB spectrum (modeled as in Boldt 1987) contributed a count rate of to the total X-ray background from , coupled with a source count rate of over this range. The NXB and CXB files were combined to form a single PIN background spectrum. Because the PIN data only contain 256 spectral channels (vs. the 4096 channels in the unbinned XIS data), rebinning to 25 counts per bin was not necessary in order to facilitate fitting. Rather, we rebinned the PIN spectrum to have a S/N of 5 in each energy bin, which limited our energy range to . We also added systematic errors to the PIN data to account for the uncertainty in the non-X-ray background data supplied by the Suzaku calibration team. For most of the spectral fitting presented in this paper, we assume a PIN/XIS-FI cross-normalization factor of as per the Suzaku memo 2008-06333http://heasarc.gsfc.nasa.gov/docs/suzaku/analysis/watchout.html, though we allow the factor to vary around this value. The fitted value is .
The NuSTAR data were collected with the two focal plane module telescopes (FPMA and FPMB) centered roughly arcmin from the nucleus of IC 4329A. We reduced the data using the NuSTAR Data Analysis Software (nustardas) and calibration version 1.1.1444http://heasarc.gsfc.nasa.gov/docs/nustar/. We filtered the event files and applied the default depth correction using the nupipeline task. The source and background regions were circles of radius 75 arcsec, with the source region centered on IC 4329A and the background region taken from the corner of the same detector, as close as possible to the source without being contaminated by the PSF wings. Spectra and light curves were extracted and response files were generated using the nuproducts task. In order to minimize systematic effects, we have not combined responses or spectra from FPMA and FPMB; instead, we fit them simultaneously. We allow the cross-normalization factor between each module and the Suzaku/XIS-FI data to fit freely. The absolute cross-calibration factor is for FPMA and for FPMB. We obtain excellent agreement in the expected spectral shape below , where there is good overlap between Suzaku/XIS and NuSTAR/FPMA and FPMB: when fit with a simple power-law model, the photon index for the NuSTAR detectors is , while that of Suzaku/XIS is .
For all the analysis presented here, we used xronos version 5.22 and xspec version 12.8.1, along with other ftools packages within HEASoft 6.14. Uncertainties quoted within the text are at the 1 level of confidence, unless otherwise specified, while those in tables are quoted at confidence.
3 Timing Analysis
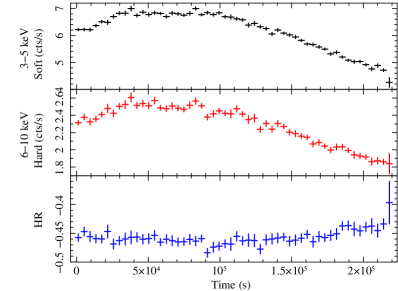
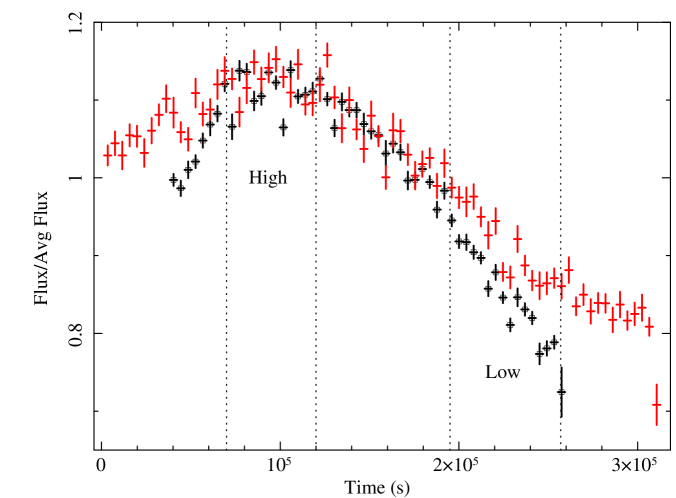
IC 4329A showed a modest, secular flux evolution during the joint Suzaku/NuSTAR observing campaign, roughly consistent with previous observations (Markowitz & Edelson 2004). In both datasets, the source flux increased by over the first of the exposure, then plateaued at the maximum count rate for before decreasing by over the remainder of the observation (clock time is used to measure these intervals). No significant flux variability was seen on short timescales in any of the instruments. Background levels were approximately constant, except for a factor flare in Suzaku/XIS 1 seen in the last time bin (see Fig. 1). On average, the flux during our observations was comfortably within the historical range555http://ned.ipac.caltech.edu/: vs. .
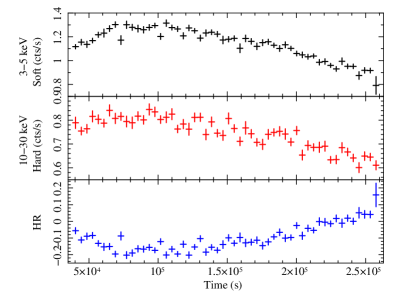
The hardness ratio in the XIS was nearly constant over the observation (Fig. 2), taken between the and bands. During the final the hardness did increase by as the source continued to decrease in flux by over the same time interval. The NuSTAR data show a similar overall trend, visually, but the total amount of flux variability is significantly lower at these higher energies ( vs. ) as compared with the Suzaku/XIS data. The hardness ratio taken from the NuSTAR data is consistent with a constant value (Fig. 2).
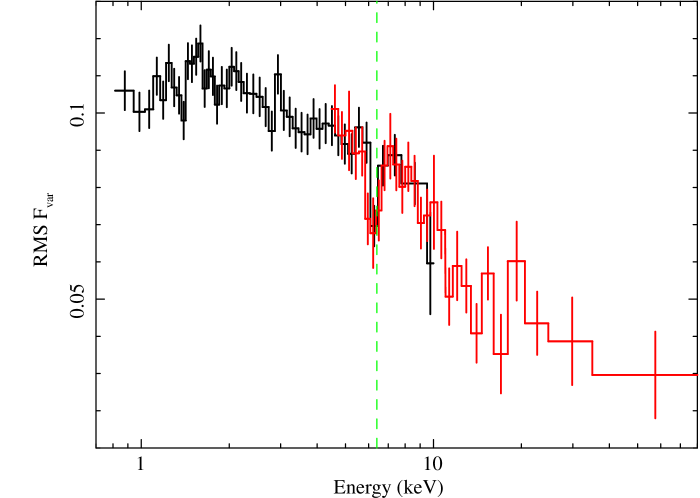
To assess the amount of variability in our observations in a model-independent way, we also calculated the root mean square fractional variability vs. energy of the combined Suzaku/XIS data as well as the NuSTAR/FPMA and FPMB data. This fractional variability spectrum, or RMS Fvar, is derived using the methods described in Edelson et al. (2002) and Vaughan et al. (2003), and the results are plotted in Fig. 3. The source shows the expected decrease in overall fractional source variability with energy due to a combination of the increasing relative importance of reflection from distant matter (Niedźwiecki & Miyakawa 2010) as well as the decreasing importance of the power-law component. We also note that both the Suzaku and NuSTAR data display a prominent dip between , roughly coincident with the Fe K line thought to arise from the fluorescence of distant material due to irradiation by the primary X-ray source. If this emitting gas is located at many thousands of gravitational radii from the corona, as described in AGN unification schemes, it would not vary on the timescales of our observing campaign, meaning that we should expect to see such a dip in the RMS Fvar spectrum.
Given the lack of short timescale variability in our observations of IC 4329A, along with its overall modest flux and hardness ratio changes, we use the time-averaged spectrum in all of the broad band spectral fitting (§4.1-4.2). A discussion of the modest spectral variability is deferred to §4.3.


4 Spectral Analysis
We begin our analysis of the time-averaged spectrum of IC 4329A with an examination of the Suzaku/XIS spectrum from (ignoring the energy range from due to calibration uncertainties around the Si edge). We constrain the properties of the continuum and get a preliminary assessment of the contributions of complex absorption intrinsic to the AGN, distant reflection from the outer disk and/or torus, and relativistic inner disk reflection. We then add in the Suzaku/PIN data from to aid in constraining the slope of the power-law continuum and the fractional contribution of reflection.
We continue our analysis by including the NuSTAR/FPMA and FPMB data, which have significantly better signal-to-noise and reduced systematic error than the PIN above , and to access energies out to that are unreachable by the Suzaku/PIN instrument. The use of simultaneous Suzaku and NuSTAR data allows us to better constrain the parameters of the continuum and reflection, and to constrain the cutoff energy of the power-law component. The importance of having broadband, high S/N X-ray spectra from both observatories lies in our enhanced ability to break modeling degeneracies, and to therefore constrain the physical parameters of three main spectral components with enough accuracy and precision to yield the best estimates of the temperature and optical depth of the coronal plasma taken to date.
We also consider the spectral variability of the source, examining the high-flux vs. low-flux spectra in order to understand the physical processes driving the flux evolution in IC 4329A.
4.1 A First Look at the Suzaku Spectra
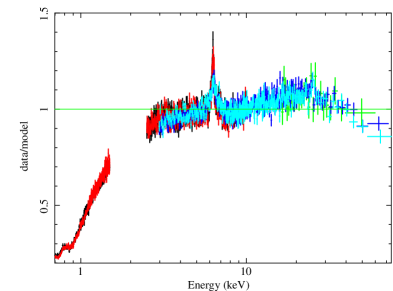
The Suzaku/XIS-FI and XIS 1 data between and are well fit by a power-law of slope modified by a Galactic column of (Kalberla et al. 2005). Here we use the TBabs model of Wilms, Allen, & McCray (2000), along with abundances set to wilm (Wilms et al. 2000) and cross-section table set to vern (Verner et al. 1996). Strong residuals remain when the entire bandpass is considered, however (the XIS 1 data are ignored above due to a rapid loss in detector sensitivity above this energy). Below , these residuals take the form of a pronounced dip below the ideal data/model ratio of unity, indicating the presence of a significant column of absorbing gas along the line of sight to the AGN. The initial power-law model has a global goodness-of-fit of . The spectral fit improves dramatically with the addition of an xstar (Kallman & Bautista 2001) warm absorber table in which the absorbing gas has a column density of and an ionization parameter of : this results in .
An emission line-like feature remains in the residuals at . This feature can be modeled with a Gaussian that likely represents a blend of the resonance, intercombination and forbidden O vii emission lines. The spectral resolution of the Suzaku/XIS instrument is insufficient to separate these three putative lines, however, so it is not possible to derive a density or temperature for the emitting gas via line ratios. This residual feature also does not appear to be a simple consequence of using only one layer of intervening gas to describe the intrinsic absorption of the source, since adding in a second absorber does not improve the fit, nor does it mitigate this feature. If modeled with a Gaussian, the line has a width of (FWHM; well within the Broad Emission Line Region, though if this is a line blend any velocity inferred from its width would be erroneous) and a strength relative to the continuum of . Adding in this feature further improves the fit to . The succession of data-to-model ratios from the simple power-law and absorbed power-law models is shown in Fig. 4, which also highlights the putative O vii line and the residuals in the Fe K band.

Above , the Fe K emission complex is clearly present, with a prominent, narrow Fe K line at and perhaps a blend of Fe K and Fe xxvi at (Fig. 4). Though there is a visual suggestion of an Fe xxv emission line at , including a Gaussian at this energy does not improve the fit. The iron edge is also clearly seen at , perhaps indicating a slightly ionized disk, consistent with the possible presence of an ionized iron line at . No strong, broadened emission in the Fe K band is immediately apparent to the eye, though there are indications of a possible Compton shoulder or iron line red wing at . If we use Gaussian emission lines and an absorption edge to parametrize these features and require that all the Fe K emission features have the same width as the narrow Fe K line, we obtain a width of , , , and . The goodness-of-fit for the XIS spectra including these components is .
Substituting a broad Gaussian emission line at in place of the Compton shoulder results in the same overall goodness-of-fit, with the width of the broad line at . This corresponds to , placing the origin of the line at , if the width of the line corresponds to a Keplerian velocity in the disk. This velocity is consistent with that found by Shu, Yaqoob, & Wang (2010) using Chandra/HETG data, and is times greater than that of the H line in IC 4329A (; Shu et al. 2010 and references therein). This implies that the X-ray broad line emission region (BELR) is times closer to the black hole than the optical BELR. The inclusion of a relativistic line via the relline model (Dauser et al. 2010) does not improve the fit, however, and the relline parameters are unconstrained except for the normalization. We note that the joint ASCA and RXTE analysis of IC 4329A by Done et al. (2000) included a similar broadening of the Fe K line, but likewise could not definitively conclude an inner disk origin for this feature. We proceed under the assumption that the excess emission redward of is either a Compton shoulder or a modest contribution from inner disk reflection. Its equivalent width is in the case of a broad Gaussian at .
Adding in the HXD/PIN data from , we notice convex curvature that peaks around and tails off at higher energies, suggesting the presence of the Compton reflection continuum and a high-energy cutoff to the power-law component, as found in paper I. The addition of the unmodeled PIN data results in a predictable worsening of the goodness-of-fit to before refitting, and after refitting. Including a pexrav component (Magdziarz & Zdziarski 1995) with recovered the fit of . We note that this reflection includes both a contribution from the neutral outer disk or torus, as well as the inner disk (if present). The inclination angle was unconstrained in the fit, so we fixed it to ; this is the typical value assumed for the average over a distribution of disks at random angles. We elected to keep the cutoff energy of the illuminating power-law fixed at , since the limited energy range and high background of the PIN data render them of limited use in probing this parameter.
For a more self-consistent approach, we then replaced the Gaussians-plus-pexrav model with a pexmon component (Nandra et al. 2007), which calculates the expected Fe K emission signatures (Fe K, K and the Compton shoulder, as well as Ni K and K) and the corresponding Compton hump together. We fixed the cutoff energy of the power-law for the pexmon model at . Allowing the iron abundance to fit freely, we obtained and Fe/solar, for a goodness-of-fit of . The inclination angle was fixed to as in the pexrav fit. Including Gaussian emission lines for Fe xxv and xxvi did not statistically improve the fit, though they did lessen the residuals in these regions to the eye. A visual inspection of the residuals also indicated that the region from was underfitted by the model. Given that pexmon includes a Compton shoulder already, we infer that this excess emission likely corresponds to a modest broad Fe K line. Parametrizing this component with a Gaussian emission line at yields an equivalent width of , consistent with its value above, and also shows a similar line width.
Replacing the pexmon component with the more physically realistic xstar-generated xillver model of García et al. (2014) yields a similar goodness-of-fit, with for Fe/solar and (roughly equivalent to in pexmon). The ionization we find is low but unconstrained, so we elected to fix it at the neutral value. The inclination angle of the reprocessor to the line of sight was similarly unconstrained, so we fixed it to . As with the pexmon model, xillver underestimated the amount of emission between in spite of having the Compton shoulder included in the model; including an additional Gaussian component at (rest frame) with corrected this issue.
4.2 Joint Analysis of the Suzaku and NuSTAR Spectra
Including the NuSTAR data with our Suzaku data, along with their appropriate cross-normalization factors, yields the highest S/N ever achieved across the energy range. This enables us to probe the change in shape of the continuum at high energies, as well as the contribution from reflection above and in the Fe K band simultaneously.
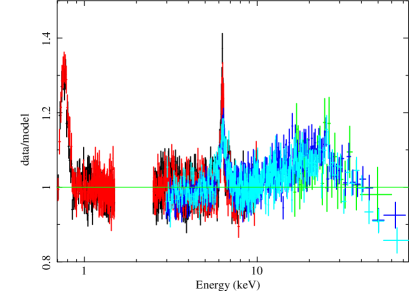
We plot the ratio of the Suzaku/XIS-FI, XIS-BI and HXD/PIN spectra, along with the NuSTAR/FPMA and FPMB spectra to a power-law continuum modified by Galactic photoabsorption in Fig. 4. The same residuals detailed in §4.1 are seen, but the curvature above is now well-defined as a result of the higher S/N NuSTAR data.
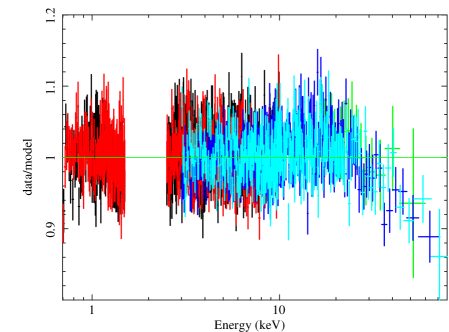
A rollover at high energies is visually evident even from the Suzaku/PIN data, and becomes clearly evident when the FPMA and FPMB spectra are added to the already-modeled Suzaku data, even though reflection is already included in the model (see Fig. 5). The presence of this feature contributes to a global fit of . We now allow the high-energy cutoff to the power-law and xillver reflection components to vary freely in order to assess the robustness of such a feature over and above the distant reflection, and, if present, to constrain its cutoff energy. This approach improves the fit to and greatly improves the data-to-model ratio at high energies as well, visually. The cutoff energy of the power-law is constrained to . In comparison, paper I yielded with NuSTAR alone. The residuals around the narrow Fe K line necessitate the addition of a broader Gaussian component, as described in §4.1. The best-fitting rest-frame energy of this line is , with equivalent width . We will refer to this model as Model 1 throughout the rest of the paper.
Given the high S/N out to achievable with NuSTAR, we can consider more physically motivated models to describe the continuum emission than the more phenomenological cutoff power-law. To this end, in paper I we employed the compTT model of Titarchuk (1994), parametrizing the continuum as being produced by inverse Compton scattering of thermal disk photons off of relativistic electrons situated above the disk in either a slab or spherical geometry.
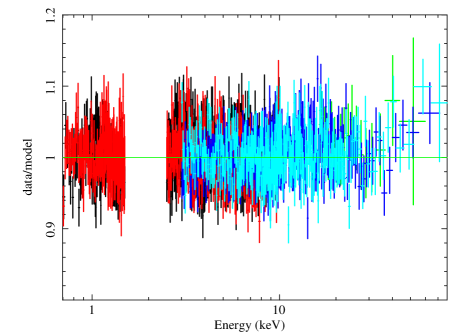
We adopt a similar approach in modeling the combined dataset here, applying a compTT model component to the combined Suzaku+NuSTAR spectra, rather than a phenomenological power-law continuum. The rest of the model components remained the same: the xillver component used for the reflected emission had its incident power-law spectral index frozen to the best-fit value obtained in Model 1, much like the approach taken using the compTT model in paper I. The spherical corona geometry is hereafter referred to as Model 2, while the slab geometry is Model 3. Plots of the contributions of individual model components to the overall fit are shown in Fig. 6.
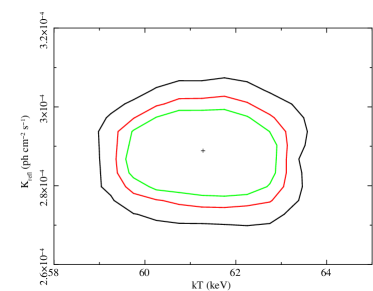
Model 2 yields a goodness-of-fit of , while Model 3 produces ; in comparison Model 1 comes to . None of the common parameter values change significantly between models. The power-law of Model 1 finds its best fit with and , while the Comptonization components of Models 2-3 return coronal temperatures and optical depths of and and and , respectively. In comparison, in paper I the NuSTAR data alone returned and and and for each model. We will discuss these differences further in §5
The Markov Chain Monte Carlo (MCMC) analysis used to measure the formal distribution of each parameter across its available parameter space for each model was performed using the Metropolis-Hastings algorithm (e.g., Kashyap & Drake 1998 and references therein) with four chains of 55,000 elements, in which the first 5000 elements from each were discarded as part of the “burn-in” period. Each chain was started at a random seed in the global parameter space using a diagonal covariance matrix with Gaussian errors derived from the squares of the errors from the model fitting in xspec. The rescaling factor of the covariance matrix was derived using trial and error based on an initial estimate of , where is the number of free parameters in the fit. The appropriate rescaling factor was determined by ensuring that the fraction of repeated values in a given chain was approximately . The Gelman–Rubin convergence criterion of was achieved for each chain.666As outlined in the xspec manual: http://heasarc.gsfc.nasa.gov/docs/xanadu/xspec/manual/XSchain.html
Once each chain run was completed, the four chains were loaded back into xspec to create a composite 200,000-element chain used to extract confidence errors (shown in Table 2) and to examine the distribution of each individual parameter in the fit. We then generated probability density contours for the most interesting pairs of parameters for each model, which are shown in Figs. 7, 8 and 9.
The best-fit parameters and their MCMC-derived confidence errors from all three models are shown in Table 2. The total absorbed flux and luminosity of the model are and , respectively, while their unabsorbed values are and .
| Component | Parameter (units) | Model 1 | Model 2 | Model 3 |
|---|---|---|---|---|
| TBabs | ||||
| xstar grid | ||||
| zpo | ||||
| compTT | ||||
| xillver | Fe/solar | |||
| zgauss | ||||
| zgauss | ||||
| Final fit |


4.3 Spectral Variability
Our simultaneous Suzaku and NuSTAR observations of IC 4329A do not show marked variability on short timescales, as exhibited by many other AGN (e.g., NGC 1365, Risaliti et al. 2013). Nonetheless, it is useful to examine time-sliced spectra from the highest and lowest flux states of the source during our campaign. This exercise yields insight into the changes in certain spectral components driving the change in flux, i.e., to what degree these flux changes are caused by variations in the continuum, absorption or reflection components.
We extracted simultaneous high- and low-flux spectra from the time intervals in each observation (Suzaku/XIS-FI and NuSTAR/FPMA; FPMB are not shown for clarity, but are virtually identical to FPMA). These spectra are shown in Fig. 10. The high-flux state spectra totaled of exposure time and represent the highest source flux with simultaneous data from the two telescopes. The low-flux state totaled of exposure time, and represents the lowest source flux with simultaneous data from both telescopes. Difference spectra were created by subtracting the low-flux spectra from the high-flux spectra in both Suzaku/XIS-FI and NuSTAR/FPMA. We show all six spectra plotted against the best-fit power-law modified by Galactic photoabsorption in Fig. 11. Note that the difference spectra show no change from the high- and low-state spectra below , indicating the constancy of the warm absorber during our observations. Close inspection of Fig. 11 also reveals that the reflection features (Fe K band and Compton hump above ) are slightly more prominent during the low-flux state when the power-law emission is minimized. The difference spectra show no residual reflection features, implying that these are constant in flux over the course of the observation. We can therefore infer that changes in only the power-law flux drive the slight spectral evolution that takes place as IC 4329A transitions from a higher-flux state to a lower-flux state during our campaign.
The source is softer when brighter, as is typical in many actively accreting AGN: in the high-flux state () vs. in the low-flux state (). This observed relation is thought to arise due to a correlation between the mass accretion rate and power-law slope, wherein higher accretion rates result in steeper spectra. This result can be explained if the Compton amplification factor decreases proportionally with the accretion rate in AGN (e.g., Sobolewska & Papadakis 2009 and references therein), though note all AGN display this behavior (e.g., NGC 4151; Lubiński et al. 2010).
The cutoff energy of the power-law in our data does not vary significantly from its best-fit value between the high- and low-flux spectra, and cannot be constrained in the difference spectrum. The difference spectrum is well fit by a power-law modified by both Galactic and intrinsic absorption, much like that described in the Model 1. This power-law has a slope of and a normalization of .

5 Discussion
5.1 Summary
In our deep observation of IC 4329A, performed simultaneously with Suzaku and NuSTAR, we are able to robustly separate the continuum, absorption and distant reflection components in the spectrum using the broad energy range of our observations. The results of our analysis can be summarized as follows:
-
•
IC 4329A was viewed in a flux state near its historical average, and displayed little variability on short timescales and variability over the course of the campaign, as has been found in previous X-ray observations.
-
•
While we were able to place a strong constraint on the presence of a broadened Fe K line in the data ( in Model 1, the highest equivalent width seen in our modeling), we were not able to constrain any of the parameters when a relativistic line model was applied to the data. As such, it is not possible to derive any constraints on the spin of the black hole in IC 4329A using these observations.
-
•
We have made the most accurate, precise measurement of the high-energy cutoff of the X-ray emission to date: . This measurement improves on that made with NuSTAR alone in paper I (), demonstrating the necessity of obtaining high-S/N, broadband X-ray data in order to determine the properties of the corona.
-
•
Using data from both Suzaku and NuSTAR, we derive and for the spherical geometry, with and for the slab geometry.
5.2 Understanding the Corona
It is important to establish the continuum level in AGN in order to determine their overall energy budget, and the high-S/N, broadband X-ray spectra we have obtained using Suzaku and NuSTAR simultaneously enable us to disentangle the continuum, absorption and reflection signatures more accurately than we are able to with either observatory alone.
Our spectral and timing analyses of the simultaneous Suzaku and NuSTAR observations of IC 4329A demonstrate that changes in the continuum flux are responsible for the modest, secular changes in the overall source flux that we detect. The high-S/N, broadband spectra enable us to determine that neither the absorption nor reflection components show any significant variability over the course of our observing campaign. Though this result was hinted at in paper I, the addition of the Suzaku data to the analysis confirms the lack of absorption variability, in particular. Referencing Model 1, we note that the power-law normalization decreases by between the high- and low-flux states during our observations (§4.3); similarly, the overall source flux decreases by approximately the same amount (§3). The variation is more pronounced at energies below (Fig. 11), in keeping with our examination of the RMS variability spectrum (Fig. 3).
We note that the spectrum is rather hard: the cutoff power-law fit in Model 1 returns a photon index of , also confirming the results from paper I. This is consistent with several recent measurements taken with Chandra and XMM (average ; McKernan & Yaqoob 2004; Steenbrugge et al. 2005; Markowitz, Reeves, & Braito 2006), but inconsistent with the joint XMM+INTEGRAL spectral fitting performed by Molina et al. (2009) (). We note, however, that the data reported by Molina et al. were not obtained simultaneously. Spectral fitting returned a significantly softer index in previous epochs as well; between 1995 and 2001, the average reported spectral slope was with a range between (Madejski et al. 1995; Cappi et al. 1996; Perola et al. 1999; Done et al. 2000; Gondoin et al. 2001). Caution should be used when measuring the power-law slope using only data , as the true slope of the continuum is best assessed over a much broader energy band extending out to higher energies where the continuum is more dominant. We also note that the quality of our data at high energies with NuSTAR now far surpasses that of the spectra obtained with RXTE, BeppoSAX, CGRO or INTEGRAL. Even so, these differences in measured power-law slope may indicate that IC 4329A undergoes significant coronal variability on years-long timescales.
It would be interesting to investigate whether the cutoff energy of the power-law shows similar variations to the spectral index, but unfortunately the constraints placed on this parameter historically are too loose to enable this test. In all of the observations prior to 2009, either the cutoff energy was fixed to the result obtained by Perola et al. (1999), or did not improve on this result (e.g., , Madejski et al. 1995; , Gondoin et al. 2001). Our result (, consistent with yet more precise than the measurement from paper I) is consistent with that obtained by Molina et al. (2009), as discussed in § 4.2. It is also at the median point of the high-energy power-law cutoffs that have been measured in Seyfert AGN thus far with NuSTAR. Others include Ark 120 (, Matt et al. 2014), SWIFT J2127.4+5654 (, Marinucci et al. 2014) and Mrk 335 (, Parker et al. , submitted).
Owing to the high quality and broadband energy coverage of our data, we were able to reach beyond the phenomenological power-law representation of the continuum and consider more physical models, following our work with the NuSTAR data alone in paper I. Models 2-3 provide roughly equivalent statistical fits to the data, incorporating a compTT model that parametrizes the temperature, optical depth and geometry of the electron plasma, as well as an xillver model that assumes a neutral slab of material inclined at to our line of sight and leaves the reflected flux from the disk and its iron abundance as free parameters. We also added in two Gaussian components to represent (1) a blend of the resonance, intercombination and forbidden O vii emission lines, and (2) a contribution from a broad Fe K line from the inner disk.
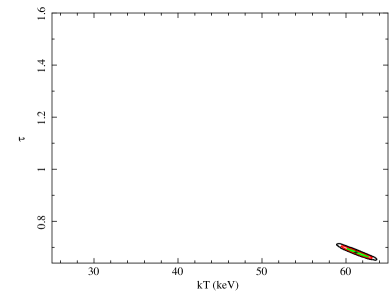
The goodness-of-fit is largely insensitive to the coronal geometry assumed, though the temperatures derived from the spherical and slab geometries are inconsistent at the level ( and , respectively). The two models also produce different values for the optical depth of the corona: and , respectively. These values differ by (see Fig. 12) even after the factor-of-two geometrical difference in calculating the optical depth is accounted for (see paper I), indicating that a physical change in the properties of the plasma is necessary when applying a different geometry in order to achieve a good fit. This was not the case when Models 2-3 were fit to the NuSTAR data alone in paper I. Unfortunately, the lack of both short timescale variability and significant relativistic, inner disk reflection in IC 4329A during our observing campaign prevents us from determining the distance of the corona from the accretion disk, and from being able to constrain how centrally concentrated the coronal emission is.

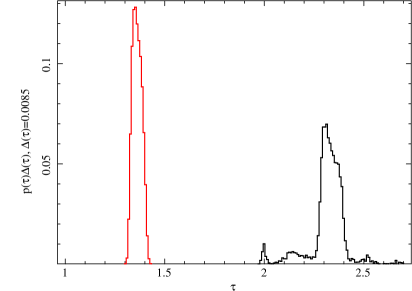
Though the spherical model returns a slightly better statistical fit, we conclude that the slab model is more physically believable due to the tighter match it provides between coronal temperature and power-law cutoff energy (assuming ; in this case, , which is much closer than Model 2 to being compatible with the measured power-law cutoff value in Model 1). We also note that the temperature and optical depth of the plasma are much more tightly constrained in the slab geometry. Due to an inherent modeling degeneracy between the optical depth and temperature of the electron plasma in each geometry, however, there is a small, linearly correlated range of values for these parameters which demonstrate approximately equal statistical fit quality, as can be seen in Figs. 8a and 9a. It is thus not surprising that, as the temperature increases in the slab vs. sphere case, the optical depth decreases to compensate and produce an equivalent goodness-of-fit. Nonetheless, both parameters are constrained with the best precision and accuracy ever achieved.
We also note that both sets of values for the coronal temperature and optical depth measured with the combined, simultaneous Suzaku and NuSTAR datasets deviate significantly from those obtained when fitting the NuSTAR data alone in Models 2-3 of paper I (Figs. 8a, 9a and 12). In particular, the slab geometry in paper I returned and , which is inconsistent with the results for this geometry using the combined dataset at a level. We attribute this difference to the larger spectral energy coverage of the combined dataset, which, as noted previously, allows us to definitively disentangle the signatures of the continuum, reflection and absorption in ways that NuSTAR alone cannot, since its effective area only extends down to and its spectral resolution in the Fe K band is three times worse than that of Suzaku ( vs. ). The amount of reflection in the system and the curvature induced by the high-energy cutoff of the continuum are particularly degenerate at energies , but having the high-S/N, high spectral resolution Suzaku data in the Fe K band, especially, allows us to break this degeneracy and to independently constrain and (see Figs. 8b and 9b). Taking these factors into account, we consider the values for the coronal temperature and optical depth measured in this work to be the definitive physical properties of the corona in IC 4329A. Their deviation from those determined through the analysis of only data at lower spectral resolution underscore the importance of obtaining high-S/N data across a broad X-ray bandpass in order to draw conclusions about the corona from Comptonization models.
As more constraints on coronal parameters are measured from a sample of AGN, it will be interesting to compare the coronal properties (e.g., , , ) with the those of the black hole and inner accretion flow (e.g., , , ). It has long been thought that more actively accreting black holes cool their coronae more efficiently (Skipper, Mc Hardy, & Maccarone 2013 and references therein), but a sample of AGN with sensitive, broad-band X-ray spectra, as presented here for IC 4329A, would help to test this conjecture.
5.3 The Fe K Region
The addition of the Suzaku data enables us to perform a detailed analysis of the Fe K region in IC 4329A, while the NuSTAR data provide an important check on the physical consistency of our models by simultaneously showing us the Compton reflection continuum . The majority of the reflection component originates in material at large distances from the black hole (e.g., the putative torus), and is well fit by a static, neutral xillver component. Though there is evidence for a broad Fe K line or a Compton shoulder due to the residuals remaining after a narrow Fe K line is included, the broad line explanation is more likely since the reflection models we employ already incorporate a Compton shoulder component. That said, the Compton shoulder explanation cannot be conclusively ruled out with these data.
Assuming that the residuals do correspond to a broad iron line component, modeling this emission feature with a relativistic line profile (e.g., diskline, laor or relline) yields no improvement in the fit and the model parameters cannot be constrained. We have successfully modeled this residual emission with a Gaussian line at , and can place a limit on its strength relative to the continuum of (Model 1). Only of the reflected emission arises from the broadened Fe K feature. While obviously present and originating from well within the broad emission line region (), this feature likely represents only a weak broad line from the inner disk. Indeed, the reflection fraction constrained via the pexrav model in §4.1 is also low by comparison with other bright, nearby Seyfert 1 AGN (Walton et al. 2013). Such a finding is in keeping with the theoretical work of Ballantyne (2010), however, who suggested that the majority of Seyferts may have broad Fe K lines with . Our inability to constrain any of the parameters when a relativistic disk line model is applied renders it useless in constraining the spin of the black hole, however. Similarly, attempting to fit this feature with a relativistic smearing kernel convolved with an ionized disk reflection spectrum also results in no statistical improvement in fit and no parameter constraints. The feature is not apparent in the high-low flux difference spectrum of the AGN, meaning that it is not significantly variable over the course of the observations. Even if it does arise from inner disk reflection this is not surprising, given the lack of short timescale variability of the continuum.
A broad Fe K line has been reported in every observation taken of IC 4329A with an X-ray observatory capable of spectrally resolving it (Piro et al. 1990; Madejski et al. 1995; Cappi et al. 1996; Perola et al. 1999; Done et al. 2000; Gondoin et al. 2001; McKernan & Yaqoob 2004; Steenbrugge et al. 2005; Markowitz et al. 2006; Dadina 2007; Molina et al. 2009, 2013). Such a line was also noted in the XMM-Newton analysis of the source by de La Calle Pérez et al. (2010), suggesting that this line, though difficult to characterize definitively, is a persistent feature of the spectrum over years-long timescales. Provided that sufficient photon counts have been obtained in the observation (i.e., from ), broad Fe K lines are detected in of all AGN (Guainazzi, Bianchi, & Dovčiak 2006; Nandra et al. 2007; de La Calle Pérez et al. 2010). Further, some actively accreting AGN have had broad Fe K emission lines reported in previous epochs but not currently (e.g., NGC 5548, Brenneman et al. 2012). Taking these points into consideration, it is perhaps not surprising to find that IC 4329A does not exhibit strong relativistic reflection signatures during our observation. Indeed, marginal detections of broad Fe K emission lines such as that found here may be the norm rather than the exception among even actively accreting AGN (Ballantyne 2010). Within this framework, it is intriguing to note that the source is accreting at for a black hole with an estimated mass of (de La Calle Pérez et al. 2010). Given that the Keplerian velocity of the broadened Fe K feature places its origin at from the black hole, this suggests that the optically thick disk may not extend down to the ISCO. The disk may be truncated within this radius, or perhaps it is too highly ionized to significantly contribute to the reflection spectrum. Indeed, highly ionized disks are expected in relatively high accretion rate sources (Ballantyne, McDuffie, & Rusin 2011) such as IC 4329A. The power-law photon index of the source is also considerably harder () than is typical for an actively accreting source with an inner disk extending down to its ISCO, and marks a departure of from the AGN relation measured by Brightman et al. (2013). According to these authors, for an Eddington ratio of , one should measure , in contrast to the measured here for IC 4329A (however, the intrinsic scatter in this relation must be considered, as must the uncertainty in measuring the Eddington ratio in a given source).
The relative weakness of the reflection features compared to similar AGN coupled with the hard power-law index of the source, particularly, lends credence to the hypothesis put forward in paper I: that we are witnessing an outflowing corona with , following the work of Beloborodov (1999) and Malzac, Beloborodov, & Poutanen (2001). Although an ionized inner disk would certainly inhibit strong reflection features from this region, as per Ballantyne (2010), it is worth noting that the outflowing corona scenario would suppress them as well: if the main locus of coronal emission is situated at a height of then we become insensitive to reflection from the disk within . Also, if the corona is relativistically outflowing then aberration decreases the illumination of the inner disk, again making us less sensitive to any reflection from this region. Under any of the above conditions we would not expect to be able to constrain the spin of the black hole in IC 4329A. A deep multi-wavelength campaign involving UV spectra, particularly, in addition to the outstanding data now available in X-rays with NuSTAR and Suzaku, XMM-Newton or Chandra would be necessary in order to properly evaluate the characteristics and structure of the inner accretion disk, and to place our results on the energetics of the system in their proper context.
References
- Antonucci (1993) Antonucci, R. 1993, ARA&A, 31, 473
- Arnaud (1996) Arnaud, K. A. 1996, in Astronomical Society of the Pacific Conference Series, Vol. 101, Astronomical Data Analysis Software and Systems V, ed. G. H. Jacoby & J. Barnes, 17
- Ballantyne (2010) Ballantyne, D. R. 2010, ApJ, 708, L1
- Ballantyne, McDuffie, & Rusin (2011) Ballantyne, D. R., McDuffie, J. R., & Rusin, J. S. 2011, ApJ, 734, 112
- Beckmann, Gehrels, Shrader, & Soldi (2006) Beckmann, V., Gehrels, N., Shrader, C. R., & Soldi, S. 2006, ApJ, 638, 642
- Beloborodov (1999) Beloborodov, A. M. 1999, ApJ, 510, L123
- Boldt (1987) Boldt, E. 1987, Phys. Rep., 146, 215
- Brenneman (2013) Brenneman, L. 2013, Measuring the Angular Momentum of Supermassive Black Holes (Springer)
- Brenneman, Elvis, Krongold, Liu, & Mathur (2012) Brenneman, L. W., Elvis, M., Krongold, Y., Liu, Y., & Mathur, S. 2012, ApJ, 744, 13
- Brenneman, Madejski, Fuerst, Matt, Elvis, Harrison, Ballantyne, Boggs, Christensen, Craig, Fabian, Grefenstette, Hailey, Madsen, Marinucci, Rivers, Stern, Walton, & Zhang (2014) Brenneman, L. W., Madejski, G., Fuerst, F., Matt, G., Elvis, M., Harrison, F. A., Ballantyne, D. R., Boggs, S. E., et al. 2014, ApJ, 781, 83
- Brightman, Silverman, Mainieri, Ueda, Schramm, Matsuoka, Nagao, Steinhardt, Kartaltepe, Sanders, Treister, Shemmer, Brandt, Brusa, Comastri, Ho, Lanzuisi, Lusso, Nandra, Salvato, Zamorani, Akiyama, Alexander, Bongiorno, Capak, Civano, Del Moro, Doi, Elvis, Hasinger, Laird, Masters, Mignoli, Ohta, Schawinski, & Taniguchi (2013) Brightman, M., Silverman, J. D., Mainieri, V., Ueda, Y., Schramm, M., Matsuoka, K., Nagao, T., Steinhardt, C., et al. 2013, MNRAS, 433, 2485
- Cappi, Mihara, Matsuoka, Hayashida, Weaver, & Otani (1996) Cappi, M., Mihara, T., Matsuoka, M., Hayashida, K., Weaver, K. A., & Otani, C. 1996, ApJ, 458, 149
- Dadina (2007) Dadina, M. 2007, A&A, 461, 1209
- Dauser, Wilms, Reynolds, & Brenneman (2010) Dauser, T., Wilms, J., Reynolds, C. S., & Brenneman, L. W. 2010, MNRAS, 409, 1534
- de La Calle Pérez, Longinotti, Guainazzi, Bianchi, Dovčiak, Cappi, Matt, Miniutti, Petrucci, Piconcelli, Ponti, Porquet, & Santos-Lleó (2010) de La Calle Pérez, I., Longinotti, A. L., Guainazzi, M., Bianchi, S., Dovčiak, M., Cappi, M., Matt, G., Miniutti, G., et al. 2010, A&A, 524, A50
- Done, Madejski, & Życki (2000) Done, C., Madejski, G. M., & Życki, P. T. 2000, ApJ, 536, 213
- Edelson, Turner, Pounds, Vaughan, Markowitz, Marshall, Dobbie, & Warwick (2002) Edelson, R., Turner, T. J., Pounds, K., Vaughan, S., Markowitz, A., Marshall, H., Dobbie, P., & Warwick, R. 2002, ApJ, 568, 610
- García, Dauser, Lohfink, Kallman, Steiner, McClintock, Brenneman, Wilms, Eikmann, Reynolds, & Tombesi (2014) García, J., Dauser, T., Lohfink, A., Kallman, T. R., Steiner, J. F., McClintock, J. E., Brenneman, L., Wilms, J., et al. 2014, ApJ, 782, 76
- Gondoin, Barr, Lumb, Oosterbroek, Orr, & Parmar (2001) Gondoin, P., Barr, P., Lumb, D., Oosterbroek, T., Orr, A., & Parmar, A. N. 2001, A&A, 378, 806
- Guainazzi, Bianchi, & Dovčiak (2006) Guainazzi, M., Bianchi, S., & Dovčiak, M. 2006, Astronomische Nachrichten, 327, 1032
- Harrison, Craig, Christensen, Hailey, Zhang, Boggs, Stern, Cook, Forster, Giommi, Grefenstette, Kim, Kitaguchi, Koglin, Madsen, Mao, Miyasaka, Mori, Perri, Pivovaroff, Puccetti, Rana, Westergaard, Willis, Zoglauer, An, Bachetti, Barrière, Bellm, Bhalerao, Brejnholt, Fuerst, Liebe, Markwardt, Nynka, Vogel, Walton, Wik, Alexander, Cominsky, Hornschemeier, Hornstrup, Kaspi, Madejski, Matt, Molendi, Smith, Tomsick, Ajello, Ballantyne, Baloković, Barret, Bauer, Blandford, Brandt, Brenneman, Chiang, Chakrabarty, Chenevez, Comastri, Dufour, Elvis, Fabian, Farrah, Fryer, Gotthelf, Grindlay, Helfand, Krivonos, Meier, Miller, Natalucci, Ogle, Ofek, Ptak, Reynolds, Rigby, Tagliaferri, Thorsett, Treister, & Urry (2013) Harrison, F. A., Craig, W. W., Christensen, F. E., Hailey, C. J., Zhang, W. W., Boggs, S. E., Stern, D., Cook, W. R., et al. 2013, ApJ, 770, 103
- Kalberla, Burton, Hartmann, Arnal, Bajaja, Morras, & Pöppel (2005) Kalberla, P. M. W., Burton, W. B., Hartmann, D., Arnal, E. M., Bajaja, E., Morras, R., & Pöppel, W. G. L. 2005, A&A, 440, 775
- Kallman & Bautista (2001) Kallman, T. & Bautista, M. 2001, ApJS, 133, 221
- Kashyap & Drake (1998) Kashyap, V. & Drake, J. J. 1998, ApJ, 503, 450
- Longair (2011) Longair, M. S. 2011, High Energy Astrophysics, Cambridge University Press
- Lubiński, Zdziarski, Walter, Paltani, Beckmann, Soldi, Ferrigno, & Courvoisier (2010) Lubiński, P., Zdziarski, A. A., Walter, R., Paltani, S., Beckmann, V., Soldi, S., Ferrigno, C., & Courvoisier, T. J.-L. 2010, MNRAS, 408, 1851
- Madejski, Done, & Życki (2001) Madejski, G., Done, C., & Życki, P. 2001, Advances in Space Research, 28, 369
- Madejski, Zdziarski, Turner, Done, Mushotzky, Hartman, Gehrels, Connors, Fabian, Nandra, Celotti, Rees, Johnson, Grove, & Starr (1995) Madejski, G. M., Zdziarski, A. A., Turner, T. J., Done, C., Mushotzky, R. F., Hartman, R. C., Gehrels, N., Connors, A., et al. 1995, ApJ, 438, 672
- Magdziarz & Zdziarski (1995) Magdziarz, P. & Zdziarski, A. A. 1995, MNRAS, 273, 837
- Malzac, Beloborodov, & Poutanen (2001) Malzac, J., Beloborodov, A. M., & Poutanen, J. 2001, MNRAS, 326, 417
- Marinucci, Matt, Kara, Miniutti, Elvis, Arevalo, Ballantyne, Balokovic, Bauer, Brenneman, Boggs, Cappi, Christensen, Craig, Fabian, Fuerst, Hailey, Harrison, Risaliti, Reynolds, Stern, Walton, & Zhang (2014) Marinucci, A., Matt, G., Kara, E., Miniutti, G., Elvis, M., Arevalo, P., Ballantyne, D. R., Balokovic, M., et al. 2014, ArXiv e-prints
- Marinucci, Risaliti, Wang, Nardini, Elvis, Fabbiano, Bianchi, & Matt (2012) Marinucci, A., Risaliti, G., Wang, J., Nardini, E., Elvis, M., Fabbiano, G., Bianchi, S., & Matt, G. 2012, MNRAS, 423, L6
- Markowitz (2009) Markowitz, A. 2009, ApJ, 698, 1740
- Markowitz & Edelson (2004) Markowitz, A. & Edelson, R. 2004, ApJ, 617, 939
- Markowitz, Reeves, & Braito (2006) Markowitz, A., Reeves, J. N., & Braito, V. 2006, ApJ, 646, 783
- Matt, Marinucci, Guainazzi, Brenneman, Elvis, Lohfink, Arevalo, Boggs, Cappi, Christensen, Craig, Fabian, Fuerst, Hailey, Harrison, Parker, Reynolds, Stern, Walton, & Zhang (2014) Matt, G., Marinucci, A., Guainazzi, M., Brenneman, L. W., Elvis, M., Lohfink, A., Arevalo, P., Boggs, S. E., et al. 2014, MNRAS, 439, 3016
- McKernan & Yaqoob (2004) McKernan, B. & Yaqoob, T. 2004, ApJ, 608, 157
- Miyazawa, Haba, & Kunieda (2009) Miyazawa, T., Haba, Y., & Kunieda, H. 2009, PASJ, 61, 1331
- Molina, Bassani, Malizia, Stephen, Bird, Bazzano, & Ubertini (2013) Molina, M., Bassani, L., Malizia, A., Stephen, J. B., Bird, A. J., Bazzano, A., & Ubertini, P. 2013, MNRAS, 433, 1687
- Molina, Bassani, Malizia, Stephen, Bird, Dean, Panessa, de Rosa, & Landi (2009) Molina, M., Bassani, L., Malizia, A., Stephen, J. B., Bird, A. J., Dean, A. J., Panessa, F., de Rosa, A., et al. 2009, MNRAS, 399, 1293
- Nandra, O’Neill, George, & Reeves (2007) Nandra, K., O’Neill, P. M., George, I. M., & Reeves, J. N. 2007, MNRAS, 382, 194
- Niedźwiecki & Miyakawa (2010) Niedźwiecki, A. & Miyakawa, T. 2010, A&A, 509, A22
- Perola, Matt, Cappi, Dal Fiume, Fiore, Guainazzi, Mineo, Molendi, Nicastro, Piro, & Stirpe (1999) Perola, G. C., Matt, G., Cappi, M., Dal Fiume, D., Fiore, F., Guainazzi, M., Mineo, T., Molendi, S., et al. 1999, A&A, 351, 937
- Perola, Matt, Cappi, Fiore, Guainazzi, Maraschi, Petrucci, & Piro (2002) Perola, G. C., Matt, G., Cappi, M., Fiore, F., Guainazzi, M., Maraschi, L., Petrucci, P. O., & Piro, L. 2002, A&A, 389, 802
- Piro, Yamauchi, & Matsuoka (1990) Piro, L., Yamauchi, M., & Matsuoka, M. 1990, ApJ, 360, L35
- Reynolds (2013) Reynolds, C. S. 2013, Space Sci. Rev.
- Risaliti, Harrison, Madsen, Walton, Boggs, Christensen, Craig, Grefenstette, Hailey, Nardini, Stern, & Zhang (2013) Risaliti, G., Harrison, F. A., Madsen, K. K., Walton, D. J., Boggs, S. E., Christensen, F. E., Craig, W. W., Grefenstette, B. W., et al. 2013, Nature, 494, 449
- Shu, Yaqoob, & Wang (2010) Shu, X. W., Yaqoob, T., & Wang, J. X. 2010, ApJS, 187, 581
- Skipper, McHardy, & Maccarone (2013) Skipper, C. J., McHardy, I. M., & Maccarone, T. J. 2013, MNRAS, 434, 574
- Sobolewska & Papadakis (2009) Sobolewska, M. A. & Papadakis, I. E. 2009, MNRAS, 399, 1597
- Soldi, Beckmann, Baumgartner, Ponti, Shrader, Lubiński, Krimm, Mattana, & Tueller (2014) Soldi, S., Beckmann, V., Baumgartner, W. H., Ponti, G., Shrader, C. R., Lubiński, P., Krimm, H. A., Mattana, F., et al. 2014, A&A, 563, A57
- Steenbrugge, Kaastra, Sako, Branduardi-Raymont, Behar, Paerels, Blustin, & Kahn (2005) Steenbrugge, K. C., Kaastra, J. S., Sako, M., Branduardi-Raymont, G., Behar, E., Paerels, F. B. S., Blustin, A. J., & Kahn, S. M. 2005, A&A, 432, 453
- Tanaka, Nandra, Fabian, Inoue, Otani, Dotani, Hayashida, Iwasawa, Kii, Kunieda, Makino, & Matsuoka (1995) Tanaka, Y., Nandra, K., Fabian, A. C., Inoue, H., Otani, C., Dotani, T., Hayashida, K., Iwasawa, K., et al. 1995, Nature, 375, 659
- Titarchuk (1994) Titarchuk, L. 1994, ApJ, 434, 570
- Urry & Padovani (1995) Urry, C. M. & Padovani, P. 1995, PASP, 107, 803
- Vaughan, Edelson, Warwick, & Uttley (2003) Vaughan, S., Edelson, R., Warwick, R. S., & Uttley, P. 2003, MNRAS, 345, 1271
- Verner, Ferland, Korista, & Yakovlev (1996) Verner, D. A., Ferland, G. J., Korista, K. T., & Yakovlev, D. G. 1996, ApJ, 465, 487
- Verrecchia, in’t Zand, Giommi, Santolamazza, Granata, Schuurmans, & Antonelli (2007) Verrecchia, F., in’t Zand, J. J. M., Giommi, P., Santolamazza, P., Granata, S., Schuurmans, J. J., & Antonelli, L. A. 2007, A&A, 472, 705
- Walton, Nardini, Fabian, Gallo, & Reis (2013) Walton, D. J., Nardini, E., Fabian, A. C., Gallo, L. C., & Reis, R. C. 2013, MNRAS, 428, 2901
- Willmer, Focardi, Chan, Pellegrini, & da Costa (1991) Willmer, C. N. A., Focardi, P., Chan, R., Pellegrini, P. S., & da Costa, N. L. 1991, AJ, 101, 57
- Wilms, Allen, & McCray (2000) Wilms, J., Allen, A., & McCray, R. 2000, ApJ, 542, 914
- Wilson & Penston (1979) Wilson, A. S. & Penston, M. V. 1979, ApJ, 232, 389
- Yaqoob & Padmanabhan (2004) Yaqoob, T. & Padmanabhan, U. 2004, ApJ, 604, 63
- Zdziarski, Gierlinski, Gondek, & Magdziarz (1996) Zdziarski, A. A., Gierlinski, M., Gondek, D., & Magdziarz, P. 1996, A&AS, 120, C553
- Zdziarski (1994) Zdziarski, A. A. et al.. 1994, MNRAS, 269, L55