First Extragalactic Detection of far-infrared CH rotational lines from the Herschel Space Observatory
Abstract
We present the first extragalactic detections of several CH rotational transitions in the far-infrared (FIR) in four nearby galaxies: NGC 1068, Arp 220, M 82 and NGC 253 using the Herschel Space Observatory. The CH lines in all four galaxies are a factor of 2 - 4 brighter than the adjacent HCN and HCO+ J = 6-5 lines (also detected in the same spectra). In the star formation dominated galaxies, M 82, NGC 253 and Arp 220, the CH/CO abundance ratio is low (), implying that the CH is primarily arising in diffuse and translucent gas where the chemistry is driven by UV radiation as found in the Milky Way ISM. In NGC 1068, which has a luminous AGN, the CH/CO ratio is an order of magnitude higher suggesting that CH formation is driven by an X-ray dominated region. Our XDR models show that both the CH and CO abundances in NGC 1068 can be explained by an XDR-driven chemistry for gas densities and molecular hydrogen column densities that are well constrained by the CO observations. We conclude that the CH/CO ratio may a good indicator of the presence of AGN in galaxies. We also discuss the feasibility of detecting CH in intermediate- to high- galaxies with ALMA.
1 Introduction
The methylidyne radical CH has been studied extensively at visible wavelengths through its electronic transitions in diffuse Galactic gas (Federman et al., 1997; Sheffer et al., 2008). From these observations, CH was found to be a powerful tracer of the molecular hydrogen in diffuse and translucent gas. Because CH is a light molecule its ground state rotational transitions lie at submm/FIR wavelengths and are impossible to observe from the ground. Herschel made the first observations of the rotational transitions of CH arising in the far-infrared/sub-millimeter regime in Galactic star forming regions (Gerin et al., 2010; Qin et al., 2010; Bruderer et al., 2010; Naylor et al., 2010). In this work we present the first extragalactic detections of CH in four prototypical galaxies dominated by starbursts or AGN: NGC 1068, Arp 220, M 82 and NGC 253.
CH can be present in high- or low-density gas depending on the formation scenario. If the abundance of ionized carbon is substantial, CH formation is believed to be initiated by the radiative association of C+ with vibrationally excited molecular hydrogen, H2, in the outer layers of photon-dominated regions (PDRs), where the chemistry is dominated by UV radiation. The chemical network forming CH (described in Black & Dalgarno, 1973) involves the following reactions:
| (1) | |||
CH can be formed in high-density gas via reactions described in Eq. [1] or it can also be produced during CH+ synthesis in lower density material ( cm-3) from MHD shocks (Draine & Katz, 1986; Pineau des Forets et al., 1986). In Galactic star forming regions, CH is about a factor of 1 – 3 more abundant than CH+ (Godard et al., 2012). The most efficient reaction forming CH+ is , which has a high endothermic barrier of 4640 K. This reaction can form CH+ in a dense and highly illuminated PDR but is inefficient in the cold diffuse ISM. The recent investigations by Godard et al. (2012, 2009, also see ()) suggest that CH+ can be produced in the diffuse ISM via kinetic energy from turbulent dissipation. The CH+ molecule is also rapidly destroyed at high densities. By comparing CH/CH+ ratios with other galaxies we can determine whether these molecules are tracing similar environments and densities as the Milky Way (MW) or if their production is influenced by strong starbursts and AGN.
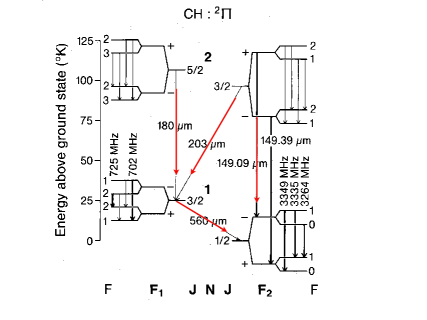
The CH energy level diagram shown in Figure 1 is taken from Stacey et al. (1987). The rotational lines of CH in the submm/FIR have a characteristic doublet pattern due to lambda doubling: the spin-orbit interaction of the unpaired electron splits the rotational levels (N) into two ladders depending on the relative orientation between the electron’s spin and orbital angular momentum vectors. The rotational levels, J, in the individual ladders split into -doublet states (denoted by + or ) from the relative orientations of the electron’s orbital momentum axis and the molecular rotation axis. The magnetic hyperfine interaction further splits the -doublet states. The major rotational transitions at 560 m, 203 m, 180 m, and 149 m (highlighted by the red arrows in Figure 1) are accessible with Herschel. The 560 m transition is the easiest to detect by both the SPIRE Fourier Transform Spectrometer (FTS) and Heterodyne Instrument for the Far Infrared (HIFI) because of their high sensitivity at this wavelength. This transition has six hyperfine components grouped near 532.8 GHz () and 536.8 GHz (), very close in frequency to the HCN and HCO+ J = 6-5 lines and therefore can only be resolved by the higher resolution of HIFI.
In this work we present sub-millimeter observations of these CH lines and additionally CH+ lines from Herschel in four prototypical galaxies: Arp 220 (Starburst/AGN), NGC1068 (AGN Seyfert-2), M82 (Starburst/ no AGN) and NGC 253 (starburst/ no AGN). These observations are presented in Section 2. The properties of molecular gas derived from CH are compared with CO observations to investigate where CH is arising in these galaxies and if its formation in these starburst/AGN dominated galaxies differs from the Milky Way (sections 3 and 4). The feasibility of detecting CH in intermediate- to high-redshift galaxies with ALMA is discussed in section 5.
2 Observations and Data Reduction
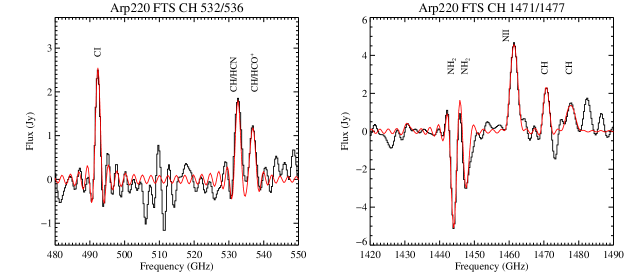
The lowest spin-rotational (560 m) transition of CH has six hyperfine components grouped at 532.8 and 536.8 GHz. We first detected them in the SPIRE-FTS spectrum of Arp 220 (Rangwala et al., 2011, R11 hereafter), as shown in the left panel of Figure 2. In the FTS spectra, they are blended with the HCN and HCO+ J = 6-5 lines. The presence of CH was inferred from the line center of the blended feature and larger line widths than expected from the FTS resolution. The CH lines are resolved in the HIFI data presented here, unambiguously confirming their detection. We also detected the CH 203 m transition, consisting of 8 hyperfine components grouped around 1471 and 1477 GHz, in the same FTS spectra, as shown in the right panel of Figure 2.
We use data from Herschel-HIFI to measure the fluxes of the CH, CH+, HCN and HCO+ lines in the four galaxies. These data come from our Open Time (OT) program (OT1-nrangwal-1) and other programs (both OT and GTO) publicly available on the Herschel Science Archive (HSA). In our OT program we acquired follow-up observations with HIFI to resolve the CH 532/536 GHz lines from the HCN/HCO+ lines. Additionally, we obtained observations and integrated line fluxes (through Private Communication with J. Fischer and E. Sturm) for the CH 149 m and CH 180 m transitions detected in Arp 220 with the PACS spectrometer. The 149 m line was detected in absorption. Due to blending with a strong water line the 180 m CH transition is not easily recoverable and therefore its line flux is not reported. The summary of the observations and various programs is provided in Table 1.
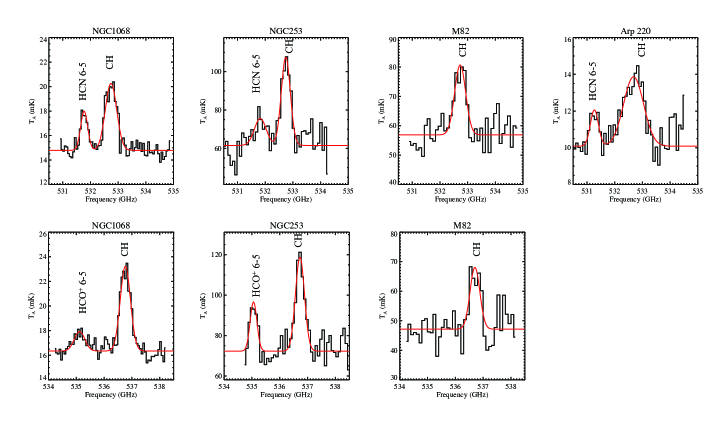
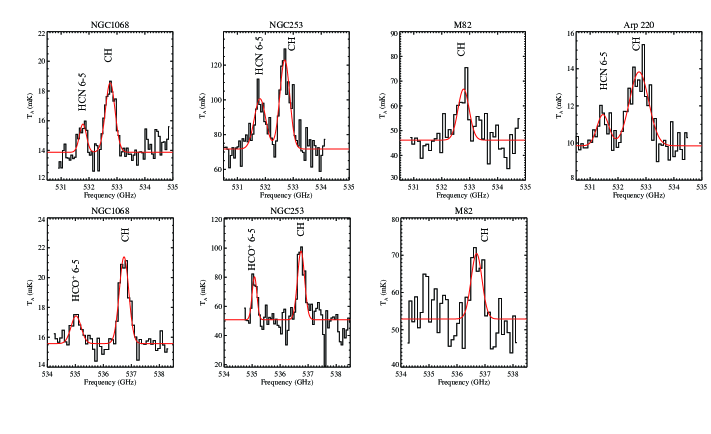
For CH, we used the level-2 HIFI spectra that were reduced with HIPE version 9.0. A Gaussian function was fit to the spectral lines to determine the line width (FWHM) and integrated fluxes. All the spectra were observed in HIFI band-1, in which the baselines are well behaved. We analyzed both V- and H- polarization data separately and report the error-weighted averages of the line widths (FWHM) and integrated fluxes in Table 2. The spectra for the CH 532/536 GHz lines and their Gaussian fits are shown in Figure 3 for the H (top panel) and V (bottom panel) polarizations. The HCN and HCO+ lines are also detected and are separated from the corresponding CH lines by about 1 and 1.7 GHz, respectively. Table 2 lists the rest frequencies, line width FWHMs, line fluxes in Jy km s-1 and W m-2, source or beam size in arcseconds and column densities for CH, HCN and HCO+ calculated for their respective beam or source size (discussed in Section 3).
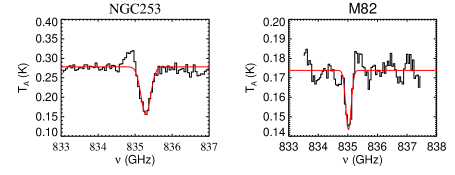
The observations of the CH+ 835 GHz line are available in the literature and on the Herschel Science Archive for the four galaxies presented in this work. For CH+, we use the line fluxes for NGC 1068 and Arp 220 published in Spinoglio et al. (2012, S12 hereafter) and R11, respectively. For NGC 253 and M82, the HIFI CH+ observations are publicly available on HSA. We show these data and their fits in Figure 3. The CH+ appears in absorption in all the galaxies except for NGC 1068, in which it is detected in emission (S12). The equivalent widths and corresponding column densities of CH+ are listed in Table 3.
3 Analysis: Column densities of CH and CH+
The column densities for the transitions of CH, HCN, HCO+ and CH+ are calculated assuming that the lines are optically thin. A more accurate way to measure column density would be to use a non-LTE radiative transfer modeling technique (e.g., see, R11, Kamenetzky et al., 2012). However, this requires observations of several rotational transitions as well as the knowledge of collisional cross-sections (or critical densities) with H2. Since neither are available, an optically thin assumption will give a robust lower limit on the column density.
Under this assumption the column density of an emission line is given by , where is the column density in the upper state, is the line flux in [W m-2], is the Einstein coefficient, is the Planck constant, is the frequency of the line in [Hz], and is the beam or source solid angle in [steradians]. The total column density of a molecule is: , where, is an excitation temperature in [K], is the partition function at and is the degeneracy of level 111The values of upper level degeneracies are obtained from the Splatalogue database.. Except for the CH 149 m line in Arp 220, all other CH, HCN and HCO+ lines appear in emission in all of the galaxies and their column densities for individual transitions estimated according to the above relation are listed in the Table 2.
The column density relation for an optically thin absorption line is given by (Spitzer, 1968), where is the equivalent width, is the column density in the th level, and is the oscillator strength. The unit of the constant in the above equation is [cm]. The column densities of CH+ lines that appear in absorption are listed in Table 3. In the cases of NGC 253 and M 82, there is an overlapping emission line, which may be partially filling in the absorption. Thus, their column densities in Table 3 are listed as a lower limit.
A complete determination of the total CH column density would require all four major rotational transitions or an estimate of . In all of the galaxies except Arp 220 we only detect the 560 m transition. Arp 220, being the brightest nearby ULIRG and an important template for high- galaxies, had much deeper observations from every instrument on Herschel. The S/N in the FTS spectra was high enough to detect the 203 m transition (hyperfine lines grouped around 1471 and 1477 GHz), while the 149 m (in absorption) and 180 m lines were detected in the PACS spectra. This makes Arp 220 the only object in which all four transitions have been detected. Even the MW star-forming regions do not have detections of the other three transitions. We calculated an excitation temperature of K in Arp 220 for the relative populations in the upper states of the 560 m and 203 m transitions, assuming local thermodynamic equilibrium (LTE). This value is comparable to the kinetic temperature of 50 K derived from low-J transitions of CO and CI, which are tracing primarily the cold gas.
Using this excitation temperature we calculate a partition function and derive a total CH column density in Arp 220 of about cm-2. This is only a factor of 2 higher than the column density of the ground state 560 m transition ( cm-2). If the overall excitation of the CH levels is very subthermal, i.e., if for the upper and lower levels of the 560 m line is small compared to /k, it is possible for most of the column density to be in the ground level, in which case the above estimate would be a significant underestimate of the true column density. However, this is a very unlikely scenario for several reasons. The upper level of the 203 m transition lies much further above ground ( K compared with K) than the upper level of the 560 m line. We would therefore generally expect that, if the levels are not in LTE, the excitation temperature characterizing these relative level populations (41 K) will be comparable to or lower than that of the 560 m line222In the limit in which the excitation is very subthermal, i.e., nearly all of the column is in the ground state, it is possible for the excitation temperature of a transition, which describes the relative populations of the upper and lower levels, to approach the gas kinetic temperature, even though the excitation temperatures of these levels defined with respect to the ground level are much lower, and may approach the temperature of the microwave background (assuming no other radiation background is more important). However, this only occurs when the fractional populations in these levels is negligibly small, meaning that the lines would be unobservable.. Additionally, in Arp 220, the 149 m CH line is detected in absorption and therefore gives us a direct measurement of the column density in the ground state. The column density derived from the CH 149 m absorption line is about cm-2, almost an order of magnitude lower than that of the 560 m emission line, confirming that the column density in the ground state is not large compared to the column density derived from the excited-state transitions seen in emission. In fact, the ground state column density is so low compared to that seen in emission that it is likely that there is some emission partially filling in the absorption. However, for the true ground state column density to be much larger than our estimate of the total column density, nearly all of the absorption would need to be filled in by emission, while also leaving an absorption column that is coincidentally within an order of magnitude of the column density estimated from the emission lines. This is a highly improbable scenario. Both the above arguments suggest that in Arp 220, the true CH column density does not significantly differ from the lower limit derived from the 560 m emission line.
For the other three galaxies the 203 m transition is not available and hence we cannot estimate . However, additional information from the HCN and HCO+ J=6-5 lines detected in the same spectra as CH can be used to put reasonable constraints on . The HCN and HCO+ 6-5 lines arise from levels much further above the ground ( K) than the CH 560 m line and have much larger A-coefficients (by about an order of magnitude). If the collisional excitation rate coefficients are similar for the three species, then the critical densities for the HCN and HCO+ lines will be correspondingly larger than for the CH line, and we would expect that the excitation temperatures of the HCN and HCO+ J=6-5 levels will be substantially lower than for the CH 560 m line (unless the line optical depths are large enough that radiative trapping become significant, which is very unlikely for these species). There are no collision rates available in the literature for CH. However, those for OH, which has a very similar electronic structure, are available, and are comparable in magnitude to those for the HCN and HCO+ lines333In fact, for this argument to be invalid, the collision rates for CH would have to anomalously small compared to typical collisional rate coefficients.. For 3 of our 4 galaxies, observations of the HCN J=1-0 transition are available in the literature. We have used these to calculate an excitation temperature for the populations of J=6 relative to J=1. These numbers range from 13 to 16 K, and (noting again that we expect these numbers to in general be lower than for the 560 m transition) argue against a very small for the 560 m line and therefore against a very large ground state column density. Also, in all 4 galaxies the CH 560 m line is substantially brighter than the HCN/HCO+ J=6-5 lines. Given that their abundances (relative to H2) are comparable to the abundance of CH (), it would be very surprising for the CH 560 m line to be much brighter than HCN/HCO+ lines if the CH line has a very low excitation temperature. On the basis of these arguments, we make the reasonable assumption that the excitation temperature in the other galaxies is not very different from Arp 220 and use the CH 560 m line as a proxy for the total CH column density, modulo a factor of 2. Note that the CO-derived temperatures for the cold molecular gas range from about 15 – 50 K in these galaxies (R11, S12, Kamenetzky et al., 2012).
4 CH formation, excitation and CH/CH+ ratio
4.1 Comparing CH and CO Column Densities
The optical observations of CH in the Milky Way show that it primarily arises in the diffuse molecular ( cm-3 and T = 30 - 100 K) and translucent regions ( cm-3 and T = 15 - 50 K) (see review by Snow & McCall, 2006). A translucent cloud is a transition region between diffuse and shielded (fully) molecular gas where the incident UV radiation is becoming attenuated and the is transitioning to C and CO. In these regions CH is a very reliable tracer of molecular hydrogen. Sheffer et al. (2008) compiled observations of CH, CO and H2 for many Galactic lines-of-sight. Their results show unambiguously that CO, CH and H2 are tightly correlated. However, as expected there are breaks in these correlations at the boundaries of the diffuse/translucent and translucent/shielded regions where the abundances of CH and CO change significantly. The CH/CO ratio is much higher () in the translucent regions and starts dropping off dramatically when approaching the shielded and fully molecular regions (CH/CO ) where the carbon is almost entirely in CO and the lack of halts the formation of CH; see equation (1). In Sheffer et al. (2008), the break in the CH/CO ratio occurs around an H2 column density of cm-2. More recently, Qin et al. (2010) used HIFI observations of the hyperfine components of the 560 m line to reach even larger molecular hydrogen column densities: up to cm-2 towards the Sagitarius B2 star-forming region. This allowed them to probe the interior of fully molecular clouds. They found that the linear relationship between CH and H2 found in diffuse and translucent clouds does not continue in the denser clouds (or at higher visual extinction). The CH column density curve flattens around an H2 column density of cm-2, again implying that CH formation declines in denser shielded regions. To understand where CH arises in our sample of four galaxies we compare CO and CH column densities in this section; the CH formation and its abundance could be different from our Galaxy because the molecular ISM of our sample galaxies are significantly influenced by starburst and AGN activity.
Since the rotational lines of CO are bright and easy to observe in galaxies, its emission has been widely used as a tracer of molecular gas mass in galaxies. By comparing the H2 column densities derived from CH and CO we can also assess whether the CH rotational line transition at 560 m can be used as a mass tracer in addition to CO. It will be particularly useful to have an additional molecular hydrogen tracer for measuring gas mass and excitation conditions of redshifted star-forming galaxies. This comparison will also allow us to investigate whether CH is arising in the translucent or shielded interiors of fully molecular clouds in these galaxies.
We estimated the H2 column densities ((H2)) from the observations of CH and CO columns densities (N(CH) and N(CO)). The N(CO) for the four galaxies were derived from non-LTE radiative transfer modeling of the observed CO rotational lines from to . The mid- to high-J lines were observed with the SPIRE-FTS and the low-J measurements are ground-based observations obtained from the literature. The CO spectral line energy distributions (SLEDs) were modeled using a custom version of RADEX (tak07), combined with a likelihood code. For a given set of input parameters (, and N(CO)), the code starts from an optically thin case to generate the initial guess for the level populations then iterates until a self-consistent solution is achieved such that the optical depths of the lines are stable from one iteration to the next. This code can reliably converge for optical depths up to 100. Model CO SLEDs are produced for a wide range in gas parameters (, , etc.) and compared to the observed SLEDs to generate likelihood distributions of , and N(CO). Using multiple CO transitions this code provides a robust determination of the CO column density without requiring an assumption of LTE. The observations, modeling and results for Arp 220, NGC 1068 and M82 are published by R11, S12 (see also Hailey-Dunsheath et al. (2012)), and Kamenetzky et al. (2012). In the cases of the starburst galaxies Arp 220 and M 82, the low-J lines (up to J = 3-2) trace cold molecular gas (: 15 – 50 K), which dominates the mass of the molecular gas, whereas the mid- to high-J lines trace warm molecular gas (: 450 – 1300 K), which dominates the luminosity of the molecular gas. In NGC 1068, which is a Seyfert-2 galaxy, the high-J CO transitions originate in the compact circumnuclear disk and are almost entirely excited by the X-ray radiation from the central AGN. The results for NGC 253 are in preparation; the same procedure as described above was used to derive the column densities for cold and warm CO. Note that in each galaxy the same source size was used to estimate both N(CH) and N(CO).
The summed cold and warm N(CO) is converted to (H2) by using a CO/H2 abundance ratio of (Sheffer et al., 2008) found in the MW clouds. For converting CH column densities to (H2) we use two values of CH/H2 abundance ratio: (a) derived from UV observations of CH and H2 (Sheffer et al., 2008) and (b) derived from the Herschel-HIFI observations of the 560 m CH line in Sgr B2 (M) (Qin et al., 2010). The latter probes a larger H2 column density (deeper into the cloud and higher densities), up to cm-2. Note that (H2) cannot be measured directly in dense clouds and in Qin et al. (2010) it was derived from H13CO+ column densities. These two assumed abundances define the N(H2) range in Table 4.
The H2 column densities as derived from CO and CH are in reasonably good agreement for NGC 1068, implying that both CH and CO are arising in the dense molecular gas with a CH/CO ratio of . This is in contrast to the Milky Way where the CH is primarily in the diffuse/translucent gas and its abundance relative to CO drops significantly in the dense regions to less than (see Figure 9 of Sheffer et al., 2008). This implies that the formation of CH in NGC 1068 is driven by an X-ray Dominated Region (XDR) powered by the luminous AGN. The CH/CO ratios in the other three galaxies are much lower; about in Arp220 and in M82 and NCG 253. If the formation of CH is as in the MW, we would expect a low CH/CO ratio when observing the total line-of-sight molecular hydrogen column density, because it will be dominated by the shielded fully molecular gas where the local CH abundance is very low. Both M82 and NGC 253 have low CH/CO ratios, suggesting that the CH arises in translucent regions in these galaxies also and that the translucent regions contain about 10% of the molecular gas mass. In Arp 220 this ratio is also lower but not as low as in M 82 and NGC 253. There are many factors that make the interpretation for Arp 220 more complex. The dust optical depth in Arp 220 is much higher, such that our assumption of optically thin lines could underestimate the CH column density. Additionally, there is strong evidence of a highly obscured AGN in Arp 220 (R11, Engel et al., 2011; Downes & Eckart, 2007; González-Alfonso et al., 2004), which could affect the abundance of CH by providing alternative chemical formation pathways. The role of AGN in the formation of CH is discussed in detail in the next section in the context of Arp 220 and NGC 1068.
In addition to CH/CO we also compare the ratio of CH/CH+ (listed in Table 3) between our sample galaxies and the Milky Way, where the ratio ranges from (Godard et al., 2012). For M82 and NGC 253 this ratio is , consistent with the Galactic value. But in NGC 1068 and Arp 220 this ratio is unusually high, about 23 and 560, respectively. This is because the N(CH) column density increases with the far-infrared luminosity of the galaxies, similar to CO column density, but N(CH+) is more or less constant within the sample. It is possible that the formation of CH and CH+ in NGC 1068 and Arp 220 is governed by AGN or X-ray dominated regions (XDRs) and not UV radiation; we discuss this possibility in the next section.
4.2 CH Production in XDR Models
To investigate the origin of CH in NGC 1068 and Arp 220, along with the CH/CH+ ratio discrepancy, we have generated XDR models using an updated version of the code described in Maloney et al. (1996). We assume a hard X-ray (1–100 keV) luminosity of ergs s-1, as would be expected for an object of Arp 220’s luminosity if a large fraction of the bolometric luminosity ( ) were produced by an AGN. These models are generated for an object with the properties (such as hydrogen column and X-ray luminosity) of Arp 220 but the results can be applied to other galaxies, as they scale almost linearly with the X-ray luminosity and XDR column density. A power-law index is assumed. Unlike the models in Maloney et al. (1996), we assume a sharp lower energy cutoff of the incident spectrum at 1 keV such that everything except for hard X-rays have already been filtered out by intervening gas closer to the AGN. This assumption affects the results only at column densities cm-2. We assume an XDR column density that ranges from cm-2; note that this column also attenuates the X-ray flux. The upper limit of this range is based on the column density derived for Arp 220 using CO observations (R11). The distance between the XDR and the X-ray source (AGN) is assumed to be 50 pc. The physical and chemical state of the gas is calculated using an iterative scheme; radiative transfer of cooling radiation is handled with an escape probability treatment, including the effects of dust trapping of line photons.
Figure 5 shows contours for N(CH) and the N(CH)/N(CH+) ratio generated by our XDR code for a range of densities and column densities of molecular gas. The kinetic temperature of the gas is over plotted in blue contours. The shaded regions encompass the 2- range of molecular hydrogen column density and gas density derived from CO (listed in Table 3) in Arp 220 and NGC 1068. The hard X-ray photons are capable of penetrating much larger column densities than the UV photons in PDRs, so CH may form through a similar process as described in Equation 1, even deep in molecular clouds. In addition, however, the radiative association reaction and the neutral-neutral reaction , which has a substantial activation barrier, may play a role or even dominate. The last reaction dominates the formation rate in the NGC 1068 portion of Figure 5 (i.e., attenuating columns of about cm-2), while radiative association with contributions from the sequence of equation (1) are more important for the Arp 220 parameters. CH+ formation occurs largely through charge exchange with and , i.e., or else through ion-molecule reactions such as . Our models show that the CH abundance is much larger in an XDR compared to the Milky Way value. This is in agreement with Meijerink et al. (2007), who also find the CH abundance relative to other molecules to be significantly greater in XDRs compared to PDRs.
In NGC 1068, both the observed CH column density and CH/CH+ ratio can be produced by an XDR at densities cm-3. The constraints on the density and temperature of the gas in NGC 1068 were obtained from non-LTE radiative transfer modeling of high-J CO observations from Herschel SPIRE-FTS (S11, Hailey-Dunsheath et al., 2012). It was found that the high-J lines tracing the molecular gas in the central region () of NGC 1068 were excited by an AGN and the gas density and kinetic temperature were constrained to lie between cm-3 and 170 – 570 K, respectively. This shows that both CH and CO observations can be reproduced for similar excitation conditions, suggesting that the CH and CO are most likely coming from the compact nuclear region of NGC 1068 and tracing the same gas. This also explains why the hydrogen columns derived from CH and CO are in good agreement in this case. This is the only object in our sample for which CH formation can be unambiguously explained by an XDR. This, combined with a large difference ( order of magnitude) in the relative abundance of [CH/CO] between NGC 1068 and the three starburst galaxies suggests that the CH/CO ratio could potentially serve as an AGN diagnostic. Note that for the above analysis we are using a lower limit on the total CH column density. The total CO column density is robustly determined from non-LTE modeling of multiple CO transitions. Thus, a lower limit on the total CH column density will give a lower limit on the CH/CO ratio. As mentioned in section 3, at a kinetic temperature of K (as measured in CO cold molecular gas) the total CH column density is underestimated only by a factor of 2. In NGC 1068, where the CH appears to be arising in a warmer CND, the CH column density will likely be underestimated by a larger factor driving the CH/CO ratio even higher.
The situation is more complex in Arp 220. R11 found using CO observations that the density of the molecular gas was constrained very tightly around cm-3. Therefore, the molecular gas as traced by CO emission cannot arise in an XDR because at such low gas densities, the high ionization fractions result in rapid chemical destruction of the CO. A non-ionizing source, such as mechanical energy from stellar winds and supernovae, could explain the total observed CO luminosity in Arp 220. If CH and CO originate from the same molecular component then the CH column density and formation also cannot be explained by an XDR with a density of . Figure 5 shows that in the XDR models the expected column density of CH would be an order of magnitude higher than observed given the density and column density constraints of Arp 220. A lower CH/CO ratio implies that the CH in Arp 220 is arising in the translucent regions similarly to M82 and NGC 253. We note that the H2 column densities derived from CH and CO differ by a factor between 3 – 6, which would imply that 15% - 30% of the molecular mass is in the diffuse-translucent phase. This mass fraction is higher than expected but the assumed CH/H2 abundance used in converting the CH column density into an H2 column density has a large uncertainty.
The very high CH/CH+ ratio in Arp 220, compared to the MW and other galaxies, also cannot be reproduced by an XDR at low gas densities. This leads us to consider another possibility - the unresolved CH+ line observed in Arp 220 is also a mixture of emission and absorption, as seen in the CH 149 m line, which would make its true column density higher and hence the actual CH/CH+ ratio could be as much as an order of magnitude lower than the observed value of 560. This is a very reasonable possibility for Arp 220 because other molecular lines have been observed in emission as well as absorption (e.g., HCN).
In conclusion, in NGC 1068 the formation of CH and CO in the molecular gas is consistent with an XDR suggesting that the CH/CO ratio could potentially be a powerful AGN diagnostic tool. The other three galaxies have much smaller CH/CO ratios suggesting that CH is tracing the molecular gas in translucent regions and its formation mechanisms are similar to the MW.
4.3 CH Excitation: Radiation versus Collisions
In the Milky Way, the CH rotational lines tracing the diffuse ISM are believed to be radiatively excited by the cosmic microwave background radiation (Gerin et al., 2010; Bruderer et al., 2010). In our sample of galaxies, the dust radiation field can be much more intense than in the Milky Way. For example, in Arp 220, the dust optical depths are high and the dust temperature is K. At this temperature, the radiative pumping rate () is assuming a blackbody and no geometric dilution. In comparison, the collision rate of CH (with H2) is for a gas density of cm-3 (determined from CO modeling in our previous work) and an assumed collision cross-section of (e.g., bertojo76); the collision cross-sections for CH are not available in the literature and the value used here is an approximation. Plausible corrections for optical depth and geometric dilution are unlikely to substantially reduce the large gap between the radiative and collisional excitation rates. Thus, we believe that the CH is most likely excited by radiation in Arp 220. Similar gas densities ( cm-3) in M82 and NGC 253 and the large difference in the radiative and collision rates suggest that CH is most likely also radiatively excited in these galaxies. In NGC 1068, the gas density in the CND is much higher () and the dust optical depths are much lower in Arp 220. The optical depth is lower in M82 and NGC 253 also, but not likely enough to disfavor radiative excitation. For optically thin dust emission, the background radiation field is dominated by the cosmic microwave background radiation, and collisional excitation/de-excitation are more important than radiation excitation.
5 Detecting CH in High- Galaxies
Our observations of CH in four nearby galaxies suggest that the CH/CO ratio can potentially be used as an AGN diagnostic. This is also supported by the models of Meijerink et al. (2007), in which the CH abundance is significantly enhanced relative to other molecules in interstellar media of galaxies with AGN. However, more observations are needed to establish the CH/CO ratio as an AGN diagnostic. This would be extremely useful for probing AGN activity in high- galaxies, for which determining the presence of an AGN and its influence on the excitation of the molecular ISM is challenging. In addition, determining whether CH is coming from diffuse or dense gas will allow us to determine mass fraction and excitation of the diffuse and dense molecular gas in high-z galaxies. With the ALMA observatory CH observations can be made for galaxies with redshift . ALMA’s large bandwidth will allow simultaneous measurements of HCN and HCO+ lines, enabling the determination of other line ratios, such as CH/HCN, CH/HCO+ and HCN/HCO+, which can also provide additional AGN diagnostics (Meijerink et al. 2007). Furthermore, for galaxies at , multiple CH rotational transitions are accessible with ALMA, increasing the accuracy of the measurements of molecular mass and excitation conditions, such as kinetic temperature and gas density. However, theoretical calculations of CH collisional cross-sections are needed for non-LTE radiative transfer modeling. A CH and CO line survey for an adequate sample can be easily accomplished with only a few hours of integration time with ALMA, which will allow us to determine whether (a) CH is arising in the diffuse, translucent or dense molecular gas, (b) it is tracing different temperature and density gas compared to CO, and (c) it can be used as a potential AGN-diagnostic line.
References
- Black & Dalgarno (1973) Black, J. H., & Dalgarno, A. 1973, Astrophys. Lett., 15, 79
- Bruderer et al. (2010) Bruderer, S., Benz, A. O., van Dishoeck, E. F., Melchior, M., Doty, S. D., van der Tak, F., Stäuber, P., Wampfler, S. F., Dedes, C., Yıldız, U. A., Pagani, L., Giannini, T., de Graauw, T., Whyborn, N., Teyssier, D., Jellema, W., Shipman, R., Schieder, R., Honingh, N., Caux, E., Bächtold, W., Csillaghy, A., Monstein, C., Bachiller, R., Baudry, A., Benedettini, M., Bergin, E., Bjerkeli, P., Blake, G. A., Bontemps, S., Braine, J., Caselli, P., Cernicharo, J., Codella, C., Daniel, F., di Giorgio, A. M., Dominik, C., Encrenaz, P., Fich, M., Fuente, A., Goicoechea, J. R., Helmich, F., Herczeg, G. J., Herpin, F., Hogerheijde, M. R., Jacq, T., Johnstone, D., Jørgensen, J. K., Kristensen, L. E., Larsson, B., Lis, D., Liseau, R., Marseille, M., McCoey, C., Melnick, G., Neufeld, D., Nisini, B., Olberg, M., Parise, B., Pearson, J. C., Plume, R., Risacher, C., Santiago-García, J., Saraceno, P., Shipman, R., Tafalla, M., van Kempen, T. A., Visser, R., & Wyrowski, F. 2010, A&A, 521, L44+
- Downes & Eckart (2007) Downes, D., & Eckart, A. 2007, A&A, 468, L57
- Draine & Katz (1986) Draine, B. T., & Katz, N. 1986, ApJ, 310, 392
- Engel et al. (2011) Engel, H., Davies, R. I., Genzel, R., Tacconi, L. J., Sturm, E., & Downes, D. 2011, ApJ, 729, 58
- Falgarone et al. (2010) Falgarone, E., Godard, B., Cernicharo, J., de Luca, M., Gerin, M., Phillips, T. G., Black, J. H., Lis, D. C., Bell, T. A., Boulanger, F., Coutens, A., Dartois, E., Encrenaz, P., Giesen, T., Goicoechea, J. R., Goldsmith, P. F., Gupta, H., Gry, C., Hennebelle, P., Herbst, E., Hily-Blant, P., Joblin, C., Kaźmierczak, M., Kołos, R., Krełowski, J., Martin-Pintado, J., Monje, R., Mookerjea, B., Neufeld, D. A., Perault, M., Pearson, J. C., Persson, C., Plume, R., Salez, M., Schmidt, M., Sonnentrucker, P., Stutzki, J., Teyssier, D., Vastel, C., Yu, S., Menten, K., Geballe, T. R., Schlemmer, S., Shipman, R., Tielens, A. G. G. M., Philipp, S., Cros, A., Zmuidzinas, J., Samoska, L. A., Klein, K., Lorenzani, A., Szczerba, R., Péron, I., Cais, P., Gaufre, P., Cros, A., Ravera, L., Morris, P., Lord, S., & Planesas, P. 2010, A&A, 521, L15
- Federman et al. (1997) Federman, S. R., Welty, D. E., & Cardelli, J. A. 1997, ApJ, 481, 795
- Gerin et al. (2010) Gerin, M., de Luca, M., Goicoechea, J. R., Herbst, E., Falgarone, E., Godard, B., Bell, T. A., Coutens, A., Kaźmierczak, M., Sonnentrucker, P., Black, J. H., Neufeld, D. A., Phillips, T. G., Pearson, J., Rimmer, P. B., Hassel, G., Lis, D. C., Vastel, C., Boulanger, F., Cernicharo, J., Dartois, E., Encrenaz, P., Giesen, T., Goldsmith, P. F., Gupta, H., Gry, C., Hennebelle, P., Hily-Blant, P., Joblin, C., Kołos, R., Krełowski, J., Martín-Pintado, J., Monje, R., Mookerjea, B., Perault, M., Persson, C., Plume, R., Salez, M., Schmidt, M., Stutzki, J., Teyssier, D., Yu, S., Contursi, A., Menten, K., Geballe, T. R., Schlemmer, S., Morris, P., Hatch, W. A., Imram, M., Ward, J. S., Caux, E., Güsten, R., Klein, T., Roelfsema, P., Dieleman, P., Schieder, R., Honingh, N., & Zmuidzinas, J. 2010, A&A, 521, L16
- Godard et al. (2012) Godard, B., Falgarone, E., Gerin, M., Lis, D. C., De Luca, M., Black, J. H., Goicoechea, J. R., Cernicharo, J., Neufeld, D. A., Menten, K. M., & Emprechtinger, M. 2012, A&A, 540, A87
- Godard et al. (2009) Godard, B., Falgarone, E., & Pineau Des Forêts, G. 2009, A&A, 495, 847
- González-Alfonso et al. (2004) González-Alfonso, E., Smith, H. A., Fischer, J., & Cernicharo, J. 2004, ApJ, 613, 247
- Hailey-Dunsheath et al. (2012) Hailey-Dunsheath, S., Sturm, E., Fischer, J., Sternberg, A., Graciá-Carpio, J., Davies, R., González-Alfonso, E., Mark, D., Poglitsch, A., Contursi, A., Genzel, R., Lutz, D., Tacconi, L., Veilleux, S., Verma, A., & de Jong, J. A. 2012, ApJ, 755, 57
- Kamenetzky et al. (2012) Kamenetzky, J., Glenn, J., Rangwala, N., Maloney, P., Bradford, M., Wilson, C. D., Bendo, G. J., Baes, M., Boselli, A., Cooray, A., Isaak, K. G., Lebouteiller, V., Madden, S., Panuzzo, P., Schirm, M. R. P., Spinoglio, L., & Wu, R. 2012, ApJ, 753, 70
- Maloney et al. (1996) Maloney, P. R., Hollenbach, D. J., & Tielens, A. G. G. M. 1996, ApJ, 466, 561
- Naylor et al. (2010) Naylor, D. A., Dartois, E., Habart, E., Abergel, A., Baluteau, J.-P., Jones, S. C., Polehampton, E., Ade, P., Anderson, L. D., André, P., Arab, H., Bernard, J.-P., Blagrave, K., Bontemps, S., Boulanger, F., Cohen, M., Compiègne, M., Cox, P., Davis, G., Emery, R., Fulton, T., Gry, C., Huang, M., Joblin, C., Kirk, J. M., Lagache, G., Lim, T., Madden, S., Makiwa, G., Martin, P., Miville-Deschênes, M.-A., Molinari, S., Moseley, H., Motte, F., Okumura, K., Pinheiro Gonçalves, D., Rodón, J. A., Russeil, D., Saraceno, P., Sidher, S., Spencer, L., Swinyard, B., Ward-Thompson, D., White, G. J., & Zavagno, A. 2010, A&A, 518, L117
- Pineau des Forets et al. (1986) Pineau des Forets, G., Flower, D. R., Hartquist, T. W., & Dalgarno, A. 1986, MNRAS, 220, 801
- Qin et al. (2010) Qin, S.-L., Schilke, P., Comito, C., Möller, T., Rolffs, R., Müller, H. S. P., Belloche, A., Menten, K. M., Lis, D. C., Phillips, T. G., Bergin, E. A., Bell, T. A., Crockett, N. R., Blake, G. A., Cabrit, S., Caux, E., Ceccarelli, C., Cernicharo, J., Daniel, F., Dubernet, M.-L., Emprechtinger, M., Encrenaz, P., Falgarone, E., Gerin, M., Giesen, T. F., Goicoechea, J. R., Goldsmith, P. F., Gupta, H., Herbst, E., Joblin, C., Johnstone, D., Langer, W. D., Lord, S. D., Maret, S., Martin, P. G., Melnick, G. J., Morris, P., Murphy, J. A., Neufeld, D. A., Ossenkopf, V., Pagani, L., Pearson, J. C., Pérault, M., Plume, R., Salez, M., Schlemmer, S., Stutzki, J., Trappe, N., van der Tak, F. F. S., Vastel, C., Wang, S., Yorke, H. W., Yu, S., Zmuidzinas, J., Boogert, A., Güsten, R., Hartogh, P., Honingh, N., Karpov, A., Kooi, J., Krieg, J.-M., Schieder, R., Diez-Gonzalez, M. C., Bachiller, R., Martin-Pintado, J., Baechtold, W., Olberg, M., Nordh, L. H., Gill, J. L., & Chattopadhyay, G. 2010, A&A, 521, L14
- Rangwala et al. (2011) Rangwala, N., Maloney, P. R., Glenn, J., Wilson, C. D., Rykala, A., Isaak, K., Baes, M., Bendo, G. J., Boselli, A., Bradford, C. M., Clements, D. L., Cooray, A., Fulton, T., Imhof, P., Kamenetzky, J., Madden, S. C., Mentuch, E., Sacchi, N., Sauvage, M., Schirm, M. R. P., Smith, M. W. L., Spinoglio, L., & Wolfire, M. 2011, ApJ, 743, 94
- Sheffer et al. (2008) Sheffer, Y., Rogers, M., Federman, S. R., Abel, N. P., Gredel, R., Lambert, D. L., & Shaw, G. 2008, ApJ, 687, 1075
- Snow & McCall (2006) Snow, T. P., & McCall, B. J. 2006, ARA&A, 44, 367
- Spinoglio et al. (2012) Spinoglio, L., Pereira-Santaella, M., Busquet, G., Schirm, M. R. P., Wilson, C. D., Glenn, J., Kamenetzky, J., Rangwala, N., Maloney, P. R., Parkin, T. J., Bendo, G. J., Madden, S. C., Wolfire, M. G., Boselli, A., Cooray, A., & Page, M. J. 2012, ApJ, 758, 108
- Spitzer (1968) Spitzer, Jr., L. 1968, Dynamics of Interstellar Matter and the Formation of Stars, ed. Middlehurst, B. M. & Aller, L. H. (the University of Chicago Press), 1–+
- Stacey et al. (1987) Stacey, G. J., Lugten, J. B., & Genzel, R. 1987, ApJ, 313, 859

| Galaxy | Lines | OBSID | OD | tint (s) | Program ID |
|---|---|---|---|---|---|
| M 82 | CH 560, HCN 6-5 | 1342232963 | 925 | 94 | OT1 (N. Rangwala) |
| M 82 | CH 560, HCO+ 6-5 | 1342232964 | 925 | 82 | OT1 (N. Rangwala) |
| M82 | CH+ 359 | 1342246037 | 1106 | 1995 | OT2 (E. Falgarone) |
| NGC 1068 | CH 560, HCN 6-5 | 1342247837 | 1154 | 6891 | OT1 (N. Rangwala) |
| NGC 1068 | CH 560, HCO+ 6-5 | 1342237609 | 980 | 7137 | OT1 (N. Rangwala) |
| NGC 253 | CH 560, HCN 6-5 | 1342210772 | 568 | 64 | KPGT (R. Guesten) |
| NGC 253 | CH 560, HCO+ 6-5 | 1342210773 | 568 | 40 | KPGT (R. Guesten) |
| NGC 253 | CH+ 359 | 1342212138 | 595 | 348 | KPGT (R. Guesten) |
| Arp 220 | CH 560, HCN 6-5 | 1342262569 | 1357 | 3453 | OT2 (P. Maloney) |
| Arp 220-FTS | CH 560 | 1342190674 | 275 | 10445 | KPGT (C. Wilson) |
| Arp 220-FTS | CH 203 | 1342190674 | 275 | 10445 | KPGT (C. Wilson) |
| Arp 220-PACS | CH 149 | 1342191305 | 289 | 3447 | KPGT (E. Strum) |
| Arp 220-PACS | CH 180 | 1342191309 | 289 | 3505 | KPGT (E. Strum) |
| Galaxy | Molecule/ | Line Width | Flux | Flux | SizeaaThe Size column refers to FTS beam size for M 82 and NGC 253, and source size for Arp 220 and NGC 1068. | ||
|---|---|---|---|---|---|---|---|
| Transition | (GHz) | km s-1 | (Jy km s-1) | ( W m-2) | () | (cm-2) | |
| M82 | CH 560 | 532.730 | 265 18 | 3414 170 | 6.10 0.30 | 43.5 | 1.38E+13 |
| M82 | CH 560 | 536.760 | 240 18 | 2829 267 | 5.10 0.48 | 43.5 | 1.12E+13 |
| NGC1068 | CH 560 | 532.730 | 255 7 | 635 22 | 1.10 0.04 | 4.0 | 2.95E+14 |
| NGC1068 | CH 560 | 536.760 | 235 5 | 725 21 | 1.30 0.04 | 4.0 | 3.38E+14 |
| NGC1068 | HCN 6-5 | 531.716 | 170 9 | 211 16 | 0.37 0.03 | 4.0 | 6.19E+12 |
| NGC1068 | HCO+ 6-5 | 535.062 | 245 21 | 202 13 | 0.36 0.02 | 4.0 | 3.46E+12 |
| NGC253 | CH 560 | 532.730 | 225 8 | 6052 242 | 11.00 0.43 | 43.5 | 2.49E+13 |
| NGC253 | CH 560 | 536.760 | 190 8 | 4928 235 | 8.80 0.42 | 43.5 | 1.94E+13 |
| NGC253 | HCN 6-5 | 531.716 | 275 18 | 3187 259 | 5.70 0.46 | 43.5 | 8.06E+11 |
| NGC253 | HCO+ 6-5 | 535.062 | 127 8 | 1972 147 | 3.50 0.26 | 43.5 | 2.84E+11 |
| Arp220 | CH 560 | 532.730 | 470 20 | 986 54 | 1.80 0.09 | 1.3 | 4.57E+15 |
| Arp220 | HCN 6-5 | 531.716 | 227 25 | 230 32 | 0.41 0.06 | 1.3 | 6.49E+13 |
| Arp220-FTS | CH 560bbblended with HCO+ 6-5 | 536.760 | … | 1025 114 | 1.80 0.20 | 1.3 | 4.43E+15 |
| Arp220-FTS | CH 203 | 1470.660 | … | 1506 482 | 7.40 2.40 | 1.3 | 1.13E+15 |
| Arp220-FTS | CH 203 | 1477.620 | … | 1507 500 | 7.40 2.50 | 1.3 | 1.15E+15 |
| Arp220-PACS | CH 149 | 2010.45 | 272 | -5268 260 | -34.7 1.7 | 1.3 | 1.00E+15 |
| Galaxy | ReferenceaaReferences for CH+ data | |||
|---|---|---|---|---|
| m | (cm-2) | |||
| Arp 220 | 0.19 | 560 | Rangwala et al. (2011) | |
| NGC 1068 | – | 23 | Spinoglio et al. (2012) | |
| NGC 253 | 0.14 | This Work | ||
| M 82 | 0.074 | This Work |
| Galaxy | X[CH/CO]aaDerived using the CH 560 m line | [N(H]CHbbSee text in Section 4.1 for explanation of ranges | [N(H2)]CO | ReferencesccReferences for CO measurements | |
|---|---|---|---|---|---|
| () | (cm-2) | (cm-2) | |||
| Arp 220 | Rangwala et al. (2011) | ||||
| NGC 1068 | Spinoglio et al. (2012) | ||||
| NGC 253 | This Work | ||||
| M 82 | This Work |