Role of vibrational entropy in the stabilization of the high-temperature phases of iron
Abstract
The phonon dispersions of the bcc and fcc phases of pure iron (-Fe, -Fe and -Fe) at ambient pressure were investigated close to the respective phase transition temperatures. In the open bcc structure the transverse phonons along T and T are of particularly low energy. The eigenvectors of these phonons correspond to displacements needed for the transformation to the fcc -phase. Especially these phonons, but also all other phonons soften considerably with increasing temperature. Comparing thermodynamic properties of the fcc and the two bcc phases it is shown that the high temperature bcc phase is stabilized predominantly by vibrational entropy, whereas for the stabilization of the fcc phase electronic entropy provides an equal contribution.
pacs:
63.20.D-,63.70.+h,81.30.KfI Introduction
The majority of metals crystallize from the melt in the open body-centered cubic structure, and the largest part of those transforms martensitically to a close-packed structure at lower temperatures. While the latter fact has been understood since a long time as the optimal solution to the electrostatic attraction between valence electrons and ionic cores subject to closed-shell repulsion Fuchs (1935), proposals to motivate the preference for the open structure at high temperatures have been controversial. The classical explanations due to Zener Zener (1947) and Friedel Friedel (1974) identify the gain in vibrational entropy due to specific low-energy phonons to be responsible, a view which is shared by the majority of later numerical calculations Ye et al. (1987); Rubini and Ballone (1993); Osetsky and Serra (1998); Dai et al. (2003); Souvatzis et al. (2008) (but see Ref. Willaime and Massobrio, 1989 for a conflicting result). Direct experimental studies, where available, confirm the dominant contribution of vibrational entropy for the thermodynamic stability of bcc structures at high temperatures, e.g., for the transition metals of group 3 and 4 Petry et al. (1991); Heiming et al. (1991); Güthoff et al. (1993); Petry (1995), and the general necessity of considering the role of vibrations in the thermodynamics of materials, specifically at high temperatures, is recognized Fultz (2010).
The polymorphism of iron, a system with strong magnetic interactions, is of particular interest in this context. Pure iron solidifies at in the bcc -phase and undergoes a first transition to fcc -Fe at . Very unusual, with decreasing temperature it transforms back to the bcc -phase at . Within the -phase a magnetic transition occurs at , below of which -Fe is ferromagnetic Chen and Sundman (2001).
The occurrence of the bcc -phase is understood in the framework of band magnetism Hasegawa and Pettifor (1983) as being due to ferromagnetic contributions to the total energy, which can be reproduced by density-functional calculations in the generalized-gradient approximation Singh et al. (1991); Herper et al. (1999). In contrast to the proposal of the 2-state model Kaufman et al. (1963), the dominant view nowadays is that with the loss of magnetic correlations at higher temperatures a single paramagnetic fcc -phase results, as it corresponds to the non-magnetic structure of lowest total energy Singh et al. (1991); Leonov et al. (2011). The small region of paramagnetic -Fe is thought to be due to the persistence of local moments even above Leonov et al. (2011); Anisimov et al. (2012).
More controversial are explanations for the transition, i.e., the question why Fe adopts again bcc in its high temperature phase. Published records of theoretical calculations focussing either purely on the electronic Hasegawa and Pettifor (1983) or vibrational Osetsky and Serra (1998); Sandoval et al. (2009) contribution to the entropy generally find that the effect considered in the respective studies suffices for explaining the observed behaviour, while semi-empirical fits to experimental data (e.g., Kaufman et al., 1963; Grimvall, 1976) favor electronic reasons (but see Ref. Grimvall, 1976 for an overview of the widely differing assumptions in such approaches). Part of the interest in the -phase is due to the fact that a paramagnetic bcc structure with reduced lattice constant is also proposed for the earth inner core, stabilized by vibrational entropy Yoo et al. (1993); Vočadlo et al. (2003); Belonoshko et al. (2003); Luo et al. (2010).
By measuring the phonon dispersion of -Fe for the first time together with temperature-dependent dispersions for - as well as -Fe we are able to determine the vibrational entropy of the distinct ambient-pressure iron phases purely from experiment and to evaluate the role of vibrational entropy in stabilizing the high-temperature phases.
II Experimental details
Several large single crystals of the -phase with a typical size of 40 to in length and in diameter were grown from high purity (4N) Fe rods by the zone melting technique using our combined single crystal growth and measuring furnace Flottmann et al. (1987). After the in-situ growth on the three-axis spectrometer they were kept continuously above the transition temperature . To suppress evaporation of the sample over the course of the measurement (the evaporation rate under vacuum at was estimated to ) a high purity Argon atmosphere of was used. The temperature could be stabilized within with a gradient along the single crystalline part of the sample of about . The absolute temperature was calibrated by the known transition temperatures and .
High purity single crystals of the -phase with in diameter and variable length were grown by recrystallization at the Max-Planck-Institut für Metallforschung, Stuttgart. A standard resistance furnace has been used to heat the crystals under vacuum with an accuracy of . Heating these -Fe single crystals into the -phase transformed them to a nearly perfect powder (polycrystalline) sample. However, cycling approximately ten times through the - transition finally led to the growth of a -single crystal by recrystallization.
The measurements in the -phase were performed at the three-axis spectrometer 1T at the LLB, Saclay, in the -phase at spectrometer E7 at the HMI, Berlin and those in the -phase at spectrometer IN3 at the ILL, Grenoble. For all measurements a pyrolytic graphite monochromator and analyzer were used in constant final wave-vector mode.
III Phonon dispersions
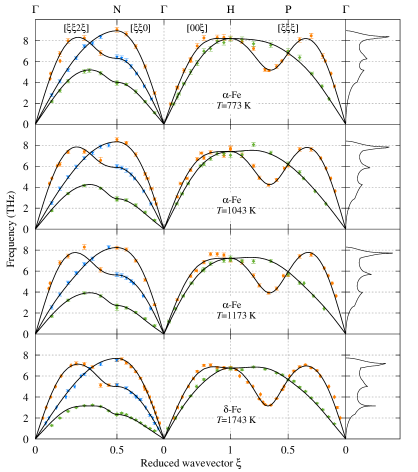
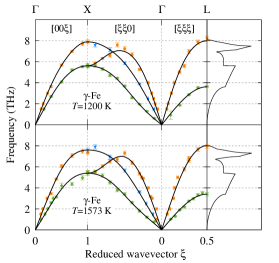
The phonon dispersions of bcc iron were measured at , , (preliminarily published in Ref. Neuhaus et al., 1997) and . In the -phase experiments were done at and . All measurements cover the main symmetry directions and, for the bcc phases, additionally the direction. The obtained phonon frequencies are presented in figure 1 (see the supplemental material sup for the data). Within the bcc-phases a softening of the entire phonon dispersion is observed when passing from room temperature (cp. Refs. Brockhouse et al., 1967; Bergsma et al., 1967; Minkiewicz et al., 1967; van Dijk and Bergsma, 1968; Klotz and Braden, 2000) to . Most pronounced, however, is the decrease of the transverse branches T and T, reducing to a value of 53% at the zone boundary in the -phase compared to room temperature. This softening has a nonlinear temperature dependence, particularly around the ferromagnetic transition as observed earlier de Vallêra (1977); *vallerajphyscoll1981; Satija et al. (1985). Interestingly, recent finite-temperature ab-initio calculations show that a variety of independent phenomena can give rise to this effect: dynamical mean-field theory Leonov et al. (2012) (treating electronic excitations), density-functional theory under disordered local moment paramagnetism Körmann et al. (2012) as well as self-consistent lattice dynamics Luo et al. (2010) (treating anharmonic effects) agree that the softening with temperature is strongest for this branch. Our data also display an increase of the linewidth of these phonons with increasing temperature in the order of , however the damping of transverse phonons in the -phase is considerably smaller than in the -phase.
| 44.53 | (49) | 41.99 | (37) | 41.23 | (36) | 35.95 | (21) | |
| 1.10 | (68) | -1.99 | (50) | -3.35 | (49) | -2.76 | (24) | |
| 11.44 | (90) | 7.50 | (62) | 7.51 | (61) | 9.34 | (37) | |
| 0.18 | (46) | 0.65 | (34) | -0.14 | (34) | -0.98 | (19) | |
| 2.91 | (42) | 2.72 | (33) | 3.20 | (31) | 0.85 | (16) | |
| -0.27 | (31) | -0.04 | (25) | -0.48 | (25) | 1.07 | (10) | |
| -0.60 | (45) | -0.16 | (34) | 0.27 | (35) | -0.87 | (24) | |
| -0.15 | (22) | 0.12 | (16) | 0.19 | (17) | -0.18 | (10) | |
| -0.07 | (15) | -0.13 | (12) | 0.12 | (11) | 0.25 | (7) | |
| -0.16 | (21) | -0.24 | (16) | -0.33 | (16) | -0.22 | (5) | |
| -0.09 | (15) | 0.24 | (12) | 0.34 | (11) | 0.22 | (4) | |
| 0.50 | (26) | 0.50 | (22) | 0.47 | (21) | 1.56 | (11) | |
| -0.34 | (47) | 0.13 | (36) | 0.18 | (34) | -0.40 | (18) |
Concerning phonon anomalies, i.e., low frequencies and strong damping along T and T, the dispersion of -Fe resembles to the high temperature phases of group 3 (including some lanthanides) and 4 metals Petry et al. (1991); Heiming et al. (1991); Güthoff et al. (1993); Trampenau et al. (1991); Petry et al. (1993); Nicolaus et al. (2001). These anomalies are indicative for latent instabilities towards a transition to a close-packed structure Petry (1995). As in the case of La and Ce, Fe transforms to the fcc structure, in contrast to the other group 3 and 4 metals, which transform to hcp. The resulting stacking sequence of close-packed planes necessitates long-wavelength shears, with the corresponding shear constant given by the initial slope of the T phonon branch. Indeed, Table 3 shows that the cubic anisotropy parameter (i.e., the squared ratio of the small- slopes of the acoustic branches), which has values below 6 in the elements transforming to hcp Petry et al. (1991); Heiming et al. (1991); Petry et al. (1993), reaches up to around 10 for Fe, La Petry (1995) and Ce Nicolaus et al. (2001), analogous to the criteria put forward in Ref. Wills et al., 1992. For comparison, Cr Trampenau et al. (1993) and Nb Güthoff et al. (1994), which display the bcc structure over the whole range, have an anisotropy parameter on the order of one. The most remarkable point concerning the -phase dispersions is the positive curvature of the T branch, which reproduces the findings of Zarestky and Stassis Zarestky and Stassis (1987).
IV Data modelling and Born-von Kármán parameters
For deducing further quantitative information we describe the measured phonon dispersions by a Born-von Kármán model (corresponding to the quasi-harmonic assumption). In order to obtain methodically rigorous uncertainties of the estimated quantities, we followed Bayesian inference and generated samples of the Born-von Kármán force constants including interactions up to the fifth nearest neighbor shell for each measured phonon dispersion. We computed the likelihood directly from the experimentally estimated errors. As the information contained in measurements of the high-symmetry directions alone is limited (see for example the pertinent discussion in Ref. Svensson et al., 1967), we used a prior distribution that penalizes high values of the force constants for far shells and non-central forces, as dictated by physical understanding (see supplemental material sup ).
Phonon dispersions corresponding to the resulting expected values of the force constants are shown in figure 1 as solid lines, while an illustration of the uncertainties is given in the supplemental material sup . The Born-von Kármán force constants (mean and standard deviation) are summarized in Tabs. 1 and 2 for the bcc and fcc measurements, respectively. For those sites that are along high-symmetry directions relative to the central atom, we parametrized the model directly in terms of longitudinal and transversal force constants, that is in terms of the eigenvalues of the Jacobi matrices of the forces, while for lower-symmetry shells we give the independent entries with respect to the Cartesian basis of the Jacobi matrices. The parameters for the respective shells’ other sites follow by symmetry.
| 30.16 | (37) | 29.84 | (41) | |
| -2.27 | (48) | -2.16 | (48) | |
| 0.18 | (79) | -1.26 | (83) | |
| -1.90 | (74) | -0.21 | (74) | |
| 0.34 | (35) | 0.15 | (35) | |
| 0.18 | (28) | 0.61 | (29) | |
| -0.01 | (19) | -0.04 | (20) | |
| 0.24 | (17) | 0.27 | (17) | |
| 0.41 | (10) | 0.35 | (12) | |
| 0.85 | (30) | 0.71 | (30) | |
| 0.14 | (32) | 0.25 | (32) | |
| -0.01 | (43) | -0.21 | (43) | |
| 0.27 | (13) | -0.22 | (14) | |
| 0.05 | (22) | -0.32 | (23) | |
| -0.19 | (24) | 0.07 | (24) | |
| 0.14 | (20) | -0.30 | (21) |
The behaviour of the determined BvK-parameters is quite plausible: As expected, the dominant interactions are short-range and of longitudinal nature, while most of the interactions over longer ranges are individually not significantly different from zero (collectively, they are significant, however; setting all of them to zero would give noticeably worse fits). Apart from the softening of the nearest-neighbour longitudinal interaction with temperature, the most striking effect is the behaviour of in the bcc phases: its becoming negative with increasing temperature is the main reason for the softening of the T branch. As this happens around the Curie temperature, it is most probably of magnetic origin and pinpoints the instability of the body-centered lattice with loss of magnetism. Note that the -phase’s comparatively larger long-range BvK-parameters should not be over-interpreted, as they are due to the better statistics of this one measurement (also reflected in the smaller uncertainties).
The generated samples of parameter sets can be used to directly compute thermodynamic quantities. By virtue of this approach, we can quote well-defined estimated errors for the computed quantities that follow directly from the errors of the experimental data points, subject only to the assumption of the Born-von Kármán model and the chosen prior distribution. Figure 1 demonstrates that we do not over-regularize our data, therefore we are confident that our quoted estimated errors are conservative.
The phonon densities of states for each of the measured temperatures as calculated from the force constants by the tetrahedron method Lehmann et al. (1970); *lehmannpssb1972; Jepson and Anderson (1971) are given to the right of the phonon dispersions in figure 1. They show that, according to the model, the softening is not limited to the measured high-symmetry directions, but spans the whole reciprocal space. Note that the spike appearing slightly above in the -phase is due to the flattening of the T branch.
V Thermodynamic quantities
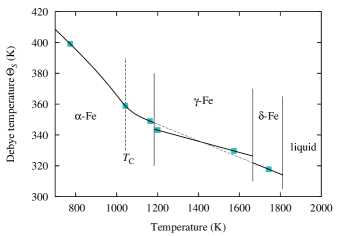
For settling the question for the reason of the existence of the -phase by experiment we computed the distinct thermodynamic quantities related to the phase transitions. The most evident way to report our results is by way of Debye temperatures: We define for a given temperature so that the internal energy of the Born-von Kármán model corresponding to the measured dispersion coincides with the internal energy of the Debye model with as characteristic temperature. is defined analogously via the entropy Schober and Dederichs (1981). The resulting values are given in Table 3. As the temperatures of measurement are much larger than , the harmonic assumption would imply constant Debye temperatures. This is clearly not the case; the phonon softening discussed above leads to decreasing Debye temperatures with increasing temperature. Moreover, a fit with a phenomenological model for the respective structures (see the supplemental material sup for a detailed discussion) given in figure 2 implies that is discontinuous at the phase transitions, which is to be expected for a first-order transition. Our measurements constitute the first experimental determination of the Debye temperature for the high-temperature -phase (cp. Ref. Grimvall, 1976 for the previous uncertainties).
| (K) | (K) | (K) | (GPa) | (GPa) | (GPa) | |||||||
|---|---|---|---|---|---|---|---|---|---|---|---|---|
| 773 | 399.0 | (15) | 398.5 | (15) | 212 | (8) | 112 | (5) | 37 | (4) | 3.1 | (4) |
| 1043 | 363.6 | (15) | 358.5 | (15) | 189 | (7) | 107 | (4) | 16 | (3) | 7.0 | (16) |
| 1173 | 354.5 | (11) | 348.2 | (12) | 190 | (7) | 118 | (5) | 12 | (3) | 10.7 | (33) |
| 1200 | 345.3 | (19) | 342.8 | (19) | 188 | (5) | 87 | (3) | 16 | (2) | 5.7 | (9) |
| 1573 | 333.5 | (24) | 329.5 | (23) | 171 | (5) | 68 | (3) | 18 | (2) | 3.8 | (6) |
| 1743 | 324.1 | (7) | 316.6 | (6) | 158 | (4) | 86 | (2) | 11 | (1) | 8.2 | (6) |
The recommended values for the experimental total latent heat are and Chen and Sundman (2001). Extrapolating our data to the transition temperatures gives the respective contributions of the vibrational entropies as and . In contrast, the differences in internal vibrational energy are only and . These figures show that at the transition about per atom are taken up by the electronic system, as the bcc-phase is energetically still stabilized by magnetic fluctuations. This increase in internal energy is compensated by an increase in entropy, to which the phononic subsystem contributes slightly less than half of the value, the rest being made up by electronic contributions (due to the loss of correlations). At the transition the situation is different: due to the increased temperature, the stabilizing effect of the magnetic fluctuations is lost, and the high-temperature phase again costs in internal electronic energy ( per atom). Comparing our deduced value of with the total entropy difference of shows that this transition is now driven nearly exclusively by the increased vibrational entropy of the open bcc structure. The smallness of the electronic contribution to the entropy is probably due to the electronic structures of both phases being only weakly correlated. Note that our determination of probably even underestimates the actual value, as in the high-temperature bcc phases typically a hardening of selected phonons with increasing temperature is found, resulting in increasing Debye temperatures Heiming et al. (1991).
VI Conclusions
In conclusion we find, by measuring for the first time the phonon response in the high temperature bcc phase of Fe, that the stabilization of the -phase is due to the vibrational entropy of transverse phonons of particular low energy, favoring the picture of a first order transition driven by vibrational entropy Krumhansl and Gooding (1989); Kerr and Rave (1993); Mohn et al. (1996). This result is in full accordance with what we have found for the bcc phases in the nonmagnetic group 3 and 4 metals, but is more surprising for -Fe, where magnetic fluctuations have been suspected to stabilize the body-centered cubic phase Hasegawa and Pettifor (1983). Note that also the high-temperature bcc phase of Ce, another example of a system with a complex phase diagram due to magnetic interactions, has experimentally been found to be stabilized by vibrational entropy Manley et al. (2000); Nicolaus et al. (2001), giving weight to the hypothesis that in general, the existence of high-temperatur bcc phases is due to vibrational entropy.
For the low temperature bcc structure of Fe we find that magnetic contributions establish the ferromagnetic ground state and are responsible for the structural change in the paramagnetic regime, but also for this transition there is a significant vibrational contribution to stabilize fcc-Fe.
Acknowledgments
We would like to thank E. Günther and U. Eßmann from the Max-Planck-Institut für Metallforschung, Stuttgart, for providing the -Fe single crystals, A. Krimmel for assistance during the measurements at the HMI, Berlin, and I. Leonov and D. Vollhardt for discussions and communication of theoretical results. Financial support of the LLB by the HCM program under contract No. ERB CHGECT 920001 and DFG under project PE580/3-1 and the Collaborative Research Center TRR 80 are acknowledged.
Note added in proof
After acceptance of this paper, a theoretical work on the basis of dynamical mean-field theory was reported Leonov et al. (2014), which confirms our interpretation.
References
- Fuchs (1935) K. Fuchs, Proc. R. Soc. Lond. A 151, 585 (1935).
- Zener (1947) C. Zener, Phys. Rev. 71, 846 (1947).
- Friedel (1974) J. Friedel, J. Physique Lett. 35, 59 (1974).
- Ye et al. (1987) Y.-Y. Ye, Y. Chen, K.-M. Ho, B. N. Harmon, and P.-A. Lindgård, Phys. Rev. Lett. 58, 1769 (1987).
- Rubini and Ballone (1993) S. Rubini and P. Ballone, Phys. Rev. B 48, 99 (1993).
- Osetsky and Serra (1998) Y. N. Osetsky and A. Serra, Phys. Rev. B 57, 755 (1998).
- Dai et al. (2003) X. Dai, S. Y. Savrasov, G. Kotliar, A. Migliori, H. Ledbetter, and E. Abrahams, Science 300, 953 (2003).
- Souvatzis et al. (2008) P. Souvatzis, O. Eriksson, M. I. Katsnelson, and S. P. Rudin, Phys. Rev. Lett. 100, 095901 (2008).
- Willaime and Massobrio (1989) F. Willaime and C. Massobrio, Phys. Rev. Lett. 63, 2244 (1989).
- Petry et al. (1991) W. Petry, A. Heiming, J. Trampenau, M. Alba, C. Herzig, H. R. Schober, and G. Vogl, Phys. Rev. B 43, 10933 (1991).
- Heiming et al. (1991) A. Heiming, W. Petry, J. Trampenau, M. Alba, C. Herzig, H. R. Schober, and G. Vogl, Phys. Rev. B 43, 10948 (1991).
- Güthoff et al. (1993) F. Güthoff, W. Petry, C. Stassis, A. Heiming, B. Hennion, C. Herzig, and J. Trampenau, Phys. Rev. B 47, 2563 (1993).
- Petry (1995) W. Petry, J. Phys. IV 05, C2-15 (1995).
- Fultz (2010) B. Fultz, Prog. Mater. Sci. 55, 247 (2010).
- Chen and Sundman (2001) Q. Chen and B. Sundman, J. Phase Equilibria 22, 631 (2001).
- Hasegawa and Pettifor (1983) H. Hasegawa and D. G. Pettifor, Phys. Rev. Lett. 50, 130 (1983).
- Singh et al. (1991) D. J. Singh, W. E. Pickett, and H. Krakauer, Phys. Rev. B 43, 11628 (1991).
- Herper et al. (1999) H. C. Herper, E. Hoffmann, and P. Entel, Phys. Rev. B 60, 3839 (1999).
- Kaufman et al. (1963) L. Kaufman, E. V. Clougherty, and R. J. Weiss, Acta Metall. 11, 323 (1963).
- Leonov et al. (2011) I. Leonov, A. I. Poteryaev, V. I. Anisimov, and D. Vollhardt, Phys. Rev. Lett. 106, 106405 (2011).
- Anisimov et al. (2012) V. I. Anisimov, A. S. Belozerov, A. I. Poteryaev, and I. Leonov, Phys. Rev. B 86, 035152 (2012).
- Sandoval et al. (2009) L. Sandoval, H. M. Urbassek, and P. Entel, Phys. Rev. B 80, 214108 (2009).
- Grimvall (1976) G. Grimvall, Phys. Scr. 13, 59 (1976).
- Yoo et al. (1993) C. S. Yoo, N. C. Holmes, M. Ross, D. J. Webb, and C. Pike, Phys. Rev. Lett. 70, 3931 (1993).
- Vočadlo et al. (2003) L. Vočadlo, D. Alfè, M. J. Gillan, I. G. Wood, J. P. Brodholt, and G. D. Price, Nature (London) 424, 536 (2003).
- Belonoshko et al. (2003) A. B. Belonoshko, R. Ahuja, and B. Johansson, Nature (London) 424, 1032 (2003).
- Luo et al. (2010) W. Luo, B. Johansson, O. Eriksson, S. Arapan, P. Souvatzis, M. I. Katsnelson, and R. Ahuja, Proc. Natl. Acad. Sci. USA 107, 9962 (2010).
- Flottmann et al. (1987) T. Flottmann, W. Petry, R. Serve, and G. Vogl, Nucl. Instrum. Methods A 260, 165 (1987).
- Neuhaus et al. (1997) J. Neuhaus, W. Petry, and A. Krimmel, Physica B 234–236, 897 (1997).
- (30) See Supplemental Material at [URL will be inserted by publisher] for experimental data and additional discussion.
- Brockhouse et al. (1967) B. N. Brockhouse, H. E. Abou-Helal, and E. D. Hallman, Solid State Commun. 5, 211 (1967).
- Bergsma et al. (1967) J. Bergsma, C. van Dijk, and D. Tocchetti, Phys. Lett. A 24, 270 (1967).
- Minkiewicz et al. (1967) V. J. Minkiewicz, G. Shirane, and R. Nathans, Phys. Rev. 162, 528 (1967).
- van Dijk and Bergsma (1968) C. van Dijk and J. Bergsma, in Proceeding of a Symposium, IAEA, Vienna (1968), vol. 1, p. 233.
- Klotz and Braden (2000) S. Klotz and M. Braden, Phys. Rev. Lett. 85, 3209 (2000).
- de Vallêra (1977) A. M. de Vallêra, Ph.D. thesis, Cambridge (1977).
- de Vallêra (1981) A. M. de Vallêra, J. Phys. Colloques 42, C6-398 (1981).
- Satija et al. (1985) S. K. Satija, R. P. Comès, and G. Shirane, Phys. Rev. B 32, 3309 (1985).
- Leonov et al. (2012) I. Leonov, A. I. Poteryaev, V. I. Anisimov, and D. Vollhardt, Phys. Rev. B 85, 020401 (2012).
- Körmann et al. (2012) F. Körmann, A. Dick, B. Grabowski, T. Hickel, and J. Neugebauer, Phys. Rev. B 85, 125104 (2012).
- Trampenau et al. (1991) J. Trampenau, A. Heiming, W. Petry, M. Alba, C. Herzig, W. Miekeley, and H. R. Schober, Phys. Rev. B 43, 10963 (1991).
- Petry et al. (1993) W. Petry, J. Trampenau, and C. Herzig, Phys. Rev. B 48, 881 (1993).
- Nicolaus et al. (2001) K. Nicolaus, J. Neuhaus, W. Petry, and J. Bossy, Eur. Phys. J. B 21, 357 (2001).
- Wills et al. (1992) J. M. Wills, O. Eriksson, P. Söderlind, and A. M. Boring, Phys. Rev. Lett. 68, 2802 (1992).
- Trampenau et al. (1993) J. Trampenau, W. Petry, and C. Herzig, Phys. Rev. B 47, 3132 (1993).
- Güthoff et al. (1994) F. Güthoff, B. Hennion, C. Herzig, W. Petry, H. R. Schober, and J. Trampenau, J. Phys.: Condens. Matter 6, 6211 (1994).
- Zarestky and Stassis (1987) J. Zarestky and C. Stassis, Phys. Rev. B 35, 4500 (1987).
- Svensson et al. (1967) E. C. Svensson, B. N. Brockhouse, and J. M. Rowe, Phys. Rev. 155, 619 (1967).
- Lehmann et al. (1970) G. Lehmann, P. Rennert, M. Taut, and H. Wonn, Phys. Status Solidi 37, K27 (1970).
- Lehmann and Taut (1972) G. Lehmann and M. Taut, Phys. Status Solidi B 54, 469 (1972).
- Jepson and Anderson (1971) O. Jepson and O. K. Anderson, Solid State Commun. 9, 1763 (1971).
- Schober and Dederichs (1981) H. R. Schober and P. H. Dederichs, in Metals: Phonon States, Electron States and Fermi Surfaces, edited by K.-H. Hellwege and J. L. Olsen (Springer, Berlin, Heidelberg, New York, 1981), vol. 13a of Landolt-Börnstein New Series — Group III Condensed Matter.
- Krumhansl and Gooding (1989) J. A. Krumhansl and R. J. Gooding, Phys. Rev. B 39, 3047 (1989).
- Kerr and Rave (1993) W. C. Kerr and M. J. Rave, Phys. Rev. B 48, 16234 (1993).
- Mohn et al. (1996) P. Mohn, K. Schwarz, and P. Blaha, J. Phys.: Condens. Matter 8, 817 (1996).
- Manley et al. (2000) M. E. Manley, R. J. McQueeney, J. L. Robertson, B. Fultz, and D. A. Neumann, Phil. Mag. Lett. 80, 591 (2000).
- Leonov et al. (2014) I. Leonov, A. I. Poteryaev, Y. N. Gornostyrev, A. I. Lichtenstein, M. I. Katsnelson, V. I. Anisimov, and D. Vollhardt (2014), eprint arXiv:1403.6497 [cond-mat.str-el].