A new solar fluorine abundance and a fluorine determination in the two open clusters M 67 and NGC 6404.
Abstract
We present a new determination of the solar fluorine abundance together with abundance measurements of fluorine in two Galactic open clusters. We analyzed a sunspot spectrum, observed by L. Wallace and W. Livingston with the FTS at the McMath/Pierce Solar Telescope situated on Kitt Peak and spectra of four giants in the old cluster M 67 (4.5 Gyr) and three giants in the young cluster NGC 6404 (0.5 Gyr), obtained with the CRIRES spectrograph at VLT. Fluorine was measured through synthesis of the available HF lines. We adopted the recent set of experimental molecular parameters of HF delivered by the HITRAN database, and found a new solar fluorine abundance of , in good agreement with the M 67 average fluorine abundance of . The new solar abundance is in a very good agreement with the meteoritic value. The used modern spectrosynthesis tools, the agreement with the meteoritic value and with the results in open cluster M67, known to be a solar analogue, make our solar determination very robust. At the same time, the fluorine measurement in the above-mentioned open clusters is the first step in the understanding of its evolution during the last 10 Gyr in the Galactic disk. In order to develop this project, a larger sample of open clusters is required, so that it would allow us to trace the evolution of fluorine as a function of time and, in turn, to better understand its origin.
1 Introduction
The origin and the evolution of fluorine in the Galaxy are still nowadays a matter of debate. The available observational constraints, coupled with stellar nucleosynthesis models, have not yet clarified which stellar mass ranges and in which evolutionary stages are the mainly responsible for the fluorine production. Therefore, further and new observational evidence is needed, to understand where fluorine is produced and its implications on the stellar nucleosynthesis and Galactic chemical evolution.
The state of the art proposes three means of fluorine production: neutrino spallation on 20Ne in gravitational supernovae (SNII; Woosley & Haxton 1988), hydrostatic nucleosynthesis in the He-burning core of heavily mass-losing Wolf-Rayet (WR) stars (Meynet & Arnould 2000), and hydrostatic nucleosynthesis in the He-rich intershell of thermally pulsing (TP) AGB stars (Busso et al. 1999). It is still unknown which of the three above sources is the main contributor for fluorine.
The above scenario is based on several observational studies that, during the last decade, have been addressed the problem of the fluorine origin and evolution. Fluorine determinations were carried out in different environments: namely: i) in the Large Magellanic Cloud (LMC) (Cunha et al., 2003); ii) the globular cluster M 4 (Smith et al., 2005) and M 22 (D’Orazi et al., 2013); iii) the Milky Way Bulge (Cunha et al., 2008); iv) pre-main sequence stars of the Orion nebula cluster (Cunha & Smith, 2005) and dwarf stars of the solar neighbourhood (Recio-Blanco et al., 2012); v) Galactic and extragalactic asymptotic giant branch (AGB) stars (Abia et al., 2009, 2010, 2011; Uttenthaler et al., 2008); vi) in one hot post-AGB star (Werner et al., 2005); vii) in C-Rich low-metallicity stars (Lucatello et al., 2011); viii) in planetary nebulae (Zhang & Liu, 2005); ix) in the interstellar medium surrounding Type II supernovae (Federman et al., 2005). These recent studies enlarged and in some cases reanalyzed the sample of stars presented in Jorissen et al. (1992).
Almost all the above fluorine analyses have been developed using spectral features of the HF molecule (mostly the R 9 line at =2336.47 nm). A theoretical list of HF molecular parameters (e.g. loggf, Elow), provided by R.H. Tipping (see e.g. Abia et al. 2009), was in general adopted, together with an old solar abundance derived by Hall & Noyes (1969), A(F)⊙=4.56. Very recently, a new list of experimental molecular parameters for the HF molecule has been delivered by the HITRAN database (see Rothman et al., 2013, for details on this database). Therefore, we started a new analysis of the fluorine abundance based on these new data. More in detail: i) we reanalyzed the solar fluorine abundance as observed in sunspot spectra with modern techniques: sunspot specific spectrosynthesis simulations and atmospheric model. ii) We collected, for the first time, spectra of giant star members of two Galactic open clusters (OCs), M 67 and NGC 6404, in the infrared region, where HF lines were detected and analyzed.
The solar fluorine abundance is used as a zero-point for all the other dedicated studies, hence a redetermination in light of the above new molecular parameters and of more recent analysis techniques was needed (see also Asplund et al., 2009).
On the other hand, this work is the starting point of a new project which consists in the fluorine determination in several open clusters, with different ages and Galactocentric distances (RGC). In fact, this investigation offers the opportunity of measuring fluorine evolution during the last 10 Gyr as a function of time. This can be done since the age estimate of OCs can be performed with a smaller uncertainty than for field stars. In turn, the knowledge of the fluorine evolution provides also a further constraint to understand which kind of stars (low mass or more massive stars) is mostly responsible to its production. At the same time, the analysis of the M 67 cluster is also a good test of the solar fluorine determination, since this cluster shows a solar-like abundance distribution and its age, metallicity and RGC resemble those of the Sun, so that it can be considered as a solar analogue cluster.
In Section 2 we describe the observations and the analysis for the fluorine determination in the Sun, while Section 3 is focused on fluorine in open clusters. Section 4 shows our results, while in Section 5 and 6 we discuss results, giving our final conclusions.
2 Observations and Analysis in the Sun
2.1 Umbral atlas
In order to determine the solar fluorine abundance we employed the spectral atlas by Wallace, Hinkle and Livingston (2001) of a medium strong sunspot umbra, observed on 1982 May 16 with the Kitt Peak FTS near disk center (). The spectral atlas has a resolution of . The observed spot had an associated magnetic field strength of 2490 G. We used spectral lines of the OH (in the spectral region around 1.565 m) and CO molecules (near the HF lines we analyzed) to decide on the appropriate effective temperature of models to be used for the fluorine abundance determination. The umbral atlas is corrected for telluric absorption, but not for scattered light originating from the much brighter surrounding photosphere. However, in the infrared the contribution from scattered photospheric light is only of the order of a few percent in the continuum (see Van Ballegooijen, 1984), and should have little effect on the shallow HF lines we employ.
2.2 Tools, molecular parameters, linelist
We determined the abundances of F by fitting the observed spectra with simulated ones.
For fitting the solar umbral atlas we used the RH code of Uitenbroek (2000, 2001, 2004) to calculate molecular spectral lines in LTE from the one-dimensional radiative equilibrium models of Kurucz (1993) with different effective temperatures. The transfer code was used to solve chemical equilibrium for the most abundant molecules in the solar atmosphere, H2, C2, N2, O2, CH, CO, NH, NO, OH, and the HF molecule. Dissociation energies and parametrization with temperature of the equilibrium constants and partition functions for these molecules were taken from Sauval & Tatum (1984). Line lists for the CO and OH molecules were taken from Goorvitch (1994) and Kurucz (http://kurucz.harvard.edu/LINELISTS/LINESMOL/), respectively.
Molecular parameters for HF lines have been recently measured and can be found in the HITRAN database (http://www.cfa.harvard.edu/hitran/). As we said in the Introduction, this is a relevant improvement in fluorine studies, since up to now these data were provided by R.H. Tipping through theoretical calculations. The adopted HF line list is shown in Table 1.
| Line | Wavelength | ELOW | log gf |
|---|---|---|---|
| (nm, in vacuum) | (eV) | ||
| R21 | 2270.898 | 1.124 (1.378) | -4.078 (-4.087) |
| R20 | 2270.175 | 1.026 (1.280) | -4.045 (-4.053) |
| R19 | 2270.569 | 0.932 (1.186) | -4.017 (-4.025) |
| R16 | 2278.447 | 0.674 (0.929) | -3.957 (-3.964) |
| R15 | 2283.310 | 0.597 (0.851) | -3.945 (-3.951) |
| R14 | 2289.298 | 0.524 (0.778) | -3.937 (-3.943) |
| R13 | 2295.792 | 0.455 (0.710) | -3.932 (-3.938) |
| R11 | 2313.473 | 0.332 (0.586) | -3.935 (-3.941) |
| R9 | 2336.470 | 0.227 (0.482) | -3.956 (-3.961) |
| R8 | 2348.803 | 0.182 (0.436) | -3.975 (-3.980) |
| R7 | 2362.997 | 0.142 (0.396) | -4.000 (-4.005) |
| R6 | 2378.434 | 0.107 (0.361) | -4.033 (-4.038) |
| R1 | 2475.206 | 0.005 (0.259) | -4.466 (-4.470) |
In the solar case we accounted for Zeeman splitting in the molecular OH and HF lines (see Berdyugina & Solanki, 2002; Uitenbroek, 2004) due to the 2490 G vertical magnetic field in the observed sunspot umbra. In particular, since the ground state of the HF molecule is X , with a total orbital angular momentum we could use Hund’s case (b) for weak or absent spin-orbital coupling to calculate the line splittings by the Zeeman effect. For most HF lines at the wavelengths of interest the effective Landé factors turned out to be very small, around 0.03 to 0.05, except for the HF R1 line, which has a larger factor of 0.25. Thus, in general the Zeeman effect in HF lines matters very little for the solar fluorine abundance determination from an umbral spectrum.
2.3 Solar fluorine abundance determination
2.3.1 Determination of the Sunspot umbral effective temperature
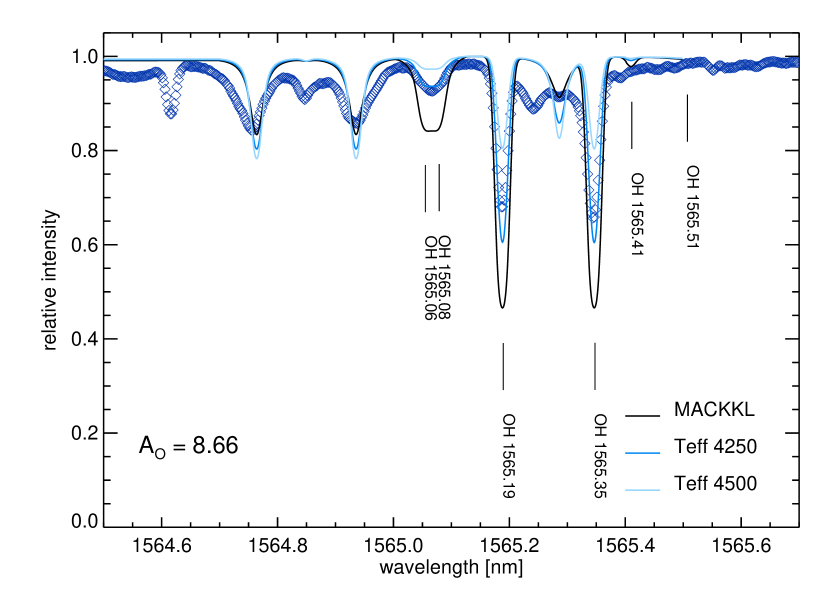
Since the association–dissociation equilibrium of the HF molecule is strongly temperature-dependent we need to accurately determine the effective temperature of the atmospheric model that is most compatible with the solar umbral atlas we used (Section 2.1). We accomplished this by matching CO lines in the range of the pertinent HF lines, and OH lines in the 1.5m wavelength range. In particular, the latter lines are highly temperature sensitive as is clear in Figure 1, which shows the solar umbral atlas (blue diamonds) around 1565 nm, together with three model spectra: the medium umbral model by Maltby et al. (1986, hereafter MACKKL), and two radiative-equilibrium models (with solar gravity) from Kurucz (1993) at effective temperatures of 4500 K (solid, light blue) and 4250 K (medium blue). In all cases a constant vertical magnetic field of 2500 G was imposed, and the Zeeman splitting of the OH lines as well as the Fe I line at 1564.85 nm was accounted for. Zeeman splitting under these conditions does not affect the stronger OH lines at 1565.20 nm and 1565.35 nm much because they have small effective Landé factors of 0.08, while the blended OH lines at 1565.06 nm and 1565.08 nm with Landé factors of 0.18 are slightly broadened. The Fe I is completely split into its three components because of its large Landé factor of 3. Note that the central component in the model is weaker than in the observation because we assumed a vertical field viewed at , while the actual (average) field was most likely not as vertical, and that the aperture of the spectrometer was several arcsec accross allowing it to sample different field strengths and inclinations, explaining the much larger broadening of the iron line spectral components compared to that of the OH lines. Clearly, the K case provided the best match to the OH lines, in particular for the weaker OH lines, which form in the deeper layers of the umbral atmosphere, like the HF lines we analyzed for our abundance determination. We, therefore, adopted this latter model in what follows.
2.3.2 Fluorine in the Sun
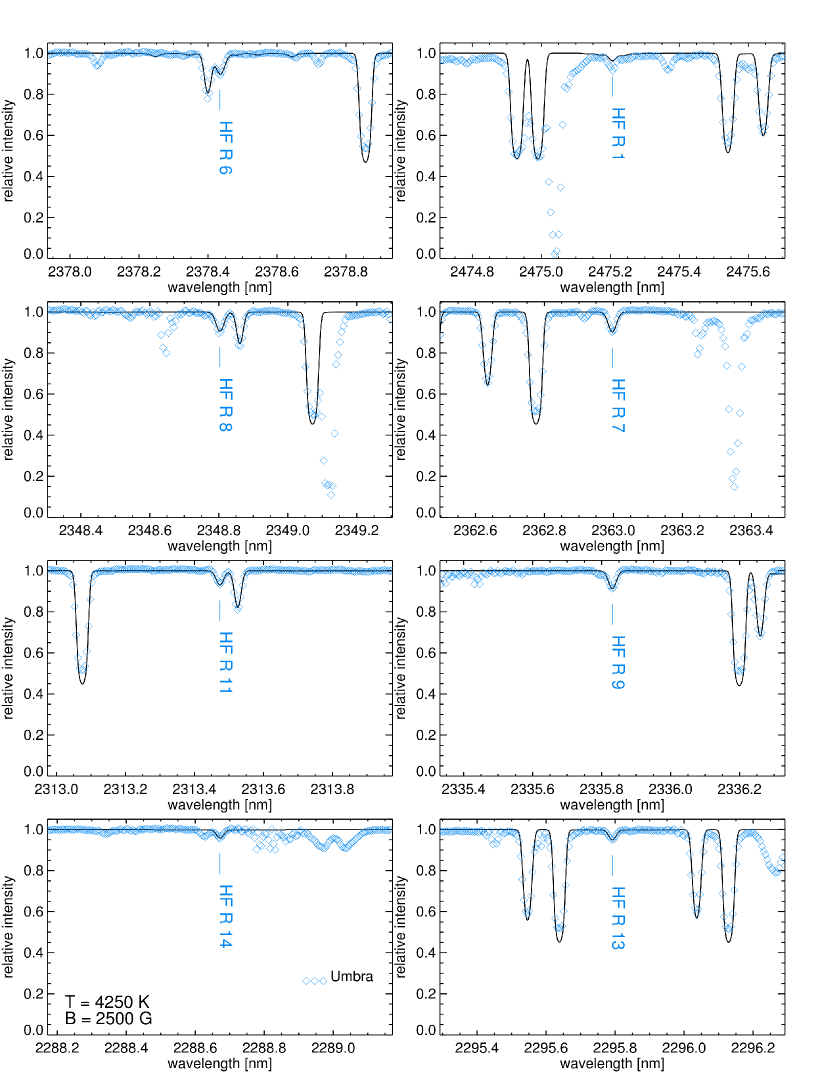
We estimated the Solar fluorine abundance by determining a best fit of the 8 HF feautures visible in the umbral atlas, namely the R1 through R14 lines in the 2.2 – 2.5 m region of the spectrum employing the K radiative equilibrium model with a vertical magnetic field of 2500 G, constant with height. Figure 2 shows the best fit with an abundance of . All HF lines are well reproduced with this value, apart from the R1 line, which forms in a spectral range that is heavily affected by telluric contamination, as are the regions near 2475.05 nm, 2349.13 nm, 2363.35 nm, and 2288.8 nm. Other lines in the 8 spectral windows arise from the CO first overtone vibration–rotation band. The weaker lines of this band, forming in similar layers of the atmosphere as the HF lines are matched very well with the K model atmosphere, indicating that our choice for the effective temperature is appropriate. The stronger CO lines, forming in higher layers are not so well matched, presumably because these layers of the sunspot umbra may not be well described by a hydrostatic radiative equilibrium model that does not account for the structure of the spot’s magnetic field.
The difference between the previously accepted value of the solar fluorine abundance (Hall & Noyes, 1969, , A(F)⊙=4.56) and our result stems mainly from our use of the new experimental lower level energy values provided by the HITRAN data base (see the differences in Table 1). Sources of uncertainty are discussed in Section 2.3.3.
2.3.3 Uncertainties in the Sun
One of the largest uncertainties in the determined solar fluorine abundance is the choice of abundances of oxygen and carbon we used, which influences the choice of the effective temperature of the umbral model. We employed the newer values of and recommended by Asplund et al. (2004) and Asplund et al. (2005), respectively. These values constitute a downward revision from the values obtained with more traditional one-dimensional models that is motivated by modeling in three-dimensional simulations. Using the larger older values of and would force us to adopt a slightly hotter model for the umbra, mainly because the OH lines at 1565 nm would strengthen too much in our canonical model. With the K model the stronger OH lines fit with the larger oxygen and carbon abundances, but the weaker ones are too shallow. The first overtone CO lines near the HF lines are all slightly too deep with the higher effective temperature and the larger abundances. The fluorine abundance needed to fit the higher temperature model is , so that the uncertainty in effective temperature constitutes an uncertainty in the fluorine abundance of about 0.25 dex. Overall, however, the fits for OH, CO and HF lines is better with the smaller oxygen, carbon and fluorine abundances and the 4250 K model. Moreover, given the strongly reduced convection in sunspot umbrae, we feel confident that the newer C and O abundances apply even when we use static one-dimensional atmospheric modeling.
The other factor in the downward revision of the solar fluorine abundance we recommend is the new set of experimental HF line parameters from the HITRAN data base. Indeed, as we said above, the uncertainty in the temperature estimate of the sunspot spectrum could affect the F abundance of about 0.25 dex. If we use the old molecular parameters from Tipping, with the corresponding partition function in the spectrosynthesis code (see Jönsson et al., 2014), and the C, O abundances from Asplund et al. (2004, 2005), we find a best match in the K model of , slightly below the original determination of Hall & Noyes (1969).
3 Observations and Analysis in open clusters
Our sample includes two Galactic open clusters, namely M 67 and NGC 6404. The evolved members of which can be observed with a ground-based 8m-class telescope and are cool enough to allow the detection of HF in their spectra.
M 67 is one of the most widely studied, best-known open clusters. Recent works can be found in Pace et al. (2012); Canto et al. (2011); Sestito & Randich (2005) (lithium abundance), Maiorca et al. (2011); Pancino et al. (2010); Friel et al. (2010); Randich et al. (2006) (elemental abundances), Pasquini et al. (2012) (search for planets), Castro et al. (2011); Brucalassi et al. (2014) (solar twins). Its age and elemental abundances are very close to the solar values.
NGC 6404 has been studied by Carraro et al. (2005) with CCD photometry and more recently by Magrini et al. (2010), who derived spectroscopic abundances of Fe and -elements in four giants. In Table 2 we report the cluster parameters and references.
| OC | E(B-V) | Age | D⊙ | RGC | [Fe/H] | Ref. |
|---|---|---|---|---|---|---|
| (Gyr) | (kpc) | (kpc) | ||||
| M 67 | 0.05 | 4.3 | 0.908 | 8.639 | +0.03 | a |
| NGC 6404 | 0.92 | 0.5 | 1.820 | 6.188 | +0.11 | b |
3.1 Target stars and data reduction
We collected spectra of the OC stars with CRIRES, the Cryogenic Infra-Red Echelle Spectrograph, mounted to the Nasmyth focus A at the 8.2 m Unit Telescope No. 1 (Antu) of ESO’s VLT on Cerro Paranal, Chile. Three giants in NGC 6404 and four giants in M 67 analyzed in this study were observed with CRIRES in 2012 (period 88). The analysis presented here refers to a wavelength setting covering the range 2240-2295 nm (order 25). The slit width was set to 0.2”. The integration time has been calculated through the CRIRES ETC for each target star. A hot standard star at similar air mass was observed immediately afterward.
The raw frames were reduced with the CRIRES pipeline (ver. 2.2.1), and the one-dimensional science and standard star spectra were wavelength-calibrated separately using the numerous telluric absorption lines present on all the four detector arrays. The wavelength-calibration was done separately for the science and telluric standard star spectra because of the limited reproducibility of the Echelle grating position. Finally, the science spectrum was divided by the standard star spectrum to correct for the telluric lines and the illumination pattern as well as possible. Note that the telluric lines are strong enough to be used as wavelength calibrator, but they are weak enough to be corrected for by standard star division; thus they have no influence on the abundance measurements presented here.
| StaraaRandich et al. (2006) | Night of observation | Exp. Time (s) | S/N (pixel) |
|---|---|---|---|
| M 67 | |||
| S364 | 07 Mar 2012 | 60 | 59 |
| S488 | 13 Jan 2012 | 30 | 108 |
| S978 | 13 Jan 2012 | 60 | 89 |
| S1250 | 13 Jan 2012 | 60 | 90 |
| NGC 6404 | |||
| 16 | 10 Mar 2012 | 240 | 109 |
| 27 | 11 Mar 2012 | 240 | 123 |
| 40 | 11 Mar 2012 | 360 | 109 |
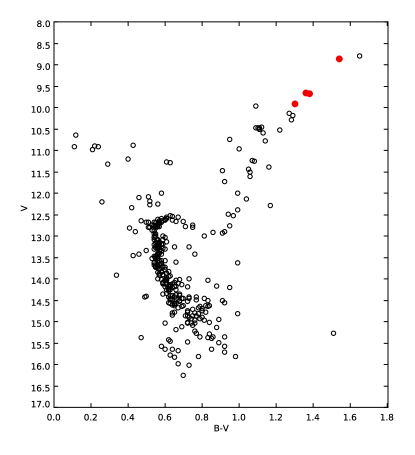
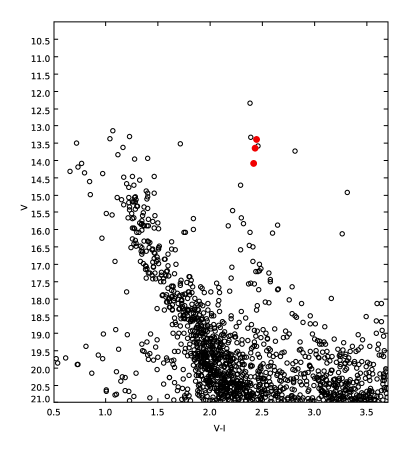
Table 3 shows the details of the observations, while in Table 4 we show the available JHK photometry for the observed stars, taken from the 2MASS catalogue (Skrutskie et al., 2006). JHK values together with the reddening values for each cluster and the Cardelli et al. (1989) extinction calibrations at different bandpasses have been adopted to derive the (J-K)0 values of Table 4. In Figure 3 we show the CMD of the analyzed clusters, with the target stars plotted in red. M 67 giants belong to different stages of the RGB phase, while, according to Magrini et al. (2010), the three giants of NGC 6404 are close to the RGB tip. According to current stellar evolutionary models (see e.g. Cristallo et al., 2009), none of the stars in our sample should have produced or modified fluorine by itself. Hence the F amount has been inherited from previous generations of stars.
Quite obviously, it is crucial to ascertain that the studied stars are real members of the cluster. Magrini et al. (2010) verified this through radial velocities. The membership is also supported by the metal-rich content of them found by previous authors ([Fe/H]=0.07,0.20,0.11 respectively). Moreover, Carraro et al. (2005), in their Figure 8, overplotted an isochrone on the NGC6404 CMD. There one can see that our selected giants all lay on that isochrone. For all the above reasons we are confident about the membership of our analyzed giants.
| Star | J | K | (J-K)0 | Teff | log g | [Fe/H] | |
|---|---|---|---|---|---|---|---|
| (K) | dex | (km s-1) | dex | ||||
| M 67 | |||||||
| S364 | 7.542 | 6.690 | 0.825 | 4207 (4284) | 1.91 (2.20) | 2.5 | 0.03 (-0.02) |
| S488 | 6.010 | 5.010 | 0.963 | 3907 | 1.37 | 2.5 | 0.03 |
| S978 | 7.325 | 6.494 | 0.804 | 4255 | 2.01 | 2.5 | 0.03 |
| S1250 | 7.314 | 6.489 | 0.798 | 4269 | 2.03 | 2.5 | 0.03 |
| NGC 6404 | |||||||
| 16 | 8.716 | 7.427 | 0.797 | 4273 (4450) | 2.04 (1.65) | 2.5 (2.1) | 0.11 (0.07) |
| 27 | 8.989 | 7.685 | 0.812 | 4238 (4400) | 1.97 (1.40) | 2.5 (1.8) | 0.11 (0.20) |
| 40 | 9.471 | 8.098 | 0.881 | 4084 (4250) | 1.68 (2.30) | 2.5 (1.4) | 0.11 (0.11) |
3.2 Fluorine in open clusters
As for the Sun, we determined abundances of F in OCs by fitting the observed spectra with simulated ones.
We used the MOOG code by Sneden (1973), version 2010, to perform the spectrosynthesis. The synthetic spectrum is based on a one-dimensional LTE calculation. The stellar model atmospheres are those provided by Kurucz (1993). Molecular equilibrium is solved for in the models and the Unsld approximation for the collisional broadening is adopted. The linelist and the atomic/molecular parameters have been provided by C. Sneden (private communication) and it is completed with molecular CN and CO species. As for the Sun the HITRAN data were used for the molecular line parameters of HF.
3.2.1 Stellar parameters
We derived temperature, gravity and microturbulence for our stars, from the relations available in Lebzelter et al. (2012). The mean metallicity of the cluster was assumed as the metallicity for each star of the corresponding cluster (references for the cluster metallicities are reported in Table 2). Our results are summarized in Table 4.
Magrini et al. (2010) derived stellar parameters for NGC 6404 stars from spectroscopy, while no similar data are available for our M 67 target stars, with the exception of the giant S364, for which recent spectroscopical derivation of its parameters can be found in Brucalassi et al. (2014) (see Table 4). In order to be homogeneous, we adopted for all the sample stars the parameters coming from photometry. In Section 3.2.4 we will discuss the effect of a change in these values on the fluorine abundance.
3.2.2 CNO estimate

CN lines are present in the observed spectral range and all the analyzed fluorine features in OCs are blended with them. We could not retrieve an independent determination of the C, N and O abundances because CO lines are not detectable in our spectra. Therefore for each star we used 30 CN lines, by which we found the total C+N+O set of abundances that best fits the spectrum. The uncertainty on the above sum is less than 0.1 dex. These estimates have been adopted in the subsequent fluorine determinations, but we underline that they do not provide information on the individual abundance of C, N and O. In Figure 4, we show some examples of synthesis for CN lines.
3.2.3 Fluorine determination
Including the measured C+N+O values for each corresponding star, we performed the HF synthesis. Figure 5 shows an example of the synthesis for the six considered HF lines with four different fluorine abundances in the M 67 giant S488. The lower value corresponds to A(F)=-1.56, while the upper value is equal to the old solar abundance (Hall & Noyes, 1969). Analyzing the spectrum line-by-line in Figure 5, we can point out some features that remain valid also for the rest of the studied stars: line R20 is very weak and only marginally blended with the CN line at 2270.25 nm. Line R19 is partially blended with the CN line at 2270.52 nm, but its contribution to the right wing of the CN line could be clearly detectable. Line R21 is strongly blended with the CN line at the same wavelength, hence its contribution may be detectable in the core of the line. Line R15 is partially blended with a weaker CN line at 2283.36 nm, but its left wing is clearly visible. Line R14 is partially blended with a weaker CN line at 2289.27 nm, but its right wing allows the fluorine determination. Line R16 is almost clean and quite weak, it is the best fluorine indicator in this spectral range. In the next Section we will estimate the effect of the above CN blends on the fluorine abundance together with the uncertainty coming from stellar parameters.


3.2.4 Uncertainties in open clusters
The two main sources of uncertainty are the adopted stellar parameters and the presence of CN blends.
In order to estimate the first one, we varied one stellar parameter at a time leaving the others unchanged. We varied Teff by 150 K, logg by 0.5 and by 1. For each new set of stellar parameters we evaluated the new CNO abundances that well fit the spectrum. Table 5 shows the fluorine variations and allows us to estimate the fluorine abundance with different stellar parameters. In particular using spectroscopic stellar parameters from Magrini et al. (2010), we obtain the following results: NGC6404-16: log(F/H)(spec)-log(F/H) +0.2. NGC6404-27: log(F/H)(spec)-log(F/H) +0.2. NGC6404-40: log(F/H)(spec)-log(F/H) 0.
| Teff+150 | Teff-150 | logg+0.5 | logg-0.5 | +1 | -1 | ||
| (K) | (K) | dex | dex | ||||
| +0.1 | -0.1 | -0.1 | +0.1 | 0.00 | 0.00 | ||
| Fluorine line-by-line variations due to CN blends | |||||||
| CN | R20 | R19 | R21 | R16 | R15 | R14 | Average |
| +0.1 | -0.05 | -0.02 | -0.25 | -0.02 | -0.07 | -0.02 | -0.07 |
| -0.1 | +0.05 | +0.02 | +0.25 | +0.02 | +0.07 | +0.02 | +0.07 |
The influence of CN blends on the above F determination was studied in the following way. We calculated two further synthetic spectra: one with an enhanced (+0.1 dex) CN abundance; the second with a lower (-0.1 dex) CN abundance. Then we derived the fluorine abundance and results are shown in Table 5 (bottom). The first row corresponds to results with an enhanced CN, while the second row refers to the analysis with the lower CN abundance. Each column shows the fluorine abundance variation as derived from the corresponding HF line, while the last column reports the average value of this variation. Only the R21 line shows a large fluorine variation, but it was expected because of the strong and central blend of this line with a CN feature. Finally, we estimated that the CN uncertainty influences the fluorine abundance by less than 0.07 dex.
4 Results
Given the new experimental HF line parameters we recommend a downward revision of the solar fluorine abundance from the old value of determined by Hall & Noyes (1969) to the new value of , where the error is based on the uncertainty of the atmospheric model that best matches the temperature structure of the observed sunspot umbra.
For the OCs we present the results of our analysis in Table 6. It shows the fluorine log(F/H) (with log(X/H)= log(N(X)/N(H)) + 12) as derived from each line (column 2-7). The star mean abundance is shown in column 8. The cluster mean fluorine abundance is also given. The uncertainty associated with the single line abundance corresponds to the of the synthesis. This latter corresponds to the standard deviation of the distribution of the residuals between the original spectrum and our best synthesis. We calculated the residuals over a wide portion of the spectrum (not only along the HF lines). Hence, the standard deviation of the distribution includes also the uncertainty in the continuum placement and the point-to point scatter. Despite this, for the uncertainty in the cluster mean abundance, we prefer to adopt the star-to-star abundance scatter as our best estimate of the error in the analysis. We then added to this the uncertainties due to blends with CN lines and due to the determination of atmospheric parameters. We note that the warmer stars in the two clusters show abundances systematically higher (by about 0.1 dex) with respect to the cooler giants S488 (in M 67) and 40 in (NGC 6404). This behaviour is motivated by the fact that in warmer stars, the fluorine detection is more difficult, HF lines are less visible and less sensitive to abundance variations. Although in the cluster mean abundances we attributed the same weight to all the analyzed stars, we consider the estimates in the two cooler stars as more reliable.
| Log(F/H) | Log(F/H)(avg) | ||||||
| Line | R20 | R19 | R21 | R15 | R14 | R16 | |
| Star | |||||||
| M 67-S364 | 4.460.10 | 4.460.10 | 4.460.08 | 4.460.10 | 4.560.08 | 4.500.06 | |
| M 67-S488 | 4.360.05 | 4.360.05 | 4.560.05 | 4.360.05 | 4.360.05 | 4.360.05 | 4.390.08 |
| M 67-S978 | 4.560.10 | 4.560.10 | 4.560.10 | 4.460.10 | 4.540.10 | ||
| M 67-S1250 | 4.460.10 | 4.560.07 | 4.560.07 | 4.530.10 | |||
| M 67 mean abundance = 4.490.20 | |||||||
| Star | |||||||
| NGC 6404-16 | 4.460.08 | 4.660.08 | 4.660.08 | 4.590.12 | |||
| NGC 6404-27 | 4.66 | 4.66 | 4.660.08 | 4.560.10 | 4.610.07 | ||
| NGC 6404-40 | 4.560.10 | 4.460.05 | 4.660.08 | 4.460.05 | 4.460.05 | 4.460.05 | 4.510.08 |
| NGC 6404 mean abundance = 4.570.20 | |||||||
5 Discussion
Our new solar determination of the fluorine abundance represents a strong improvement with respect to the previous analysis by Hall & Noyes (1969). In fact, we adopted for the first time a set of experimental molecular parameters, modern spectrosynthesis tools, recent models of stellar atmosphere, we considered the magnetic field and the Zeeman splitting and a modern solar abundance compilation. All of these issues led us to a better description of the observed sunspot spectrum (e.g., good fit of all the CO, OH and HF features) and to a downward revision of the solar fluorine abundance, that now turns out to be A(F)=4.400.25. The new experimental molecular data are the main responsible for this revision, as we showed in Section 3.4. The error mainly reflects the uncertainty in the temperature determination of the sunspot spectrum.
We note that our new solar fluorine is in a very good agreement with the meteoritic value, A(F)=4.42 from Lodders et al. (2009). Moreover, we find that the very good abundance agreement between our solar determination and those in the M 67 giants, is a further strong test for the reliability of our solar result. As we said in the introduction, the M 67 cluster shows chemical abundances very similar to the Sun for all the studied elements. Our analyzed giants have not modified their initial fluorine abundance, therefore we expect, and actually find the same agreement between the M 67 and solar fluorine abundance, as for the other elements. Moreover, the analysis that we performed in its giant stars is completely different from that required in the Sun (e.g., no magnetic field, different spectrosynthesis code). Essentially, for the same metallicity, we made here two independent, different and careful analyses of fluorine, one in M 67 and one in the Sun. This results in a very good agreement and makes our estimate quite robust.
Considering fluorine in OCs, in a recent paper by Nault & Pilachowski (2013), F abundance was determined in the Hyades, NGC 752, and M 67 clusters. Their different set of molecular parameters and solar fluorine abundance makes a comparison of their work with our results very difficult. A fluorine enhancement at younger ages is found by Nault & Pilachowski (2013), but they used several upper limits for the fluorine abundance. With our two determinations of fluorine in M 67 and NGC 6404 we can also contribute to trace the trend of the fluorine abundance with age. Indeed, the two clusters have very different age: 4.3 Gyr M 67; 0.5 Gyr NGC 6404 (see Table 2).
We notice that the cloud from which NGC 6404 formed, received the yields of the nucleosynthesis of long-lived low-mass AGB stars (mass below 1.5 M⊙). On the contrary, stars less massive than 1.5 M⊙ did not have time to contribute to the chemical composition of the old M 67 primordial cloud. Therefore differences in the fluorine abundance in these OCs could be the signature of nucleosynthesis in the above low mass AGB stars. Recent works on stellar theoretical models (see Maiorca et al., 2012; Trippella et al., 2014) suggest that low mass AGB stars should have a larger 13C-14N pocket than previously assumed. These works explored the influence of a larger reservoir rich in neutron capture products and their parents. Since 14N is responsible for the fluorine production, an increase of its content inside low mass AGB stars could affect their fluorine production. The observation of the fluorine abundance in several open clusters with different ages, started in this work, will allow us: i) to trace the evolution of fluorine during the last 5-6 Gyr up to very recent periods; ii) through chemical evolution models, to estimate the contribution from low mass AGB stars; iii) to compare the latter with the prescriptions of the quoted new theoretical models. Looking at our cluster mean abundances, we find that the [F/H] ratio is slightly overabundant in the younger open cluster NGC 6404. The difference between the two OCs is however only 0.1 dex, well below the uncertainty of each measure, hence we are not yet able to provide convincing constraints to the fluorine evolution. Moreover, the two OCs are located at very different RGC and have a different metallicity. Indeed looking at the [F/Fe] ratios in the two analyzed OCs, we find solar [F/Fe] values in both, that in turn would indicate that the fluorine evolution is not strongly influenced by low-mass stars.
To summarize, new measurements of fluorine in many other open clusters are required. In particular, determinations in several OCs at different bins of Galactocentric radius and age are needed, in order to trace the fluorine evolution in different zones of the Galaxy. This would enhance the statistics of the analysis and would produce a more robust result even in this case, where individual abundance determinations are affected by uncertainties of around 0.2 dex.
6 Conclusions
-
•
We derived a new solar fluorine abundance in the spectral atlas of Wallace, Hinkle and Livingston (2001) of a medium strong sunspot umbra. We used experimental molecular data from the HITRAN database for the HF lines and modern spectrosynthesis tools, taking into account the magnetic field of the sunspot: our result is A(F)⊙=4.400.25.
-
•
We collected new spectra in the infrared region, with the CRIRES spectrograph, for 7 giant stars of two open clusters: M 67 and NGC 6404.
-
•
We derived fluorine abundances for the observed stars using: i) stellar parameters derived with photometric calibrations, and ii) the synthesis of their spectra. Uncertainties due to CN blends and stellar parameters were evaluated. The total error was estimated to be 0.20 dex. The abundance in M 67 is in a very good agreement with our new solar estimate, while fluorine in the younger OC NGC 6404 is 0.1 dex higher than the value in M 67. Looking at [F/Fe] ratios, we found solar values in the two analyzed OCs.
-
•
Future studies of fluorine in several other open clusters with different ages and located at different RGC, will allow us to trace its evolution in different zones of the Galaxy. It will also show the relevance of the AGB contribution to the synthesis of fluorine, improving our understanding of the its origin.
References
- Abia et al. (2009) Abia, C.; Recio-Blanco, A.; de Laverny, P., 2009 ApJ 694, 971A
- Abia et al. (2010) Abia, C., Cunha, K., Cristallo, S. et al., 2010 ApJ 717, L47
- Abia et al. (2011) Abia, C., Cunha, K., Cristallo, S. et al., 2011 ApJ 737L, 8A
- Anders & Ebihara (1982) Anders, E.; Ebihara, M., 1982 GeCoA 46, 2363A
- Anders & Grevesse (1989) Anders, E. & Grevesse, N., 1989 Geochim. Cosmochim. Acta 53, 197
- Asplund et al. (2004) Asplund, M., Grevesse, N., Sauval, A. J., Allende Prieto, C., Kiselman, D. 2004, A&A 417, 751
- Asplund et al. (2005) Asplund, M., Grevesse, N., Sauval, A. J., Allende Prieto, C., Blomme, R. 2005, A&A 431, 693
- Asplund et al. (2009) Asplund, M., Grevesse, N., Sauval, A.J., Scott, P., 2009 ARA&A 47, 481A
- Berdyugina & Solanki (2002) Berdyugina, S.V. & Solanki, S.K., 2002, A&A 385, 701
- Brucalassi et al. (2014) Brucalassi, A.; Pasquini, L.; Saglia, R.; Ruiz, M. T.; Bonifacio, P.; Bedin, L. R.; Biazzo, K.; Melo, C.; Lovis, C.; Randich, S., 2014, A&A 561L, 9B
- Busso et al. (1999) Busso, M., Gallino, R., & Wasserburg, G.J. 1999, ARA&A 37, 231
- Caffau et al. (2008) Caffau, E.; Ludwig, H.-G.; Steffen, M.; Ayres, T. R., 2008 A&A 488, 1031C
- Caffau et al. (2009) Caffau, E.; Maiorca, E.; Bonifacio, P., 2009 A&A 498, 877C
- Canto et al. (2011) Canto Martins B.L., Lebre A., Palacios A. et al., 2011 A&A 527A, 94C
- Cardelli et al. (1989) Cardelli, Jason A.; Clayton, Geoffrey C.; Mathis, John S., 1989 ApJ 345, 245C
- Carraro et al. (2005) Carraro, Giovanni; Méndez, René A.; Costa, Edgardo, 2005 MNRAS 356, 647C
- Castro et al. (2011) Castro, M.; Do Nascimento, J. D., Jr.; Biazzo, K.; Meléndez, J.; de Medeiros, J. R., 2011 A&A 526A, 17C
- Cristallo et al. (2009) Cristallo, S., Straniero, O., Gallino, R., et al., 2009 ApJ 696, 797
- Cunha et al. (2003) Cunha, Katia; Smith, Verne V.; Lambert, David L.; Hinkle, Kenneth H., 2003 AJ 126, 1305C
- Cunha & Smith (2005) Cunha, Katia; Smith, Verne V., 2005 ApJ 626, 425C
- Cunha et al. (2008) Cunha, Katia; Smith, Verne V.; Gibson, Brad K., 2008 ApJ 679L, 17C
- D’Orazi et al. (2009) D’Orazi, V., Magrini, L., Randich, S., et al., 2009 ApJ 693, 31
- D’Orazi et al. (2013) D’Orazi, V., Lucatello, S., Lugaro, M., et al., 2013 ApJ 763, 22D
- Federman et al. (2005) Federman, S. R.; Sheffer, Yaron; Lambert, David L.; Smith, V. V., 2005, ApJ 619, 884F
- Friel et al. (2010) Friel E.D., Jacobson H.R. and Pilachowski C.A., 2010 AJ 139, 1942F
- Goorvitch (1994) Goorvitch,D., 1994 ApJS 95, 535G
- Hall & Noyes (1969) Hall, D. N. B.; Noyes, R. W., 1969 ApL 4, 143H
- Jorissen et al. (1992) Jorissen, A.; Smith, V. V.; Lambert, D. L., 1992 A&A 261, 164J
- Jönsson et al. (2014) Jönsson, H.; Ryde, N.; Harper, G. M.; Cunha, K.; Schultheis, M.; Eriksson, K.; Kobayashi, C.; Smith, V. V.; Zoccali, M., 2014, A&A 564A, 122J
- Kurucz (1993) Kurucz, R. L. 1993, ATLAS9 Stellar Atmosphere Programs (Kurucz CD-ROM No. 13)
- Lebzelter et al. (2012) Lebzelter, T.; Uttenthaler, S.; Busso, M.; Schultheis, M.; Aringer, B., 2012 A&A 538A, 36L
- Lodders et al. (2009) Lodders, K.; Palme, H.; Gail, H.-P, 2009 LanB 4B, 44L
- Lucatello et al. (2011) Lucatello, S., Masseron, T., Johnson, J. A., Pignatari, M., & Herwig, F. 2011, ApJ, 729, 40
- Lugaro et al. (2004) Lugaro, Maria; Ugalde, Claudio; Karakas, Amanda I. et al., 2004 ApJ 615, 934L
- Magrini et al. (2010) Magrini, L.; Randich, S.; Zoccali, M. et al., 2010 A&A 523A, 11M
- Maiorca et al. (2011) Maiorca, E.; Randich, S.; Busso, M.; Magrini, L.; Palmerini, S., 2011 ApJ 736, 120M
- Maiorca et al. (2012) Maiorca, E.; Magrini, L.; Busso, M. et al., 2012 ApJ 747, 53M
- Maltby et al. (1986) Maltby, P.; Avrett, E. H.; Carlsson, M.; Kjeldseth-Moe, O.; Kurucz, R. L.; Loeser, R., 1986, ApJ 306, 284M
- Meynet & Arnould (2000) Meynet, G.; Arnould, M., 2000 A&A 355, 176M
- Mermilliod (1995) Mermilliod, J.-C, 1995, ASSL 203,127M
- Nault & Pilachowski (2013) Nault, K. A.; Pilachowski, C. A., 2013, AJ 146, 153N
- Pace et al. (2012) Pace, G.; Castro, M.; Meléndez, J.; Théado, S.; do Nascimento, J.-D., Jr., 2012 A&A 541A, 150P
- Pancino et al. (2010) Pancino, E., Carrera, R., Rossetti, E., Gallart, C., 2010 A&A 511, 56
- Pasquini et al. (2012) Pasquini, L.; Brucalassi, A.; Ruiz, M. T. et al., 2012 A&A 545A, 139P
- Randich et al. (2006) Randich, S., Sestito, P., Primas, F., Pallavicini, R., & Pasquini, L., 2006 A&A 450, 557
- Recio-Blanco et al. (2012) Recio-Blanco, A., de Laverny, P., Worley, C., et al. 2012, A&A, 538, A117
- Rothman et al. (2013) Rothman, L. S., Gordon, I. E., Babikov, Y., et al. 2013, J. Quant. Spec. Radiat. Transf., 130, 4R
- Sanders (1977) Sanders, W. L., 1977, A&AS 27,89S
- Sauval & Tatum (1984) Sauval, A. J.; Tatum, J. B., 1984, ApJS 56, 193S
- Sestito & Randich (2005) Sestito P. and Randich S., 2005 A&A 442, 615S
- Skrutskie et al. (2006) Skrutskie, M. F.; Cutri, R. M.; Stiening, R. et al., 2006 AJ 131, 1163S
- Smith et al. (2005) Smith, Verne V.; Cunha, Katia; Ivans, Inese I. et al., 2005 ApJ 633, 392S
- Sneden (1973) Sneden, C. A., 1973 ApJ 184, 839
- Trippella et al. (2014) Trippella, O.; Busso, M.; Maiorca, E.; Käppeler, F.; Palmerini, S., 2014, arXiv 1403,6256T (accepted by the ApJ)
- Uitenbroek (2000) Uitenbroek, H., 2000 ApJ 531, 571
- Uitenbroek (2001) Uitenbroek, H., 2001 ApJ 557, 389
- Uitenbroek (2004) Uitenbroek, H., 2004 ApJ 604, 960
- Uttenthaler et al. (2008) Uttenthaler, S.; Aringer, B.; Lebzelter, T. et al., 2008 ApJ 682, 509U
- Van Ballegooijen (1984) Van Ballegooijen, A. A., 1984, SoPh 91, 195V
- Wallace, Hinkle and Livingston (2001) “Sunspot Umbral Spectra in the Region 4000 to 8640 cm-1 (1.16 to 2.50 microns), N.S.O. Technical Report #01-001.
- Werner et al. (2005) Werner, K.; Rauch, T.; Kruk, J. W., 2005 A&A 433, 641W
- Woosley & Haxton (1988) Woosley, S. E.; Haxton, W. C., 1988 Natur. 334, 45W
- Zhang & Liu (2005) Zhang, Y., & Liu, X.-W. 2005, ApJ, 631, L61