Interpretation of Solar Irradiance Monitor measurements through analysis of 3D MHD simulations.
Abstract
Measurements from the Solar Irradiance Monitor (SIM) onboard the SORCE mission indicate that solar spectral irradiance at Visible and IR wavelengths varies in counter phase with the solar activity cycle. The sign of these variations is not reproduced by most of the irradiance reconstruction techniques based on variations of surface magnetism employed so far, and it is not clear yet whether SIM calibration procedures need to be improved, or if instead new physical mechanisms must be invoked to explain such variations. We employ three-dimensional magneto hydrodynamic simulations of the solar photosphere to investigate the dependence of solar radiance in SIM Visible and IR spectral ranges on variations of the filling factor of surface magnetic fields. We find that the contribution of magnetic features to solar radiance is strongly dependent on the location on the disk of the features, being negative close to disk center and positive toward the limb. If features are homogeneously distributed over a region around the equator (activity belt) then their contribution to irradiance is positive with respect to the contribution of HD snapshots, but decreases with the increase of their magnetic flux for average magnetic flux larger than 50 G in at least two of the Visible and IR spectral bands monitored by SIM. Under the assumption that the 50 G snapshots are representative of quiet Sun regions we find thus that the Spectral Irradiance can be in counter-phase with the solar magnetic activity cycle.
1 Introduction
Solar irradiance, the radiative energy flux the Earth receives from the Sun at its average orbital distance, varies along with magnetic activity, over periods of days to centuries and presumably even on longer time scales. The magnitude of irradiance variations strongly depends on wavelength. The precise measurement of irradiance over the spectrum is becoming more and more compelling, because of the increasing evidence of the effects of these variations on the chemistry of the Earth’s atmosphere and terrestrial climate (e.g. Lockwood, 2012; Ermolli et al., 2013, and references therein). However, absolute measurement of spectral irradiance variations, especially over time scales longer than a few solar rotations, is seriously hampered by difficulties in determining degradation of instrumentation in space. Therefore, calibrations of radiometric measurements have to rely significantly on inter-calibration with other instruments and/or reconstructions through models based on proxies of magnetic activity.
In this context, recent measurements obtained with the Spectral Irradiance Monitor (SIM; Harder et al., 2005) radiometers on board the Solar Radiation and Climate Experiment (SORCE; Rottman, 2005), which show an irradiance signal at Visible and IR spectral bands in counterphase with the solar cycle (Harder et al., 2009), have been strongly debated. This result was confirmed by Preminger et al. (2011), who found that variations in irradiance of solar and solar-like stars in red and blue continuum band-passes is in counter phase with their activity cycle. By contrast, recent results obtained from the analysis of VIRGO/SOHO (Fröhlich et al., 1995) data at visible spectral ranges (Wehrli et al., 2013) show signals in phase with the magnetic cycle. Theoretically, most of the irradiance reconstruction techniques which usually reproduce more than of variations of total solar irradiance (i.e., the irradiance integrated over the whole spectrum), produce irradiance variations at SIM Visible and Infrared bands that are in phase with the magnetic cycle (see Ermolli et al., 2013, for a review). The Spectral and Total Irradiance REconstruction models for Satellite Era (SATIRE) produce a signal slightly in counter-phase in the IR (e.g. Ball et al., 2011). The only reconstructions that produce a signal in counter-phase with the magnetic activity cycle on both visible and IR bands are those obtained with the Solar Radiation Physical Modelling (SRPM) tools (Fontenla et al., 2012), which, on the other hand, have been criticized for being explicitly constructed to reproduce SIM measurements.
Given the above controversy it is still an open question whether SIM finding of counter phase spectral variation in visible and IR bands is the result of a problem with internal calibration procedures, or if instead current modeling is not adequate in reproducing irradiance variations at those spectral ranges. In particular the physical cause of long-term variations is still unclear having been attributed alternatively to changes in quiet Sun magnetism that is mostly hidden in full-disk observations (Fontenla et al., 2012), or to a change of the temperature gradient in the solar atmosphere, most likely due to an increase of the magnetic filling factor over the cycle (Harder et al., 2009).
Several irradiance reconstruction techniques, such as the SATIRE and the SRPM cited above, the reconstructions of the Astronomical Observatory of Rome (OAR, Ermolli et al., 2011), and those obtained with the Code for Solar Irradiance (COSI, Haberreiter et al., 2008; Shapiro et al., 2010) and with the Solar Modelling in 3D (SOLMOD, Haberreiter, 2011), are based on one-dimensional static atmosphere models. Such models can be constructed to reproduce observed spectra very well, but their semi-empirical nature prevents them from being used to explore the underlying physics (Uitenbroek & Criscuoli, 2011). In this contribution we employ snapshots from 3-D magneto-hydrodynamic (MHD) simulations of the solar photosphere to qualitatively investigate whether an increase of the magnetic filling factor over the solar surface can produce a decrease of the disk-integrated solar radiative emission in the four visible and IR spectral bands monitored by SIM. Since the contribution of features as pores and sunspots is well known to be negative, this study is aimed at investigating the contribution of features like faculae and network.
The paper is organized as follows: in Sect. 2 we describe the MHD snapshots employed and the spectral synthesis performed; in Sect. 3 we present our results and in Sect. 4 we draw our conclusions.
2 Simulations and Spectral Synthesis
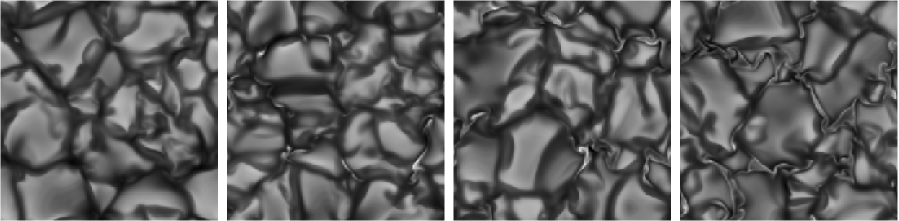
For our analysis we consider series of snapshots of 3-D MHD simulations of the solar photosphere calculated by Fabbian et al. (2010, 2012) using the STAGGER code (Garlsgaard & Nordlund, 1996). They are characterized by four different cases of introduced magnetic flux with average vertical field strength values of approximately 0 G, 50 G, 100 G and 200 G. The 0 G case (hydrodynamic, or HD case hereafter) and the 50 G case are representative of quiet Sun regions, while the 100 and 200 G are meant to represent magnetic regions. The horizontal dimensions of each snapshot are 6 Mm 6 Mm, with a spatial sampling of 23.8 km resulting in a grid size of 252 points in both horizontal directions. These snapshots were used by Fabbian (2010, 2012) for the first-ever quantitative assessment of the impact of magnetic fields in 3D photospheric models of the Sun on the solar chemical composition. The numerical setup adopted for the calculations is described in the above cited papers. Beck et al. (2013) discussed the quality of the simulations and their comparison with observations. Criscuoli (2013) employed this set of simulations to investigate physical and observational differences between quiet and facular regions. Among other results, this study showed that, in agreement with high-spatial-resolution observations, the emergent intensity at disk center in the red continuum of magnetic features characterized by the same size and the same amount of average magnetic flux decreases with the increase of their environmental magnetic flux. That is, small-size magnetic features are brighter in quiet areas with respect to active regions. Here we extend that work to a larger set of wavelengths and lines of sight and investigate the effects of the magnetic flux on the radiative emission as would be observed by moderate spatial resolution data (as those usually employed for irradiance studies). At this aim, we considered each of these snapshots to represent a patch of unresolved magnetic field with the corresponding average flux. At each pixel we calculated with the RH code (Uitenbroek, 2003) the emergent radiation by solving for LTE radiative transfer at 16 continuum wavelengths, distributed equidistantly over 6 spectral positions in each of the SIM pass bands (400 – 972 nm, 972 – 1630 nm, and 1630 – 2423 nm). Figure 1 illustrates examples of the emergent intensity along the vertical line of sight at 630 nm through snapshots characterized by different amounts of average magnetic flux. We solved radiative transfer through the snaphots in different directions spanning 9 inclinations, distributed according to the zeroes of the Gauss–Legendre polynomials in , where is the angle with the vertical, and 2 azimuths per octant, plus the vertical direction, for a total of 73 directions. We then averaged over the different azimuths and all the spatial positions in the snapshot to calculate the snapshot’s average emergent intensity at all 16 wavelengths as a function of heliocentric angle.
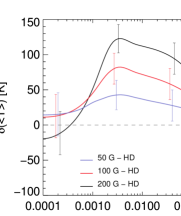
To ensure sufficient statistics and reduce oscillation effects, for each average magnetic flux value we considered 10 snapshots taken 2.5 minutes apart (40 snapshots in total). Figure 2 shows the differences between the average temperature stratifications of the MHD and the HD atmospheres as function of the optical depth computed at 500 nm. These curves agree with those reported in Fabbian et al. (2010, their figure 1), within the statistical variations due to here considering fewer snapshots from the complete series, and to possible slight differences in the computed optical depth due to employing a different radiative transfer code. The solid gray area approximately indicates the range in formation heights of the continuum intensity along a vertical line of sight at the considered wavelengths. The dashed gray area shows approximately the formation heigths at the same wavelengths for an inclined line of sight (namely, for = 0.2, where is the cosine of teh heliocentric angle); as expected, the shallower the line of sight, the more the formation heights shift toward higher layers of the atmosphere (smaller optical depth values). The plot shows that an increase of the average magnetic flux causes an average decrease of the temperature at about optical depth unity and an increase at smaller optical depths, thus making the temperature gradient shallower with the increase of the magnetic flux. As explained in detail in Criscuoli (2013), these variations must be ascribed to the inhibition of convection by the magnetic field, which reduces the amount of energy transported by the plasma from the lower to the higher layers of the atmosphere. These temperature gradient changes are similar to those invoked by Harder et al. (2009) to explain SIM measurements at Visible and IR bands, and are qualitatively similar to the differences between temperatures of quiet and magnetic feature atmosphere models such as employed in SRPM (e.g. Fontenla et al., 2012). We note however, that because of our inclusion of the true three-dimensional structure of the snapshots, the centre-to-limb behavior of our computed intensities is more realistic than that of the one-dimensional models, even though the snapshots possess, on average, similar temperature gradients.
After calculating the spatially and azimuth averaged emergent intensities as a function of for each snapshot we averaged them over the 10 realizations for each average magnetic flux case, and compared the intensities for each of the MHD cases with those of the HD case as reference. Intensity contrast is, therefore, defined as the intensity relative to that of the HD case at the same heliocentric angle: , where the averages are over spatial dimensions in each snapshot, realization, and azimuth. Finally, we computed the flux by integrating intensities over a range of heliocentric angles.
3 Results
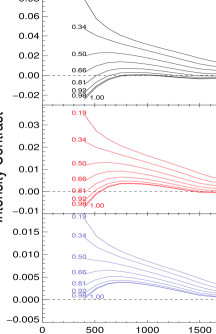
The plot in Fig. 3 shows the average intensity contrast of the MHD snapshots as a function of wavelength for different heliocentric angles. We note that the intensity contrast is negative for the 100 G and 200 G cases near disk center () both for short wavelengths (below approximately 500 nm for the 100 G snapshots and below approximately 700 nm for the 200 G ones) and wavelengths above 1500 nm, but that the contrast is positive for all angles and wavelengths in the 50 G average field case. This is because at short and long wavelengths intensity emanates from relatively deep layers of the solar atmosphere, at which, as illustrated in Fig. 2 (continuous gray area), the 100 and 200 G simulations have average temperature lower than the one of the HD case. For shallower lines of sight ( 0.8) the formation heights shift toward higher layers of the atmosphere (dashed gray area in Fig. 2), where the difference between the average temperatures of MHD and HD simulations becomes positive. These results are in agreement with those obtained from observations (e.g. Yeo et al., 2013; Ermolli et al., 2007; Ortiz et al., 2002; Sánchez Cuberes et al., 2002). Close to disk center most of the curves exhibit a maximum at about 800 nm. This wavelength dependence of the contrast closely follows the behavior of the opacity, which is the prominent source of opacity in the photosphere, and has a maximum near that wavelength. At those wavelengths intensity forms relatively high in the atmosphere, where the MHD snapshots are on average warmer than the HD ones.
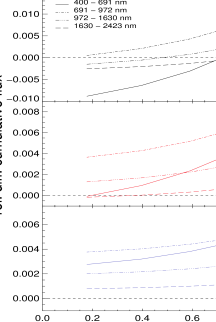

The derived intensity contrasts would suggest that it is in principle possible to have a decrease of the irradiance at continuum wavelengths due to the presence of magnetic features (other than sunspots and pores), in particular when these have an average vertical flux of at least 100 G, appear preferentially near disk center, and are observed at short (below 600-700 nm), or long (above 1500 nm) wavelengths. However, we have to verify that negative contrasts still could appear when activity is more evenly spread out over the disk, as is the case when averaging over several solar rotations, and when integrated over the SIM wavelength bands. We therefore estimated the cumulative radiative flux computed over the surfaces of disks of increasing partial radius and integrated these fluxes in wavelength over the four bands observed by SIM. Figure 4 shows the relative differences between the cumulative flux computed for the MHD snapshots and the HD ones as function of partial solar radius. The curves confirm that the contribution of faculae to the radiative flux in SIM bands is always positive in the 50 G case, while it can turn negative as the magnetic flux increases (in particular, this can be seen for the curve corresponding to the 200 G simulation), if these features are preferentially located close to disk center. Nevertheless, the contribution is positive if these magnetic features are uniformly distributed over the disk (cumulative radius of one). The main reason for this positive contrast is the limb brightening of the intensity contrast that occurs for all wavelengths (see Fig.3), and is the result of the sampling of higher temperatures in the MHD snapshots at shallower viewing angles, and the additional brightening that stems from geometrical effects when shallow viewing directions sample hotter material behind partially evacuated magnetic field concentrations. This latter effect cannot adequately be represented by one-dimensional modeling.
Typically, magnetic activity occurs preferentially in activity belts North and South of the equator, moving from higher latitudes in the early phase of the solar cycle to lower ones in later phases. Limiting magnetic elements to lower latitudes limits the number of magnetic elements at higher heliocentric angles, potentially allowing for a negative contribution to the irradiance. To test this possibility we computed the disk integrated radiative flux of magnetic elements confined to an activity belt between latitudes of 30 degrees. Fig. 5 shows the result of this calculation for the SIM bands. In particular, it shows the radiative flux relative differences between the MHD and HD snapshots integrated over the SIM bands as function of the average vertical magnetic-flux. It clearly shows a positive contrast for all field cases considered in all four bands. Nevertheless, it also shows that in the 400-691 nm and in the 1630-2423 nm bands the radiative fluxes relative differences decrease with the increase of the magnetic flux. This suggests that, if magnetic features are preferentially located over the activity belt, and if the relative number of features with higher magnetic flux increases with the increase of the magnetic activity, then the radiance at those two SIM bands decreases. Moreover if, more ”realistically”, we consider that even the quiet Sun is permeated by magnetic flux (see Martínez Pillet, 2013, for a review on quiet Sun magnetic field) and we take as reference the 50 G snapshots, then the contribution of facular regions at those two SIM pass bands is always negative.
4 Discussion and Conclusions
We employed snapshots from 3-D MHD simulations, characterized by different values of average vertical magnetic flux, to estimate solar irradiance variations at the visible and IR spectral ranges of SIM radiometers, stemming from contributions of patches of unresolved magnetic field. The results from our spectral synthesis confirm the fact the contribution of facular region to irradiance is strongly dependent on their location over the solar disk (see also the discussion in Fontenla et al., 2012). In particular, we find that the increase of the magnetic filling factor over the solar surface can produce a decrease of emitted radiation only for mostly vertical lines of sight and only for wavelengths below 500-700 nm (depending on the magnetic flux), or above 1500 nm (Fig. 3). Integrating the intensity over the disk, even if we limit the contribution of magnetic regions to an activity belt, always renders the contribution of the magnetic elements to the irradiance positive (Fig. 5). Nevertheless, if magnetic features are distributed over the activity belt, their contribution decreases at two of the SIM bands (namely at 400-691 and 1630-2423 nm) with the increase of the average magnetic flux. This suggests that, assuming that the relative number of features with larger magnetic flux increases with the increase of the magnetic activity, then the spectral irradiance at those SIM bands can decrease toward solar maximum. Results shown in Fig. 5 also indicate that, if we take as reference the 50 G snapshots instead of the HD ones, then the contribution of facular regions to irradiance at the 400-691 and 1630-2423 nm SIM wavelength bands is always negative. We note that this is a more ”realistic” assumption than taking the HD snapshots as reference, as previous works have shown that MHD simulations with average vertical magnetic field between 20 - 30 G best represent properties of magnetic field of the quiet Sun (Khomenko et al., 2005; Danilovic et al., 2010). Finally, we note that magnetic features tend to appear toward higher latitudes at the beginning of the cycle, migrate toward the equator as the magnetic activity peaks, and that then part of their flux, fragmented into lower magnetic flux features, tends to migrate toward the poles during the descending phase. Since, as we have shown, the contribution to irradiance of these features strongly depends on their position on the solar disk, we speculate that multiple peaks of the solar spectral irradiance could be observed.
Note that an average flux of 200 G, the maximum we considered, is modest for facular regions, as values up to 800 G are usually employed for reconstructions (e.g. Ball et al., 2012, and references therein). On the other hand, from results shown in this work as well as from results obtained from numerical simulations by other authors (e.g. Vögler, 2005), and from observations (e.g. Yeo et al., 2013; Ortiz et al., 2002) it is clear that the center-to-limb variation of contrast increases with magnetic flux so that it is likely that our conclusions would be even stronger.
Likewise, the inclusion of spectral lines in our calculations would have most likely increased the contrast between MHD and HD intensities, as spectral lines contribute opacity and raise the formation height of the spectral bands, causing them to sample slightly higher layers, where the differences between the average temperatures of the models with different field strength is larger. Nevertheless, we expect this effect to be larger for the lower magnetic flux simulations, where the average temperature gradient is steeper (and spectral lines are deeper), with respect to higher magnetic flux simulations, thus increasing the steepness of the relations in Fig. 5 for the 400-691 ans 1630-2423 nm bands, and decreasing the steepness of the curves of the other two bands. This effect too would thus strengthen our conclusions.
We therefore conclude that the spectral synthesis presented in this study are compatible with a negative contribution of facular regions to the irradiance in the SIM visible and IR bands with an increase in magnetic filling factor if as reference for quiet Sun we assume snapshots of 50 G average magnetic flux.
References
- Ball et al. (2011) Ball, W. T., Unruh, Y. C., Krivova, N. A., Solanki, S., Harder, J. W. 2011, A&A, 530, 71
- Ball et al. (2012) Ball, W. T., Unruh, Y. C., Krivova, N. A., Solanki, S., Wenzler, T., Mortlock, D. J., Jaffe, A. H. 2012, A&A, 541, 27
- Beck et al. (2013) Beck, C., Fabbian, D., Moreno-Insertis, F., Puschmann, K. G., Rezaei, R. 2013, A&A, 557, 109
- Criscuoli (2013) Criscuoli, S. 2013, ApJ, 778, 27
- Danilovic et al. (2010) Danilovic, S., Scüssler, M., solanki, S. 2010, A&A, 513, 1D
- Ermolli et al. (2007) Ermolli, I., Criscuoli, S., Centrone, M., Giorgi, F., Penza, V. 2007, A&A, 465, 305
- Ermolli et al. (2011) Ermolli, I., Criscuoli, S., Giorgi, F. 2012, CoSkA, 41, 73
- Ermolli et al. (2013) Ermolli, I., Matthes, K., Dudok de Wit, T. et al. 2013, ACP, 13.3945E
- Fabbian et al. (2010) Fabbian, D., Khomenko, E., Moreno-Insertis, F., Nordlund, Å. 2010, ApJ, 724, 1536
- Fabbian et al. (2012) Fabbian, D., Moreno-Insertis, F., Khomenko, E., Nordlund, Å. 2012, A&A, 548, 35
- Fontenla et al. (2012) Fontenla, J., Harder, J., Livingston, W., Snow, M., Woods, T. 2012, J. Geophys. Res., accepted
- Fröhlich et al. (1995) Fröhlich, C., Romero, J., Roth, H. et al. 1995, Sol. Phys., 1162, 101
- Garlsgaard & Nordlund (1996) Garlsgaard, K. & Nordlund, Å1996, J. Geophys. Res., 101, 13445
- Harder et al. (2005) Harder, J. W., Fontenla, J. Lawrence, G., Rottman, G., Woods, T. 2005, Sol. Phys., 230, 141
- Harder et al. (2009) Harder, J. W., Fontenla, J. M.; Pilewskie, P., Richard, E. C., Woods, T, N. 2009, GeoRL, 360, 7801
- Khomenko et al. (2005) Khomenko, E.,V., Martínez González, M., Collados, M. et al. 2005, A&A, 436, L27
- Lockwood (2012) Lockwood, M. 2012, SGeo, 33, 503
- Martínez Pillet (2013) Martínez Pillet, V. 2013, SSRev, 178, 141-162
- Ortiz et al. (2002) Ortiz, A., Solanki, S. K., Domingo, V., Fligge, M., Sanahuja, B. 2002, A&A, 388, 1036
- Preminger et al. (2011) Preminger, D. G., Chapman, G. A., Cookson, A. M 2011, ApJ, 739L, 45
- Rottman (2005) Rottman, G. 2005 Sol. Phys., 230, 7
- Haberreiter et al. (2008) Haberreiter, M., Schmutz, W., & Hubeny, I. 2008, A&A, 492, 833
- Haberreiter (2011) Haberreiter, M. 2011, Sol. Phys., 274, 473
- Sánchez Cuberes et al. (2002) Sánchez Cuberes, M., Vázquez, M., Bonet, J.A., Sobotka, M. 2002 A&A, 570, 886
- Shapiro et al. (2010) Shapiro, A. I., Schmutz, W., Schoell, M., Haberreiter, M., & Rozanov, E. 2010, A&A, 517, A48
- Uitenbroek (2003) Uitenbroek, H. 2003, ApJ, 592, 1225
- Uitenbroek & Criscuoli (2011) Uitenbroek, H. & Criscuoli, S. 2011, ApJ, 736, 69
- Vögler (2005) Vögler, A. 2005, Mem. S.A.It, 76, 842
- Wehrli et al. (2013) Wehrli, C., Schmutz, W., Shapiro, A. I. 2013, A&A, 556L, 3
- Yeo et al. (2013) Yeo, K.L., Solanki, S.K., Krivova, N.A.2013, A&A, 550, A95