Effect of nonmagnetic dilution in honeycomb lattice iridates Na2IrO3 and Li2IrO3
Abstract
We have synthesized single crystals of Na2(Ir1-xTix)O3 and polycrystals of Li2(Ir1-xTix)O3 and studied the effect of magnetic depletion on the magnetic properties by measurements of the magnetic susceptibility, specific heat and magnetocaloric effect at temperatures down to 0.1 K. In both systems, the non-magnetic substitution rapidly changes the magnetically ordered ground state into a spin glass, indicating strong frustration. While for the Li system the Weiss temperature remains unchanged up to , a strong decrease is found for the Na system. This suggests that only for the former system magnetic exchange beyond nearest neighbors is dominating. This is also corroborated by the observation of a smeared quantum phase transition in Li2(Ir1-xTix)O3 near , i.e. much beyond the site percolation threshold of the honeycomb lattice.
pacs:
75.40.Cx, 75.10.Jm, 75.40.Gb, 75.50.LkIridates have attracted considerable interest in last few years due to their potential to host novel electronic and magnetic phases mediated by the combination of strong spin-orbit (SO) coupling and electronic correlations Pesin ; Moon ; Kim08 ; Kim09 ; Okamoto . Layered honeycomb lattice iridates IrO3 ( Na,Li) are intensively investigated because they have been proposed as candidate materials for the realization of the highly frustrated Kitaev interaction Jackeli as well as correlated topological insulator phases Kim ; Shitade .
Both Na2IrO3 and Li2IrO3 are electrically insulating with fluctuating moments above an antiferromagnetic (AF) ordering around 15 K Singh10 ; Singh12 . Their electronic structure is discussed either within SO Mott insulator RIXS or quasi-molecular orbital (QMO) scenarios Mazin12 ; Foyevtsova2013 , where the upper half-filled or QMO doublet, respectively, causes magnetism. At present the correct effective Hamiltonians for the description of magnetic exchange in the two systems are not settled. Na2IrO3 displays an AF Weiss temperature of K Singh10 and zigzag ground state Choi12 . Within the next-neighbor Heisenberg-Kitaev (HK) model this would require ferromagnetic (FM) Heisenberg and AF Kitaev couplings Jackeli13 , which, however, seems incompatible with ab-initio DFT calculations Foyevtsova2013 . Significant further neighbor exchange in a -- Heisenberg model has been concluded from the analysis of the measured magnon dispersion in Na2IrO3 Choi12 . On the other hand, it has been pointed out recently, that trigonal distortions present in the system lead to an anisotropic contribution to the next neighbor exchange, which together with a FM Kitaev interaction can reproduce the experimental results Imada .
Isostructural honeycomb Li2IrO3 displays a significantly smaller AF Weiss temperature ( K) compared to Na2IrO3 Singh12 . Recent neutron scattering has detected a magnetic Bragg peak within the first Brillouin zone, indicating incommensurate spiral ordering Choi14 . Due to the much reduced atomic size of Li, its substitution for Na in (Na1-xLix)2IrO3 revealed that up to preferentially only the Na-sites in the honeycomb plane are occupied by Li and further doping results in chemical phase segregation Manni . Magnetic properties of Na2IrO3 and Li2IrO3 thus differ significantly Manni ; Cao . Due to the smaller Ir-Ir distances in the honeycomb planes in Li2IrO3, one may expect enhanced further neighbor exchange in this system.
Introduction of random vacancies to frustrated magnets induces spin-glass behavior. For striped phases of the HK model it has been shown that the vacancies locally select specific stripe orientations Trousselet . It has recently been proposed, that systematic depletion of the Ir spins by a nonmagnetic ion could provide important new insights on magnetic exchange in these materials. Andrade and Vojta have shown by classical Monte-Carlo simulations that the spin-glass freezing temperatures for depleted next neighbor HK and -- Heisenberg magnets behave significantly different when the doping concentrations exceed the site percolation threshold Vojta . While in the former case the freezing temperature rapidly drops to zero, spin-glass ordering has a tail and can largely extend into the regime for substantial further neighbor magnetic exchange.
We have studied Na2(Ir1-xTix)O3 and Li2(Ir1-xTix)O3 where magnetic Ir4+ is randomly substituted by nonmagnetic Ti4+. In contrast to the Na-system, for the Li-system the AF Weiss temperature remains almost unchanged and spin-glass freezing is found up to , highlighting the importance of further neighbor exchange in the latter system.
We have chosen nonmagnetic Ti as substituent because Ti4+ and Ir4+ have a very similar ionic radius. In compounds where Ir and Ti occupy different sites this causes a severe problem due to site exchange Dey12 , while in our case it assures a good statistical mixing of Ir and Ti in the diluted systems. Na2(Ir1-xTix)O3 single crystals were grown using a similar method as for Na2IrO3, by pre-reacting Na2CO3, Ir metal powder and TiO2 powder at 750∘C to 900∘C. The subsequent crystal growth was done with 10% extra IrO2 in between 1030-1050∘C. Unfortunately, this method only worked for compositions . At larger only a solid melt of Na2TiO3 was obtained and no Na2(Ir1-xTix)O3 crystals formed. Na2TiO3 has a very low melting point of 180∘C which causes this problem for . Since chemistry and crystal structure of Na2TiO3 differs from Na2IrO3, attempts to synthesize single-phase Na2(Ir1-xTix)O3 polycrystals for have failed.
For Li2(Ir1-xTix)O3 we have prepared well ordered single phase polycrystals up to x=0.55 by solid state reaction. At higher doping Li2(Ir1-xTix)O3 polycrystals become disordered probably due to a site exchange between Li and Ti. For polycrystal synthesis Li2CO3, Ir metal powder and TiO2 were mixed and reacted in the open furnace at 700-1000∘C in 100∘C steps after repetitive grinding and pelletizing after each step. Phase purity and structural ordering were verified from powder x-ray diffraction (XRD). The detailed structural analysis of Li2(Ir1-xTix)O3 by powder XRD (see supplemental information (SI) SI ) shows that the changes in the lattice parameters are within 1% as expected because the ionic radius of Ti4+ and Ir4+ are similar. For the elemental quantification of the Ir and Ti content several spots on various pieces of each batch have been studied by the energy dispersive x-ray (EDX) method. Throughout this rapid communication always denotes the actual Ti concentration. Magnetization, ac susceptibility and specific heat measurements were conducted in the Quantum Design MPMS and PPMS. Thermodynamic measurements below 0.4 K were performed in a dilution refrigerator Tokiwa .
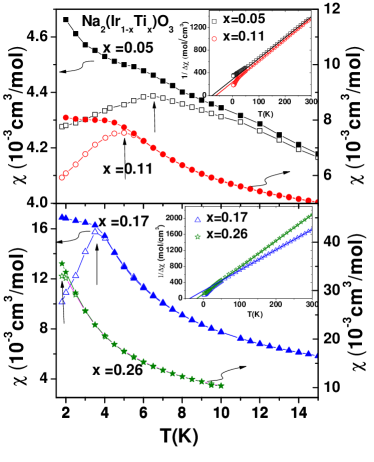
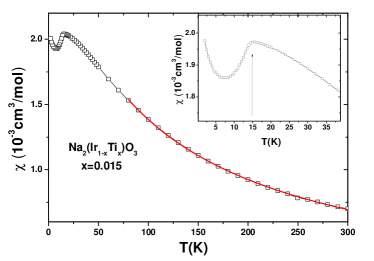
Magnetization measurements on Na2(Ir1-xTix)O3 single crystals show that for all investigated the magnetic susceptibility follows Curie-Weiss (CW) behavior , see insets of Fig. 1. This implies that with increasing degree of dilution by Ti substitution the local moment behavior persists and the decrease of the Curie constant is compatible with the dilution of Ir moments by nonmagnetic Ti (see SI). Small temperature independent van Vleck contributions () are of order 10-5 cm3/mol. The AF Weiss temperature changes from K at to K for indicating a continuous decrease of the CW scale with magnetic depletion for the Na-system.
Field-cooled (FC) and zero-field cooled (ZFC) measurements at very low field of 5 mT shown in Fig. 1 display cusps for ZFC and a clear separation between FC and ZFC traces at low , which are characteristic signatures for spin-glass (SG) behavior. The freezing temperature has been determined from the maxima in ZFC traces, as indicated by vertical arrows in Fig. 1. For the lowest doping level () in Na2(Ir1-xTix)O3 long range magnetic ordering is still present below 15 K SI . For higher doping we find a reduction of K for to 2 K for . The SG behavior is also confirmed by frequency dependent ac susceptibility measurements for which show a sharp cusp at and a pronounced frequency dependence in the position of that cusp SI . We have also measured the heat capacity () for this concentration and found a broad hump in above , which confirms the absence of long-range ordering and indicates SG freezing SI .
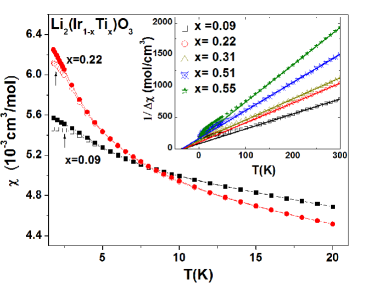
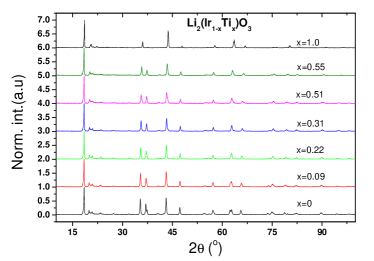
Next we discuss the effect of non-magnetic depletion for the Li-system. As shown in Fig. 2, Li2(Ir1-xTix)O3 polycrystals display CW behavior between 100 and 300 K (cf. inset). Here ranges between cm3/mol and cm3/mol. Remarkably, the observed Weiss temperatures are very similar for all different investigated samples. For we observe K, which is close to K for . Hence the CW scale remains almost unchanged for more than 50% dilution of magnetic moments in the Li-system in stark contrast to its drastic reduction found for the Na-system. At low temperatures, a hysteresis between FC and ZFC susceptibility data is found, similar as for the Na-system. Fig. 2 shows a separation between the FC and ZFC susceptibility which confirms K and 2 K for and , respectively (vertical arrows in Fig. 2 indicate ). The ac susceptibility also shows a strong frequency dependence for these two compositions. Similar SG freezing behavior is also present at higher doping below the temperature limit of our SQUID magnetometer (1.8 K) (see below).
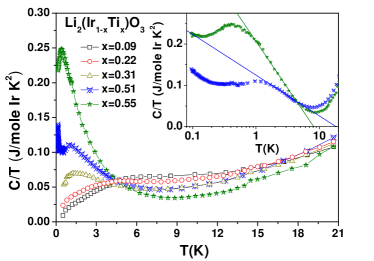
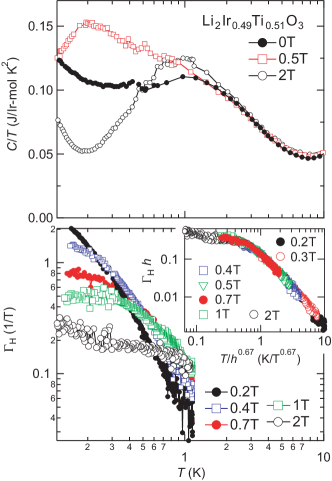
We have measured for all Li2(Ir1-xTix)O3 samples the heat capacity down to 0.4 K and extended the data down to 50 mK for the two highest concentrations, cf. Fig. 3. For =0.09 and 0.22 we observe broad maxima in heat capacity divided by temperature around which is characteristic for SG transitions (see Fig. 3). For , 0.51 and 0.55 similar broad maxima are found at low temperatures. With increasing the position of these maxima shift from 1.25 K to 0.41 K for to 0.55. The respective values are determined by the position of the maximum divided by 1.4. From Fig. 3 it is unambiguously clear that even beyond 50% substitution of magnetic Ir sites by non-magnetic Ti in the Li-honeycomb system SG freezing persists and continuously shifts to lower temperatures with increasing . Strikingly for and does not approach 0 at lowest temperatures as expected for insulators but rather saturates (above a low- nuclear upturn). This implies that a significant amount of magnetic entropy is shifted to low temperatures.
As indicated by the straight lines in the inset of Fig. 3, a logarithmic increase of is found for and upon cooling from about 8 K down to the SG freezing. Such behavior is often found near magnetic instabilities and considered as signature of quantum criticality. We have also observed a strong non-monotonic field dependence of for SI and 0.55 (Fig. 4).
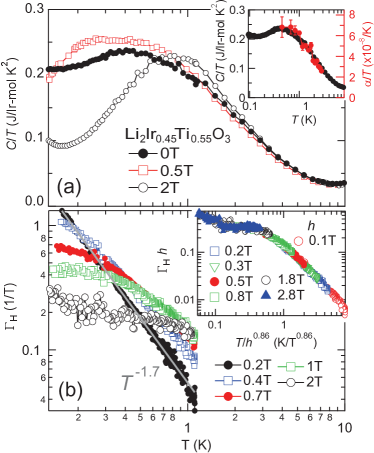
The adiabatic magnetocaloric effect or magnetic Grüneisen parameter is a sensitive probe of quantum criticality and is expected to diverge as a function of temperature with a power-law function at the critical field for a field-induced quantum critical point (QCP) ZhuQCP . Fig. 4 displays the temperature dependence of at different magnetic fields for Li2(Ir1-xTix)O3, x=0.55. At low field of 0.2 T, a divergence with exponent of is found over at least one decade in , indicating quantum critical behavior with a low critical field. At 0.4 T and larger fields, saturates upon cooling and the saturation temperature increases with increasing field indicating that fields drive the system away from quantum criticality. The data at various different fields collapse on a single curve when plotted as vs. (see inset of lower panel of Fig. 4). Here denotes the difference in field from the critical field, i.e., T and the scaling exponent amounts to . The critical field of 0.2 T is consistent with the power-law divergence of only observed at 0.2 T. Furthermore, the non-monotonic field dependence of the low-temperature specific heat is probably due to the small finite . A similar divergence and scaling of the magnetic Grüneisen ratio is also found for the sample SI . Interestingly, for certain models the possibility of simultaneous percolation and quantum criticality has been investigated theoretically Sandvik12 ; Yu05 ; Vojta05 .
To further characterize the low-temperature magnetic properties of depleted Li2(Ir1-xTix)O3, we have studied the temperature dependence of the linear thermal expansion coefficient (: sample length) for , see upper inset of Fig. 4. The large values of order K-1 around 1 K must originate from the magnetic properties (the phonon contribution is several orders of magnitude smaller). Interestingly, perfectly scales with indicating a temperature independent thermal Grüneisen ratio . This proves the absence of a QCP as function of pressure ZhuQCP and resembles the case of CePd1-xRhx where also does not diverge due to the smeared quantum phase transition (QPT) PhilippQGP . The observed entropy accumulation at low- which is quenched by a magnetic field but remains unaffected by pressure (or changes in composition) would then arise from weakly coupled magnetic clusters. Our low-temperature experiments on Li2(Ir1-xTix)O3 thus prove that SG formation survives upon substantial magnetic depletion up to leading to a smeared QPT.
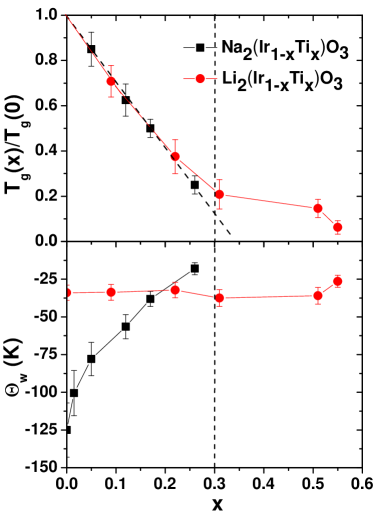
The variation of the SG freezing temperatures for the depleted Na- and Li-systems is summarized in the upper panel of Fig. 5. In both systems, already small magnetic depletion induces a SG transition, highlighting the importance of magnetic frustration, and the freezing temperature displays a linear suppression at low Ti concentration . However, the evolution of the Weiss temperature shown in the lower panel indicates a substantially different response to magnetic depletion of the two systems. While for the Na-system a drastic reduction of indicates a suppression of the average magnetic couplings by dilution, remains unchanged in case of the Li-system. In addition, for the Li-system the signatures of SG formation extend to large , where signatures of a smeared QPT are observed. Although we could not study Na2(Ir1-xTix)O3 at large , the evolution of the magnetic coupling strength (from ) suggests that the QPT for this system is located at significantly lower . Recently classical Monte-Carlo simulations on depleted next neighbor HK and -- Heisenberg models found that in the former case SG freezing disappears beyond the site percolation threshold while in the latter case with substantial further neighbor couplings it persists much beyond Vojta . Comparison with our data suggests that Na2IrO3 is governed dominantly by the nearest neighbor HK model whereas for the Li-system interactions beyond nearest neighbor are significantly important. Interestingly, is the site percolation threshold for a triangular lattice and for exchange only, the honeycomb system corresponds to two decoupled triangular lattices. Thus, the observed smeared QPT must be associated with further neighbor interactions. We also note, that recent theoretical work related to Li2IrO3 found that the low- spiral ordering in combination with the AF Weiss temperature K requires a model with second neighbor Kitaev and Heisenberg interactions Rachel14 .
To summarize, we have found differing behaviors in depleted honeycomb Na2IrO3 and Li2IrO3 which suggests the importance of substantial further neighbor magnetic interactions for Li2IrO3. In Li2(Ir1-xTix)O3 SG freezing persists to a regime at for which indications of a smeared quantum phase transition is observed. Magnetism in this interesting regime could be further investigated by NMR, SR or neutron scattering.
We thank Eric C. Andrade, Matthias Vojta and Yogesh Singh for fruitful discussion and collaboration and acknowledge financial support by the Helmholtz Virtual Institute 521 (”New states of matter and their excitations”).
References
- (1) D. Pesin and L. Balents, Nature Phys. 6, 376 (2010)
- (2) S. J. Moon, H. Jin, K. W. Kim, W. S. Choi, Y. S. Lee, J. Yu, G. Cao, A. Sumi, H. Funakubo, C. Bernhard, T. W. Noh, Phys. Rev. Lett. 101, 226402 (2008).
- (3) B. J. Kim, Hosub Jin, S. J. Moon, J.-Y. Kim, B.-G. Park, C. S. Leem, Jaejun Yu, T. W. Noh, C. Kim, S.-J. Oh, J.-H. Park, V. Durairaj, G. Cao, E. Rotenberg, Phys. Rev. Lett. 101, 076402 (2008).
- (4) B.J. Kim, H. Ohsumi, T. Komesu, S. Sakai, T. Morita, H. Takagi, T. Arima, Science 323, 1329 (2009).
- (5) Y. Okamoto, M. Nohara, H. Aruga-Katori, H. Takagi, Phys. Rev. Lett. 99, 137207 (2007).
- (6) J. Chaloupka, G. Jackeli, and G. Khaliullin Phys. Rev. Lett. 105, 027204 (2010).
- (7) Choong H. Kim, Heung Sik Kim, Hogyun Jeong, Hosub Jin, and Jaejun Yu Phys. Rev. Lett. 108, 106401 (2012).
- (8) Atsuo Shitade, Hosho Katsura, Jan Kunes, Xiao-Liang Qi, Shou-Cheng Zhang, and Naoto Nagaosa Phys. Rev. Lett. 102, 256403 (2009).
- (9) Y. Singh and P. Gegenwart, Phys. Rev. B 82, 064412 (2010).
- (10) Y. Singh, S. Manni, J. Reuther, T. Berlijn, R. Thomale, W. Ku, S. Trebst, P. Gegenwart, Phys. Rev. Lett. 108, 127203 (2012).
- (11) H. Gretarsson, J. P. Clancy, X. Liu, J.P. Hill, Emil Bozin, Yogesh Singh, S. Manni, P. Gegenwart, Jungho Kim, A. H. Said, D. Casa, T. Gog, M. H, Upton, Heung-Sik Kim, J. Yu, Vamshi M. Katukuri, L. Hozoi, Jeroen van den Brink, Young-June Kim, Phys. Rev. Lett. 110, 076402 (2013).
- (12) I. I. Mazin, H. O. Jeschke, K. Foyevtsova, R. Valentí, D. I. Khomskii, Phys. Rev. Lett. 109, 197201 (2012).
- (13) K. Foyevtsova, H. O. Jeschke, I. I. Mazin, D. I. Khomskii, and R. Valentí, Phys. Rev. B 88, 035107 (2013).
- (14) S. K. Choi, R. Coldea, A. N. Kolmogorov, T. Lancaster, I. I. Mazin, S. J. Blundell, P. G. Radaelli, Y. Singh, P. Gegenwart, K. R. Choi, S.-W. Cheong, P. J. Baker, C. Stock, and J. Taylor Phys. Rev. Lett. 108, 127204 (2012).
- (15) J. Chaloupka, G. Jackeli, and G. Khaliullin Phys. Rev. Lett. 110, 097204 (2013).
- (16) Youhei Yamaji, Yusuke Nomura, Moyuru Kurita, Ryotaro Arita and Masatoshi Imada, arXiv:1402.1030.
- (17) Li2IrO3neutron scattering data presented in APS march meeting 2014, in Denver, USA by S.K. Choi.
- (18) S. Manni, Sungkyun Choi, I. I. Mazin, R. Coldea, Michaela Altmeyer, Harald O. Jeschke, Roser Valenti and P. Gegenwart, arXiv:1312.0815.
- (19) G. Cao, T. F. Qi, L. Li, J. Terzic, V.S. Cao, S. J. Yuan, M. Tovar, G. Murthy and R. K. Kaul, Phys. Rev. B 88, 220414(R) (2013).
- (20) F. Trousselet, G. Khaliullin, P. Horsch, Phys. Rev. B 84, 054409 (2011).
- (21) Eric C. Andrade and Matthias Vojta, arXiv:1309.2951.
- (22) Tusharkanti Dey, A. V. Mahajan,1, P. Khuntia, M. Baenitz, B. Koteswararao, and F. C. Chou, Phys. Rev. B 86, 140405(R) (2012).
- (23) Y. Tokiwa and P. Gegenwart, Rev. Sci. Instr. 82, 013905 (2011).
- (24) See supplemental information on the structural parameter determination for Li2(Ir1-xTix)O3, magnetic properties of Na2(Ir1-xTix)O3 (), further and data on Na2(Ir1-xTix)O3 and data for Li2(Ir1-xTix)O3.
- (25) Lijun Zhu, Markus Garst, Achim Rosch, and Qimiao Si, Phys. Rev. Lett. 91, 066404 (2003).
- (26) Anders W. Sandvik, Phys. Rev. Lett. 89, 177201 (2002).
- (27) Rong Yu, Tommaso Roscilde, and Stephan Haas, Phys. Rev. Lett. 94, 197204 (2005).
- (28) Thomas Vojta and Jörg Schmalian, Phys. Rev. Lett. 95, 237206 (2005).
- (29) T. Westerkamp, M. Deppe, R. Ku¨chler, M. Brando, C. Geibel, P. Gegenwart, A. P. Pikul, and F. Steglich, Phys. Rev. Lett. 102, 206404 (2009).
- (30) J. Reuther, R. Thomale, S. Rachel, arXiv:1404.5818.
I SUPPLEMENTAL INFORMATION
SI. 1. Structural Characterization of Li2(Ir1-xTix)O3: For Li2(Ir1-xTix)O3 we did powder XRD measurements for each composition and fitted the data within the C2/m crystal structure by the Rietveld method. For x 0.55 structurally well ordered samples have been obtained as evidences by sharp XRD peaks between values in the range 19 to 33∘, see Fig. S6. All XRD peaks for x0.55 are matching with Li2IrO3() XRD peaks. However, for x=1, i.e. Li2TiO3, the XRD peaks could not fitted within the C2/m crystal structure, but rather in the C2/c crystal structure.
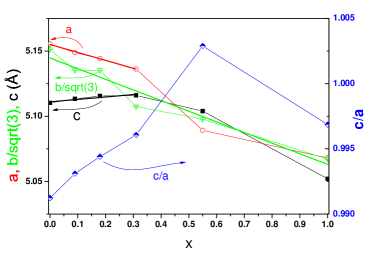
Lattice parameters of Li2(Ir1-xTix)O3 are plotted in Fig. S7. They are calculated by structural refinement of the XRD spectra using the Rietveld method. In the structural refinement it was assumed that Ti occupies only the Ir site. The refinement converged and we obtained good fit parameters ( and ) only when we introduced a small site exchange () between the Ir site and the Li site in the honeycomb center. Hence the occupancy at the iridium site is Ir + Ti + Li and at the honeycomb center site it is Li + Ir to balance the stoichiometry. Lattice parameters of Li2IrO3 and Li2TiO3 vary only from 0.5 to 1% (Li2TiO3 lattice parameters are transformed into C2/m from C2/c for comparison). The lattice constant changes almost linearly with from 0 to 1 and and vary non-linearly. It is confirmed that by Ti substitution there is no change in crystal structure only a small change in lattice parameters.
SI. 2. Variation in Curie constant in A2(Ir1-xTix)O3:
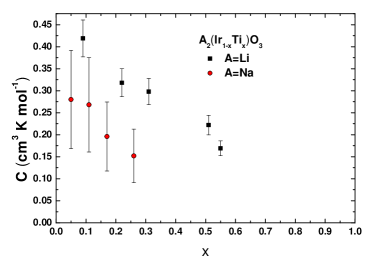
In the Fig. S8 variation of Curie constant () with is plotted for Na2(Ir1-xTix)O3 and Li2(Ir1-xTix)O3 which are obtained from the CW fitting of respective versus data shown in the insets of the Fig. 1 and 2 in the main text. Sharp decrease in with increasing confirms dilution of Ir-magnetism for both the Na- and Li-system . Large error bars are used in case of the Na-system to take into account the possible uncertainty in the value, due to -factor anisotropy Singh10 (magnetization measurement in the Na-system is done on the lump of crystals).
SI. 3. Long Range ordering in Na2(Ir1-xTix)O3 ,x=0.015: In Fig. S9 we display versus for the lowest Ti-substituted Na2(Ir1-xTix)O3 single crystal with . We observe an anomaly with similar shape as for undoped Na2IrO3 Singh10 at 15 K. We do not observe any hysteresis in field cooled and zero-field cooled data, so the drop in susceptibility signifies long-range AF ordering below 15 K. The red straight line in the figure represents the CW behavior with K.
SI. 4. Spin-glass freezing of Na2(Ir1-xTix)O3: SG feature of Na2(Ir1-xTix)O3was further confirmed from frequency dependent ac susceptibility measurement. Fig.S10 shows frequency dependent ac susceptibility () versus T for which shows a frequency dependent sharp cusp at . At 1 Hz the cusp is very sharp and having peak at , with the increasing frequency this cusp shifts towards higher temperature and also slightly broadens with increasing frequency. To measure this frequency dependence at different frequency () is plotted in logarithmic scale in the inset of Fig. S10. Frequency dependence is measured by which measures change of per decade of frequency divided by . For canonical spin-glasses this value is around 0.02. But as Li2(Ir1-xTix)O3is an insulating system having concentrated local moments, the frequency dependence of is one order of magnitude larger, i.g. around 0.11.

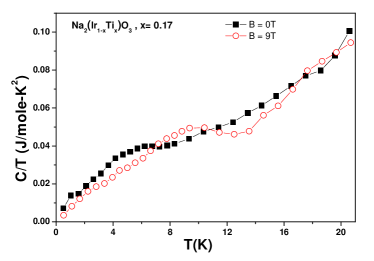
To confirm that for there is no long range magnetic order the heat capacity has been measured. Crystals were very tiny and hence it was pretty challenging to obtain good data. In fig. S11 the heat capacity divided by temperature () is plotted for Na2(Ir1-xTix)O3 , at and 9 T. It shows a broad hump around 6 K which is 1.4 times its determined from ac-susceptibility. Upon applying 9 T magnetic field it broadens and shifts to higher temperatures. Such behavior is characteristic for spin-glass freezing and it confirms the absence of long-range order.
SI. 5. Adiabatic magnetocaloric effect measurements for Li2(Ir1-xTix)O3, :
For Li2(Ir1-xTix)O3, the specific heat divided by temperature shows a similar non-monotonic (as for ) but stronger field dependence at low temperature. We observe also same divergence in . Fig. S12 shows temperature dependence of at different magnetic fields. at 0.2 T diverges as a function of temperature, indicating a presence of QCP very near to this magnetic field. At higher fields, saturates at low temperatures, suggesting that the system is driven away from QCP at fields above 0.2 T (lower plot in Fig. S12). Similar as for , the - data collapse in a common curve, when is plotted against (lower inset Fig. S12 with and =0.24 T. Hence field-tuned quantum criticality at T is confirmed in the sample.