Dynamically Varying Networks
Dynamics of Networks with Stochastically Varying Links
Spatiotemporal Regularity in Networks with Stochastically Varying Links
Abstract
In this work we investigate time varying networks with complex dynamics at the nodes. We consider two scenarios of network change in an interval of time: first, we have the case where each link can change with probability , i.e. the network changes occur locally and independently at each node. Secondly we consider the case where the entire connectivity matrix changes with probability , i.e. the change is global. We show that network changes, occuring both locally and globally, yield an enhanced range of synchronization. When the connections are changed slowly (i.e. is low) the nodes display nearly synchronized intervals interrupted by intermittent unsynchronized chaotic bursts. However when the connections are switched quickly (i.e. is large), the intermittent behavior quickly settles down to a steady synchronized state. Furthermore we find that the mean time taken to reach synchronization from generic random initial states is significantly reduced when the underlying links change more rapidly. We also analyse the probabilistic dynamics of the system with changing connectivity and the stable synchronized range thus obtained is in broad agreement with those observed numerically.
Keywords: Complex Networks, Temporal Networks, Synchronization, Coupled Map Lattice
Complex networks have gained much attention in the scientific community over the last decade. Their importance arises from the wide range of interesting phenomena they yield, as well as their success in modelling systems prevalent in nature. Many mathematical models have been proposed which capture the essential features of real networks and generate artificial complex networks amenable to theorectical analysis, like the small world model Watts1998 and the scale-free networks model Barabsi15101999 . Despite their great success, these mathematical models usually do not take into account the dynamical nature of connections in complex systems. Since connections in commonly found real networks often change over time dynamic1 ; dynamic2 ; dynamic3 ; zanette ; belykh ; amritkar ; sirs_vivek ; explosive , in this work we will propose a model network with time-varying links and focus on the important question of the spatiotemporal implications such switching connections.
First we describe our model network. We begin with a ring of nonlinear maps whose dynamics is given by the following evolution equations cml :
| (1) |
Here is the state variable at site () at discrete time , and when , we have nearest neighbour connections. In the language of networks, index represents a node of degree in the network. The function gives the local dynamics. To begin with, this is chosen to be the prototypical chaotic logistic map: , where the nonlinearity parameter is chosen to be . The strength of coupling is denoted by .
We now go on to incorporate spatial randomness in the connections using the algorithm proposed by Strogatz-Watt Watts1998 , namely we rewire a fraction of the regular nearest neighbour links on the ring to random nodes. So and are and with probability , and some random site with probability . So parameter controls the topology of the network and it tunes the network from a regular ring at to a completely random network at .
Further, in this work we introduce an additional parameter , which reflects the dynamic nature of the connections among the nodes. This parameter gives the probability of change of the links in the network in a given time interval, i.e. it is a measure of the frequency of link switches. Specifically if is zero, the connectivity matrix is static and all links are invariant in time. If then the connections always change in a given time interval. We consider the scenario where all temporal changes of the network keeps the spatial nature of the network invariant, namely the fraction of random links remains the same when the links switch.
We propose two methods to change connections in a complex network:
(i) Each site changes its connections in a time interval with probability , namely, the changes occur independently and stochastically at the local level.
(ii) All nodes change their connections simultaneously, i.e. the network as a whole changes, in a time interval with probability .
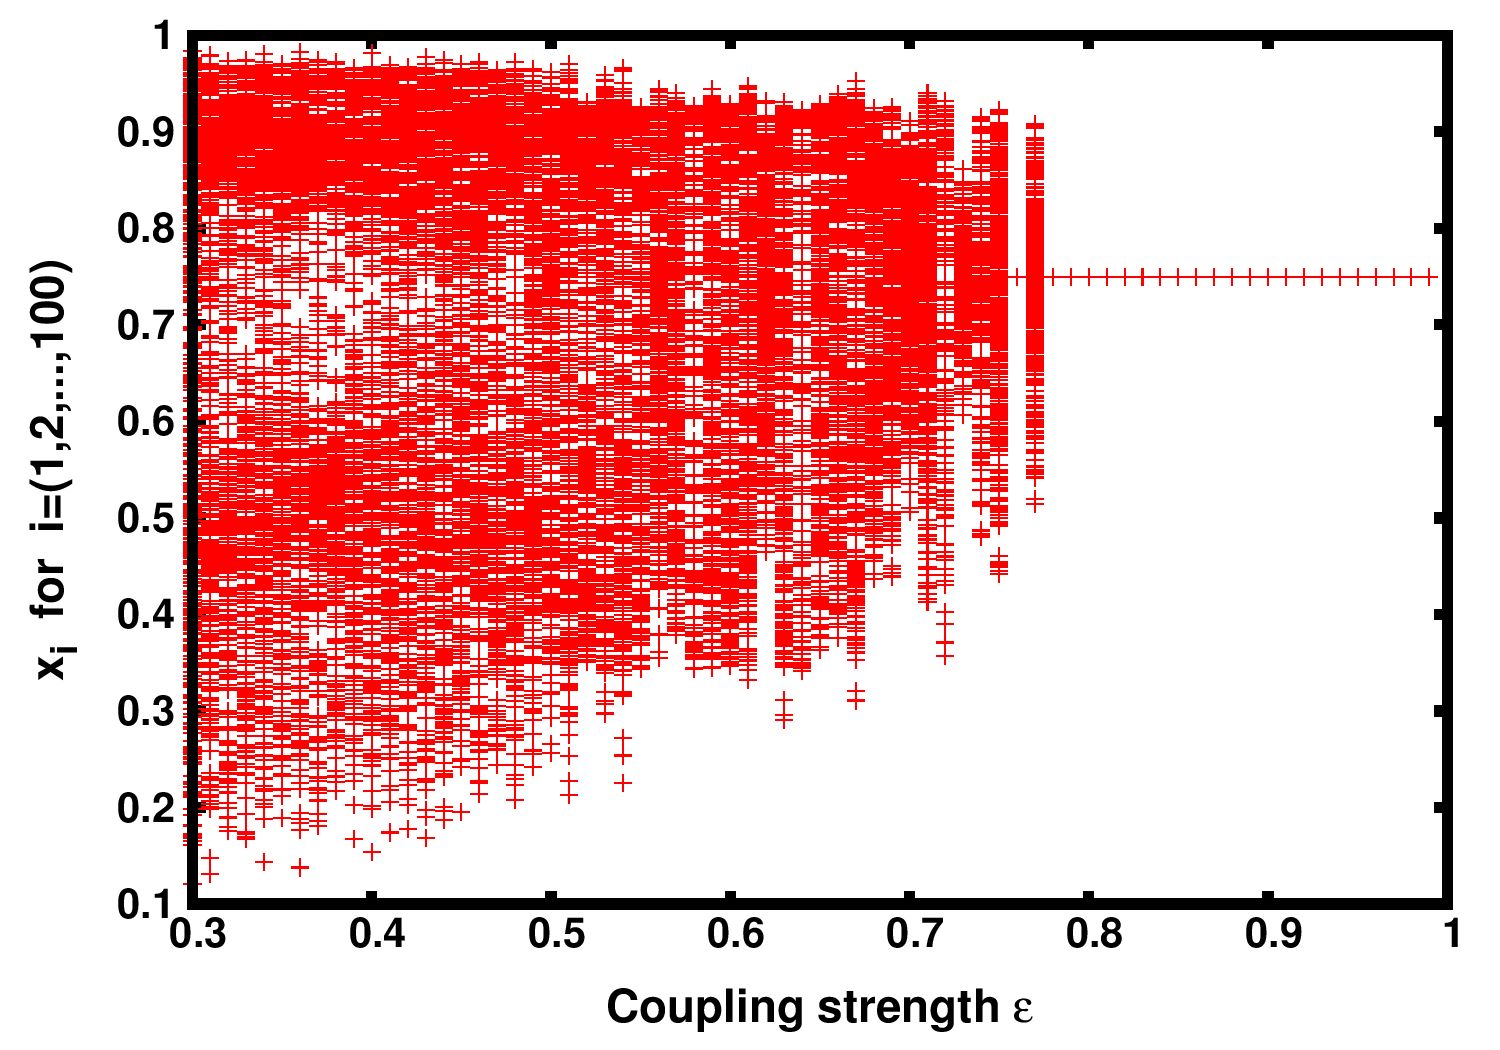
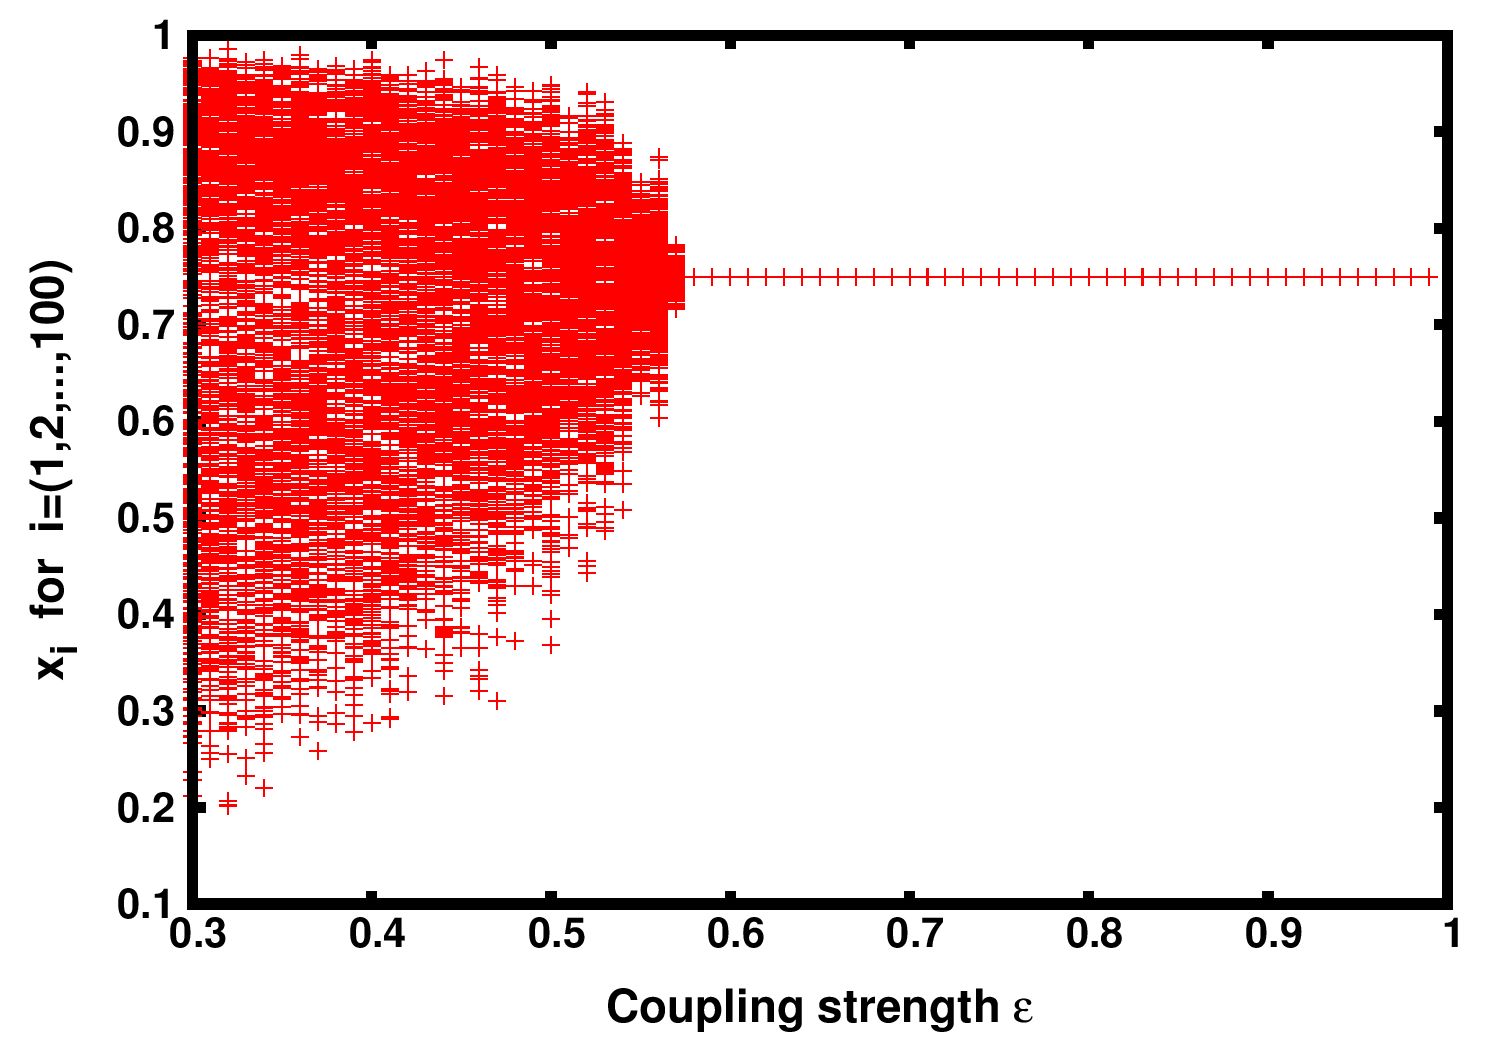
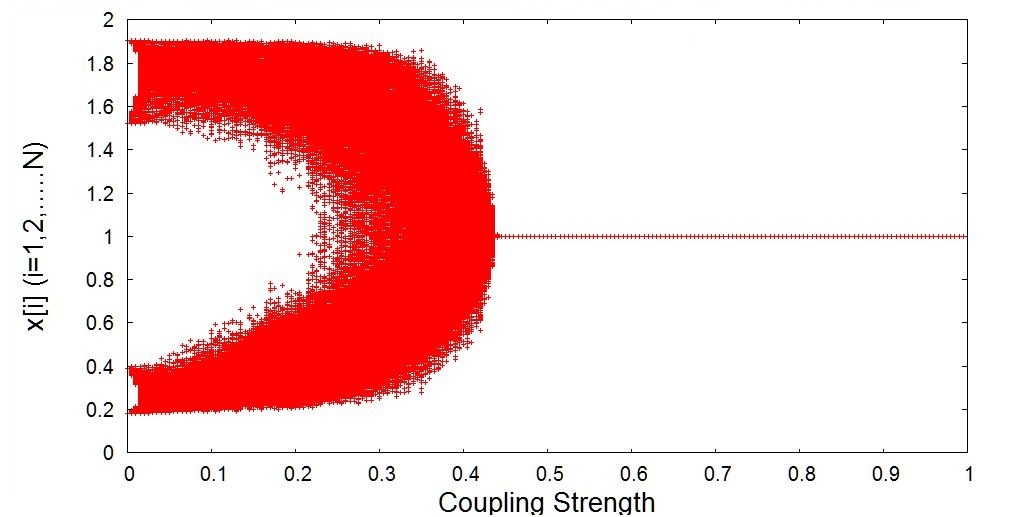
In the sections below we investigate the change in temporal behaviour of the dynamics at the nodes of this network, as the time-scale of the variation of links changes. Through extensive numerical simulations of this dynamical network we first obtain bifurcation diagrams with respect to coupling strength . From these bifurcation diagrams we find the critical coupling strength such that one obtains spatio-temporal syncronization, namely a spatio-temporal fixed point, for .
It is clearly evident from Fig. 1 the critical coupling strength decreases as link switching probability increases. Namely, as the probability of changing links increases, the range for the spatio-temporal fixed point increases. So a more dynamic web of links is more favourable for inducing spatiotemporal regularity in coupled chaotic systems. Surprisingly we found that both methods show similar qualitative effects on the dynamics of the nodes, despite the fact that the local method involves incremental changes in connectivity and the global case implies sudden and large changes in connectivity.
We now describe the degree of syncronization barahona ; hong ; intermediate in the system quantitatively through the synchronization error function defined as
| (2) |
averaged over time n and calculated after transient time, with being the mean value of at a given time step .
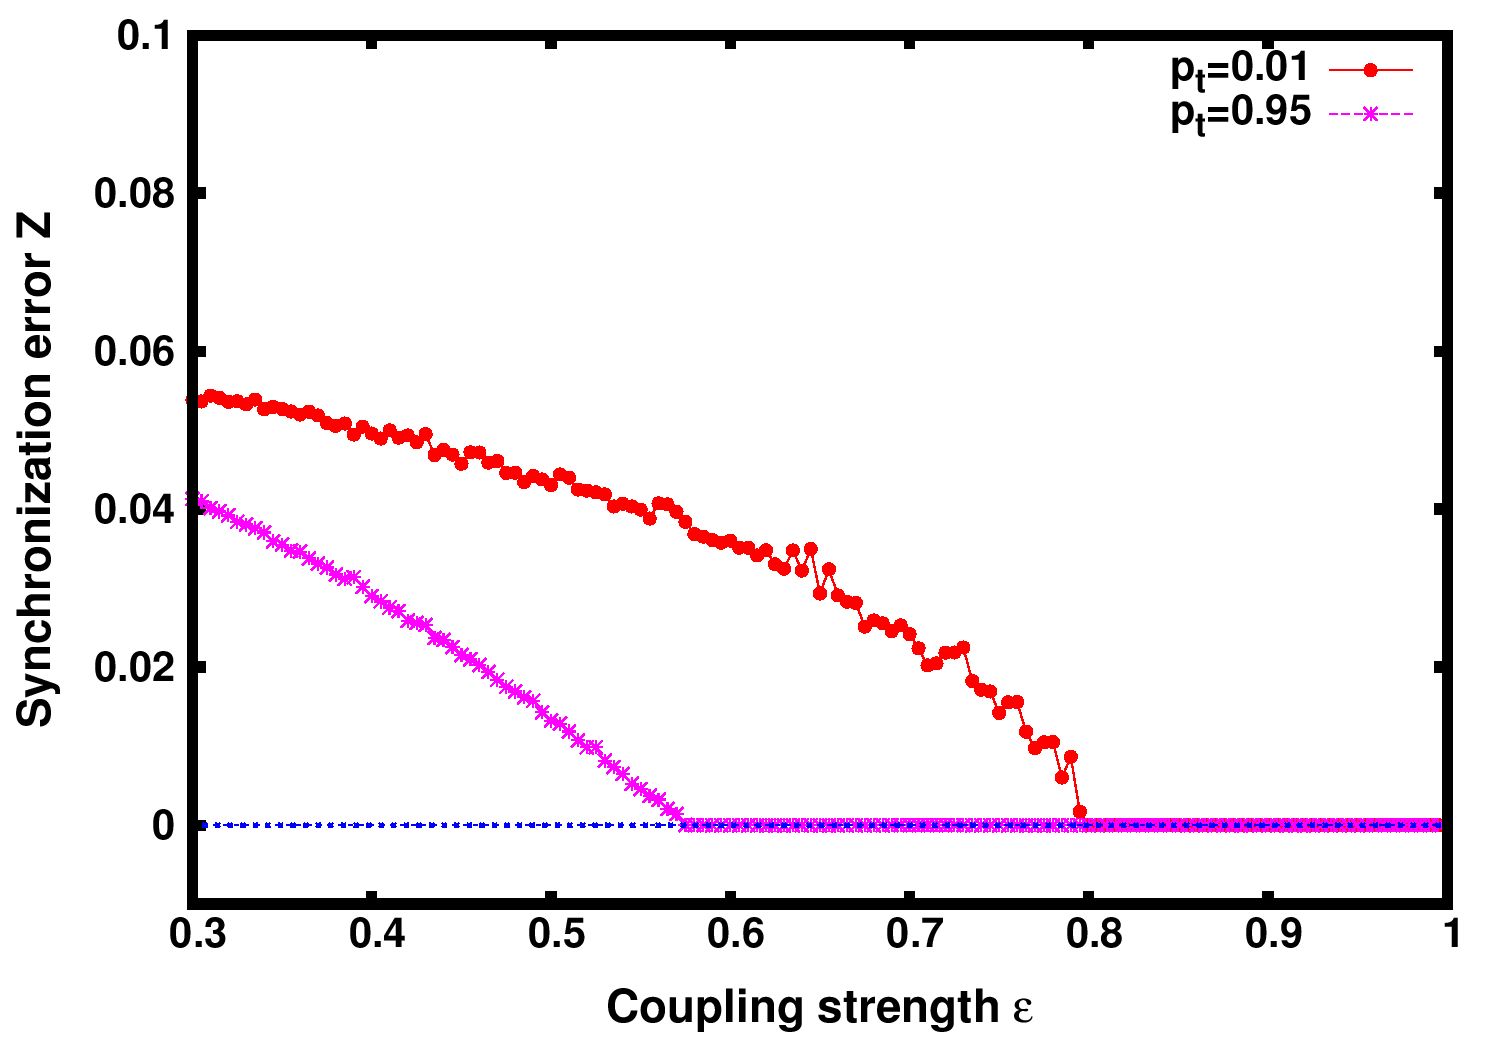
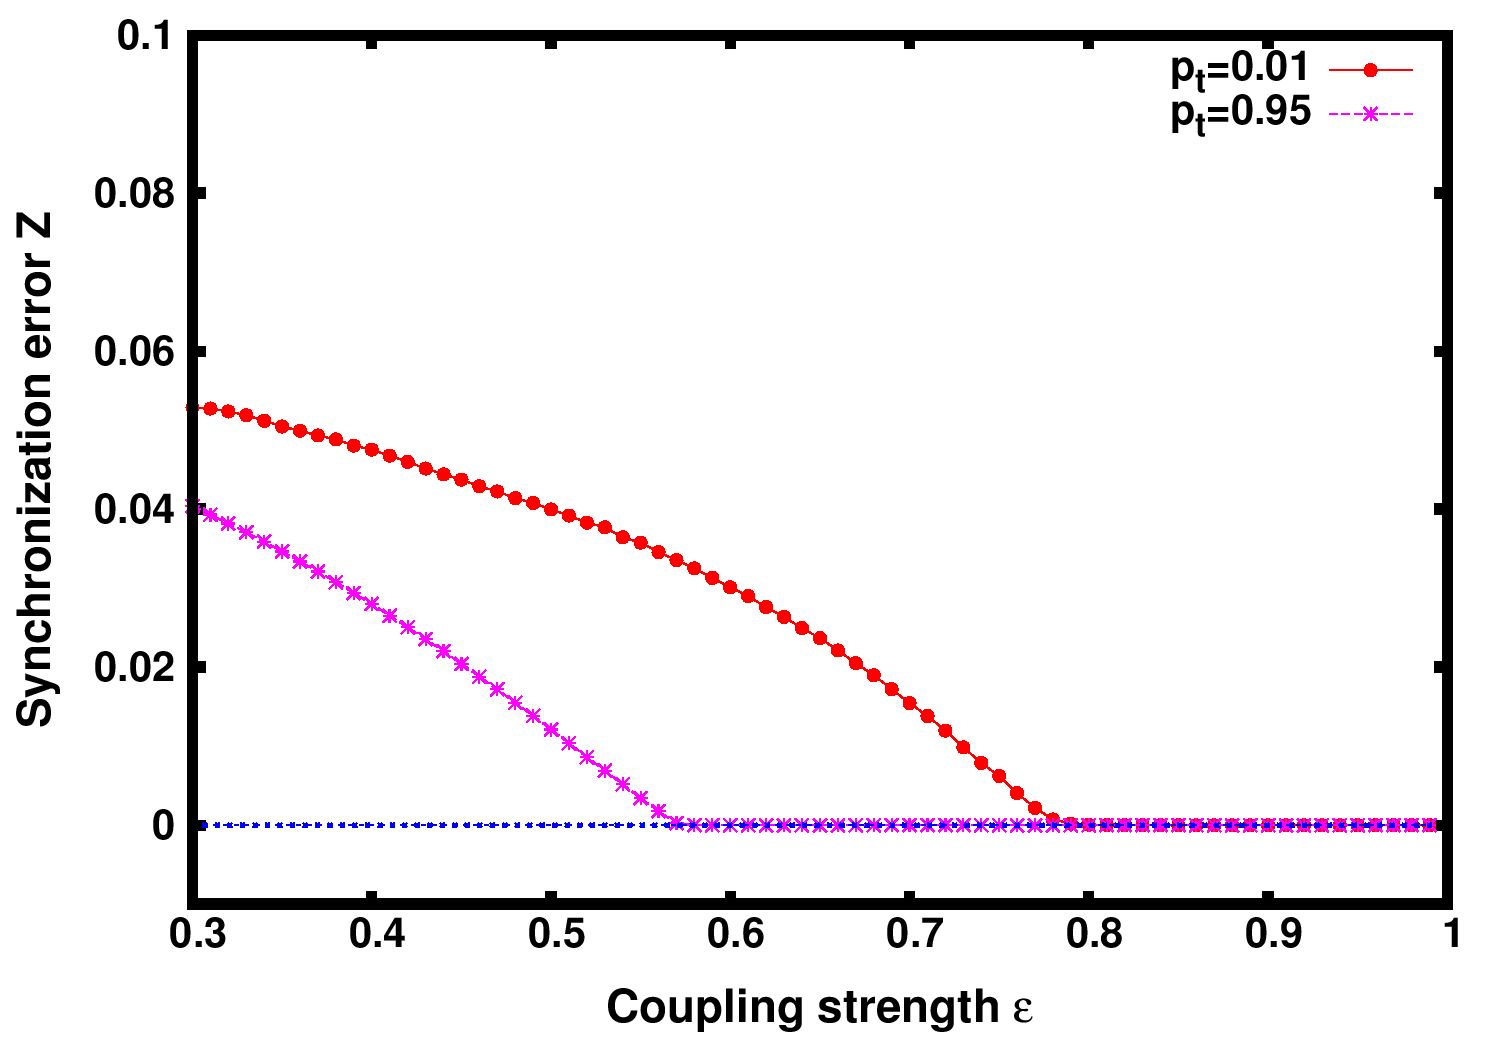
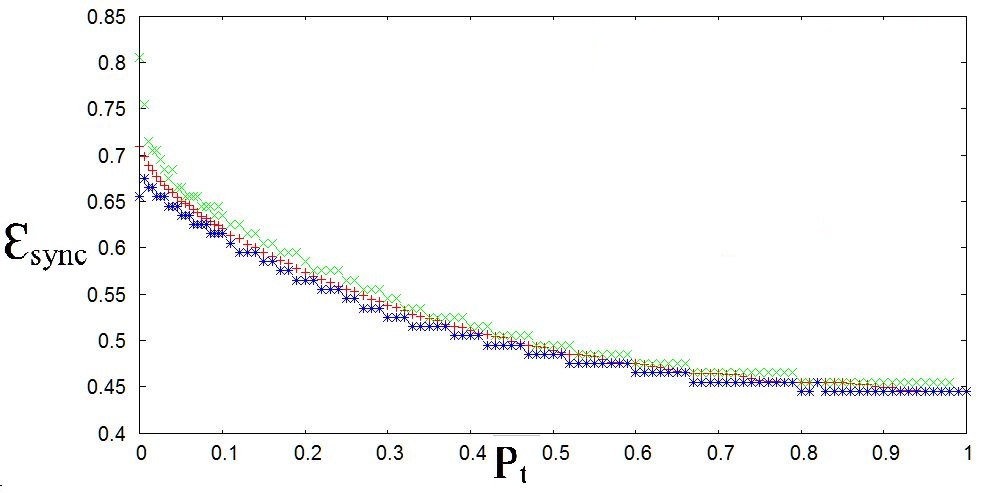
Fig. 4 displays the variation of synchronzation error (averaged over space and time) with respect to the coupling strength , for the case of both local and global link rewiring. It can be clearly seen that as the connection network becomes more dynamic, the range of complete syncronization increases. Furthermore, for both the connection rewiring scenarios the qualitative results are similar.
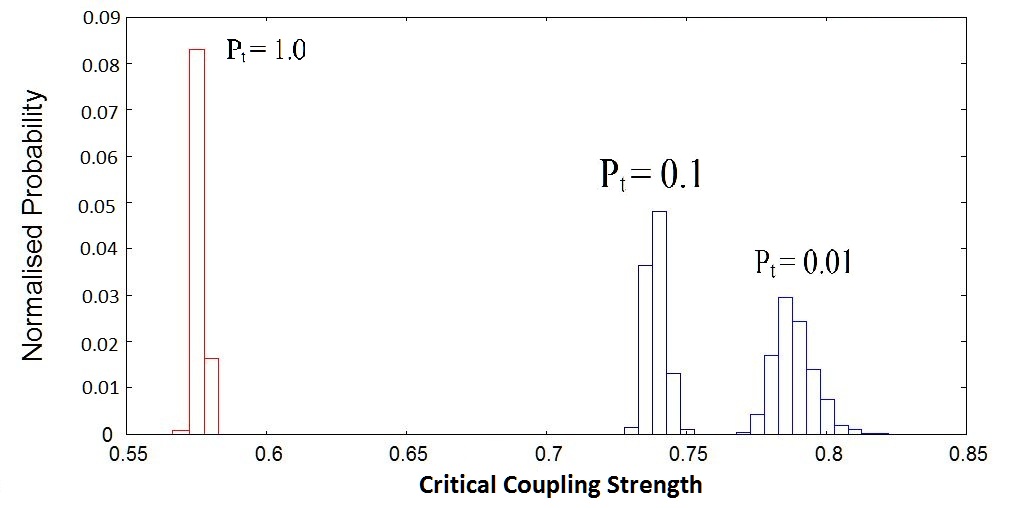
Now, we consider the scenario where link changes are infrequent, namely a network near the static limit, with close to zero. Here one obtains a range of critical coupling strengths, with being strongly dependent on the initial confguration of links. A deeper understanding is gained by studying the distribution of , at fixed and , for different initial realizations, as displayed for representative cases in Fig. 3. It is clearly seen from the numerics that when we are closer to the static limit there is a spread in values of . As the system becomes more dynamics, i.e. as increases, we observe that the spread of narrows considerably, converging rapidly to the average value . This is a reflection of the more effective “self-averaging” arising from dynamically changing network configurations as the system evolves for larger .
Further, the average critical coupling strength also shifts to a smaller value with increasing link switching probability . This implies that lower coupling strengths are necessary to bring about synchronization when the link changes are more rapid.
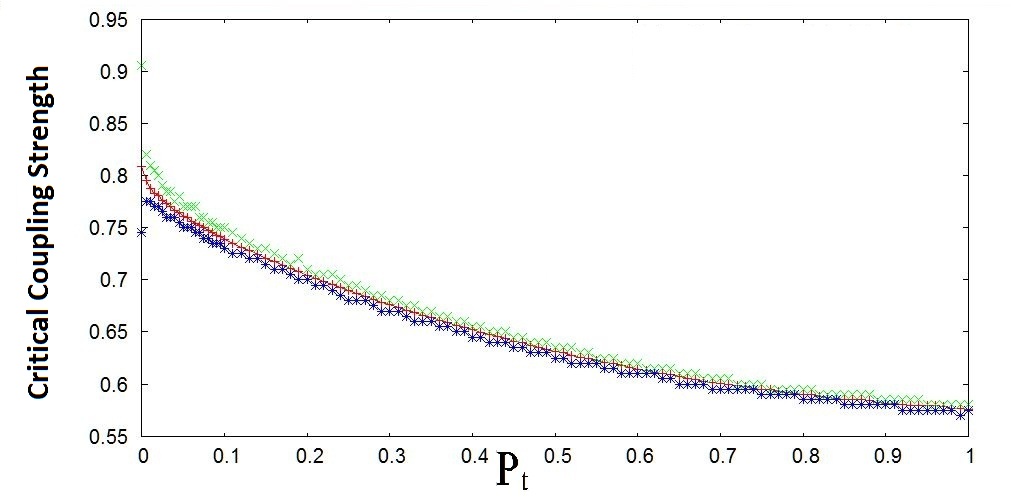
Next we show the variation of the average critical coupling strength with respect to the probability of link change . Figs. 2 display the average critical coupling strength, the maximum value of critical coupling strength and the mimimum value of critical coupling strength . It is evident from the plot that diplays a clear trend under increasing , even at low when there is considerable separation in the and values. Results from the local rewiring scheme is diplayed here. Similar phenomena is observed for the case of global link changes as well.
Intermittent approach to synchronization:
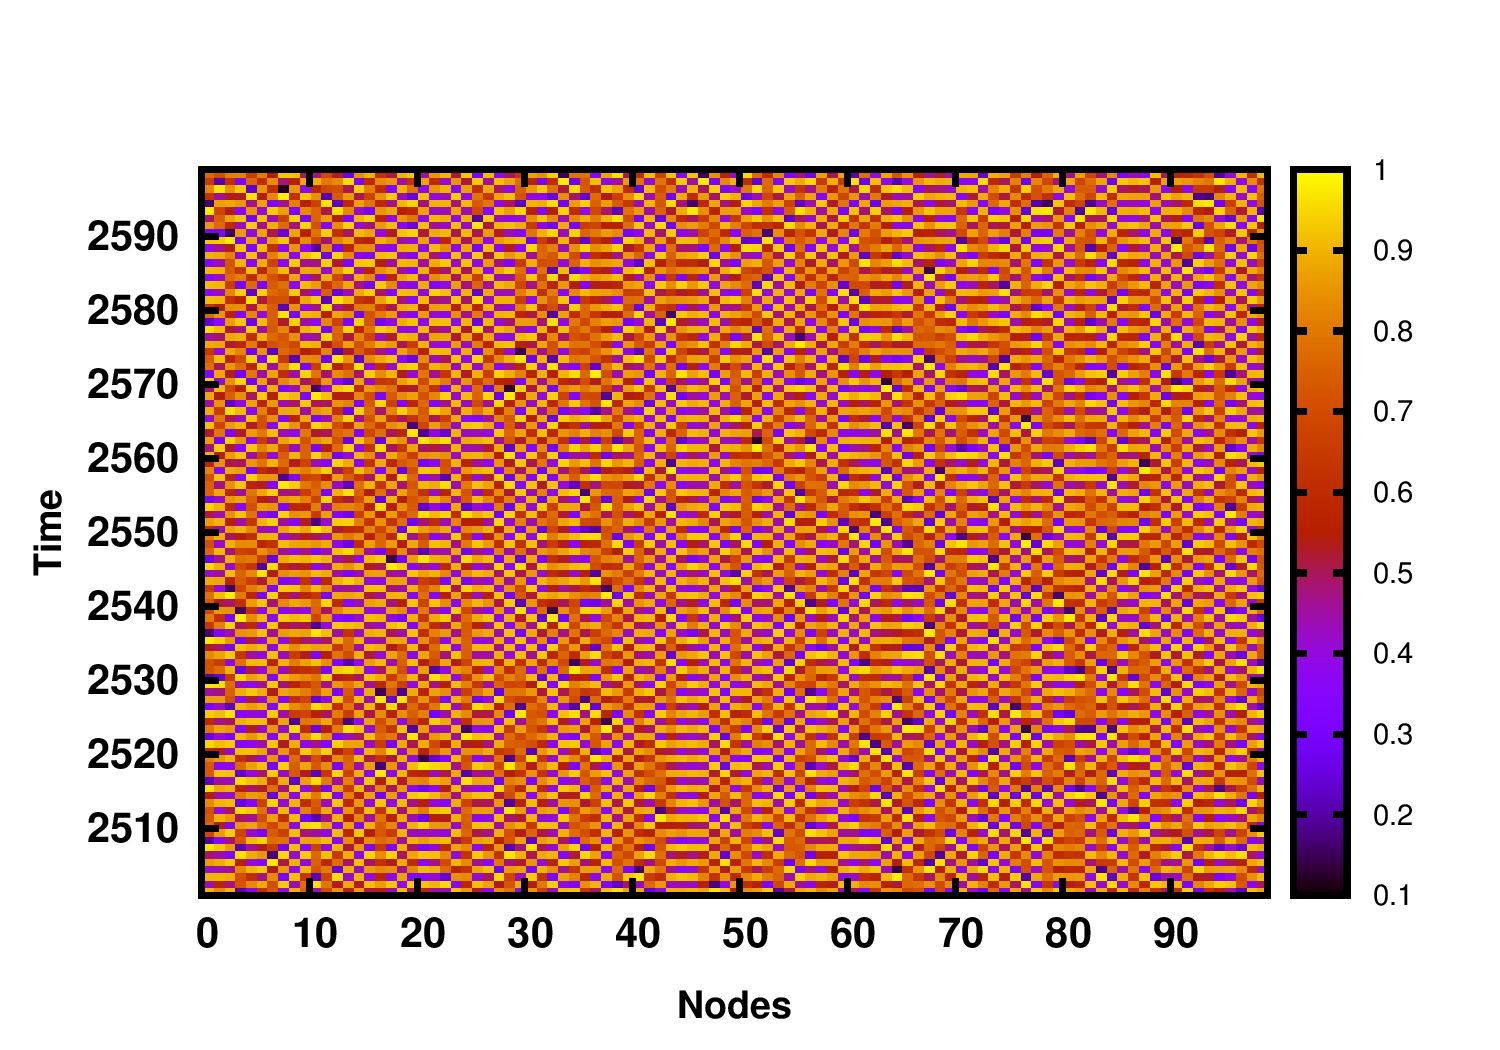
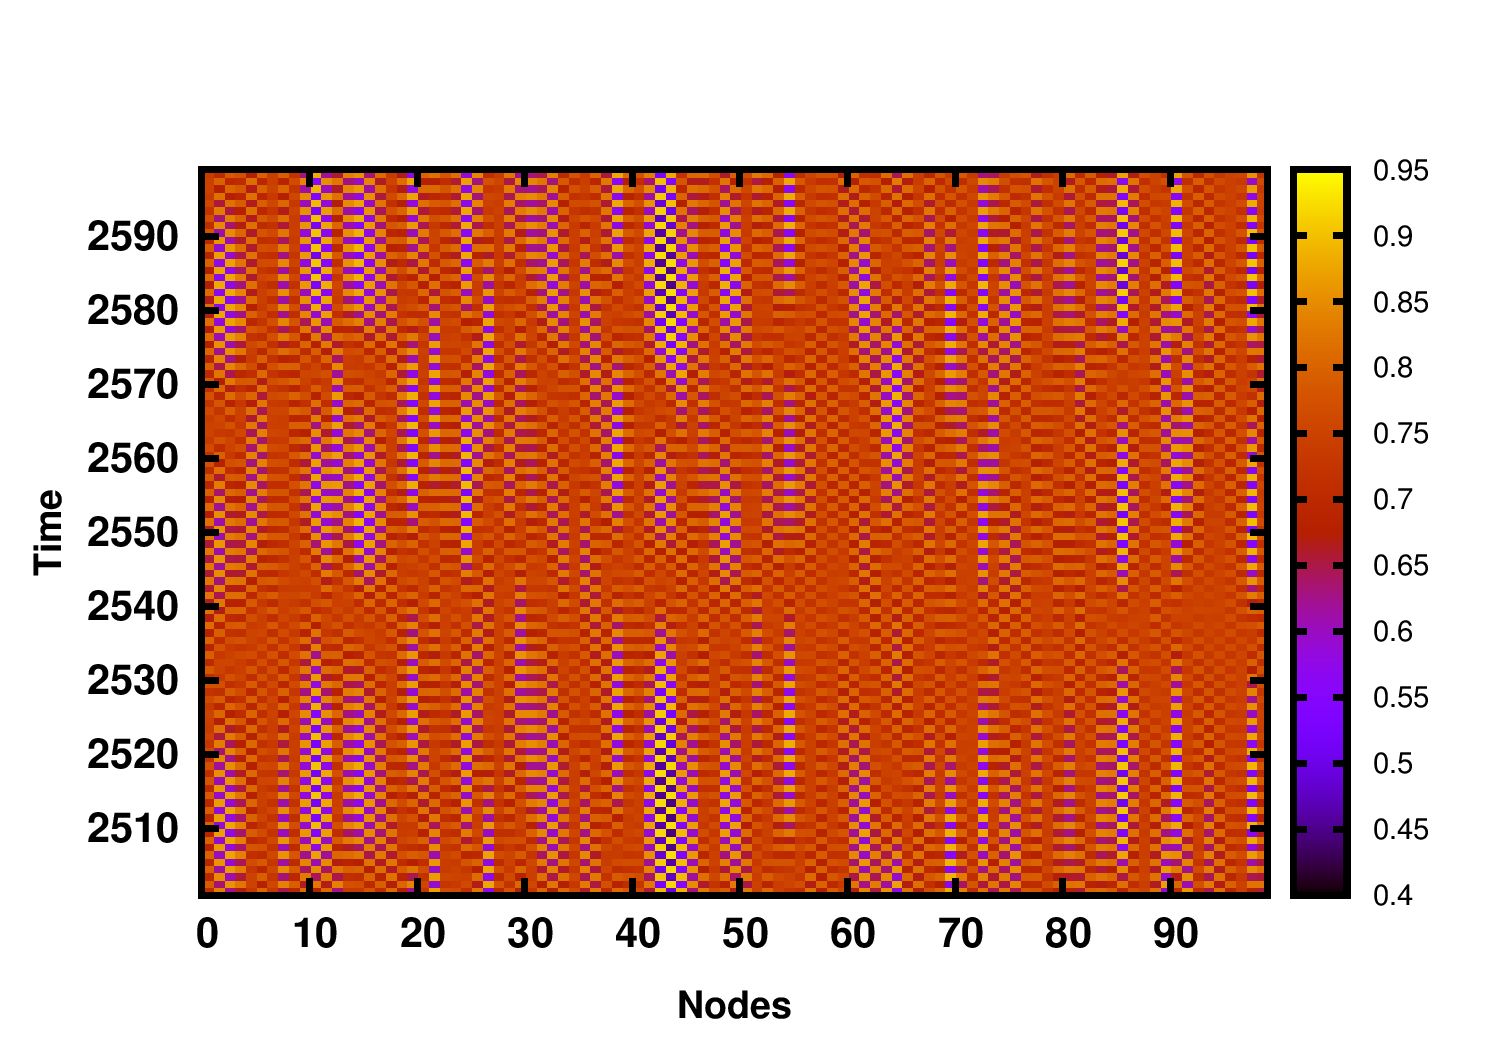
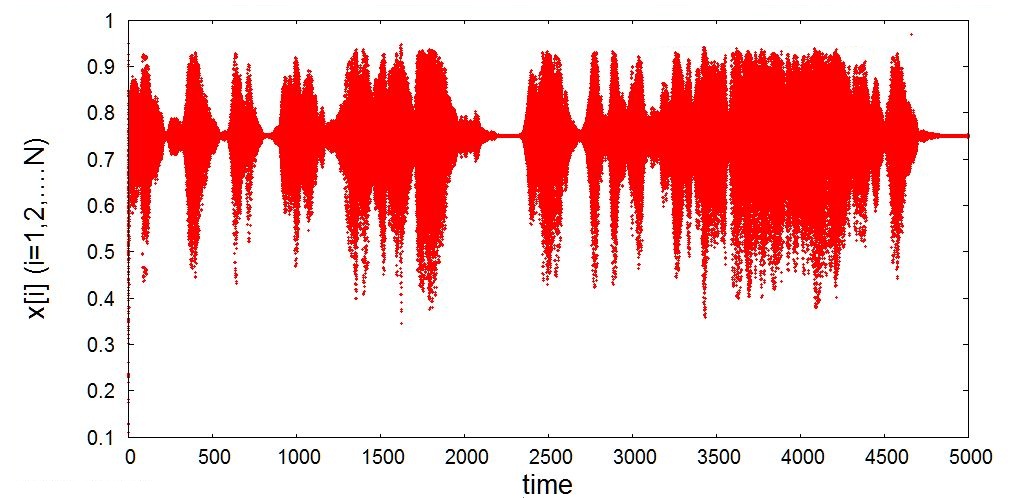
Examining the spatiotemporal evolution of the network, as displayed in Fig. 5 reveals the following feature: one can see low coupling strengths the system exhibits spatio-temporal chaos (cf. left panel of Fig. 5). However as coupling strength increases one observes a dynamical regime in which the system displays intermittent behaviour. Fig. 5 (right) shows the spatio-temporal evolution of one such representative regime, exhibiting syncronized periods with burst of unsyncronized behaviour. Similar qualitative dynamical patterns are obtained for both local and global network changes.
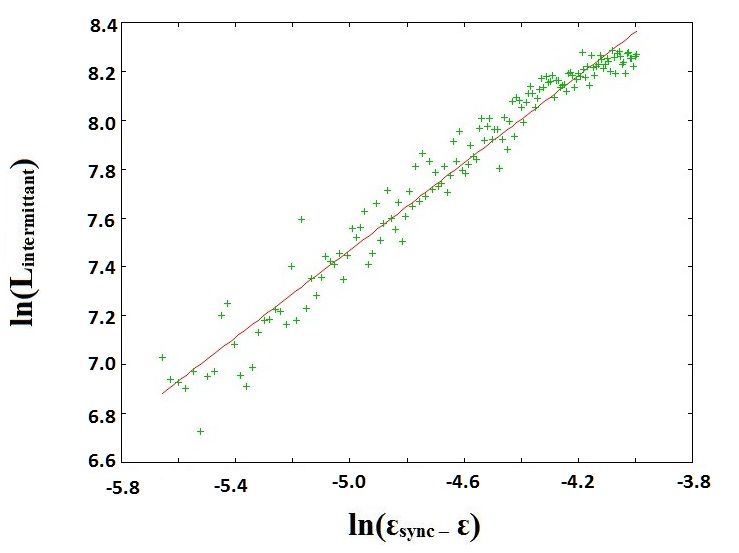
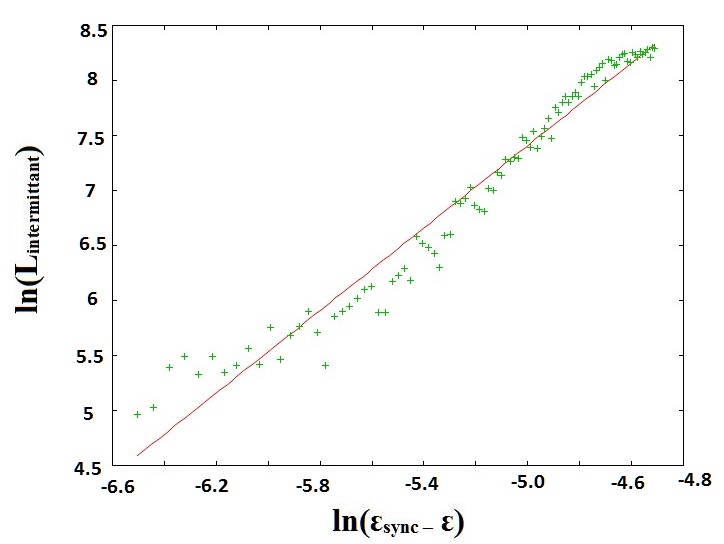
Now to study these intermittent patterns in greater detail, we define a parameter which is the average length of intermitent behaviour in time. Quantitatively this length represents the time between the the first event of near complete spatiotemporal syncronization and the last observed unsynchronized burst. Specifically, without loss of generality, we consider a system synchronized if the synchronization error .
In Fig. 6 we present a simple illustration of one such case. Here the first syncronized stretch is seen at . Subsequently one obtains desyncronized bursts, followed by synchronized intervals, over a period of time. Finally at the last burst of unsyncronized behaviour is seen after which the system remains syncronized up to the limits of the simulation time (). For the completely chaotic region at low coupling strengths, and the completely syncronized region at high coupling strengths there is no intermittency as evident from . However, for a range of coupling approaching the critical coupling strength, the average length of the intermittent period increases as a power law with respect to distance from the critical point (see Fig. 7 for representative examples). It is further evident that increasing the probability of changing links reduces the range of coupling strengths over which this intermittent approach to synchronization is observed.
Mean time to reach the synchronized state:
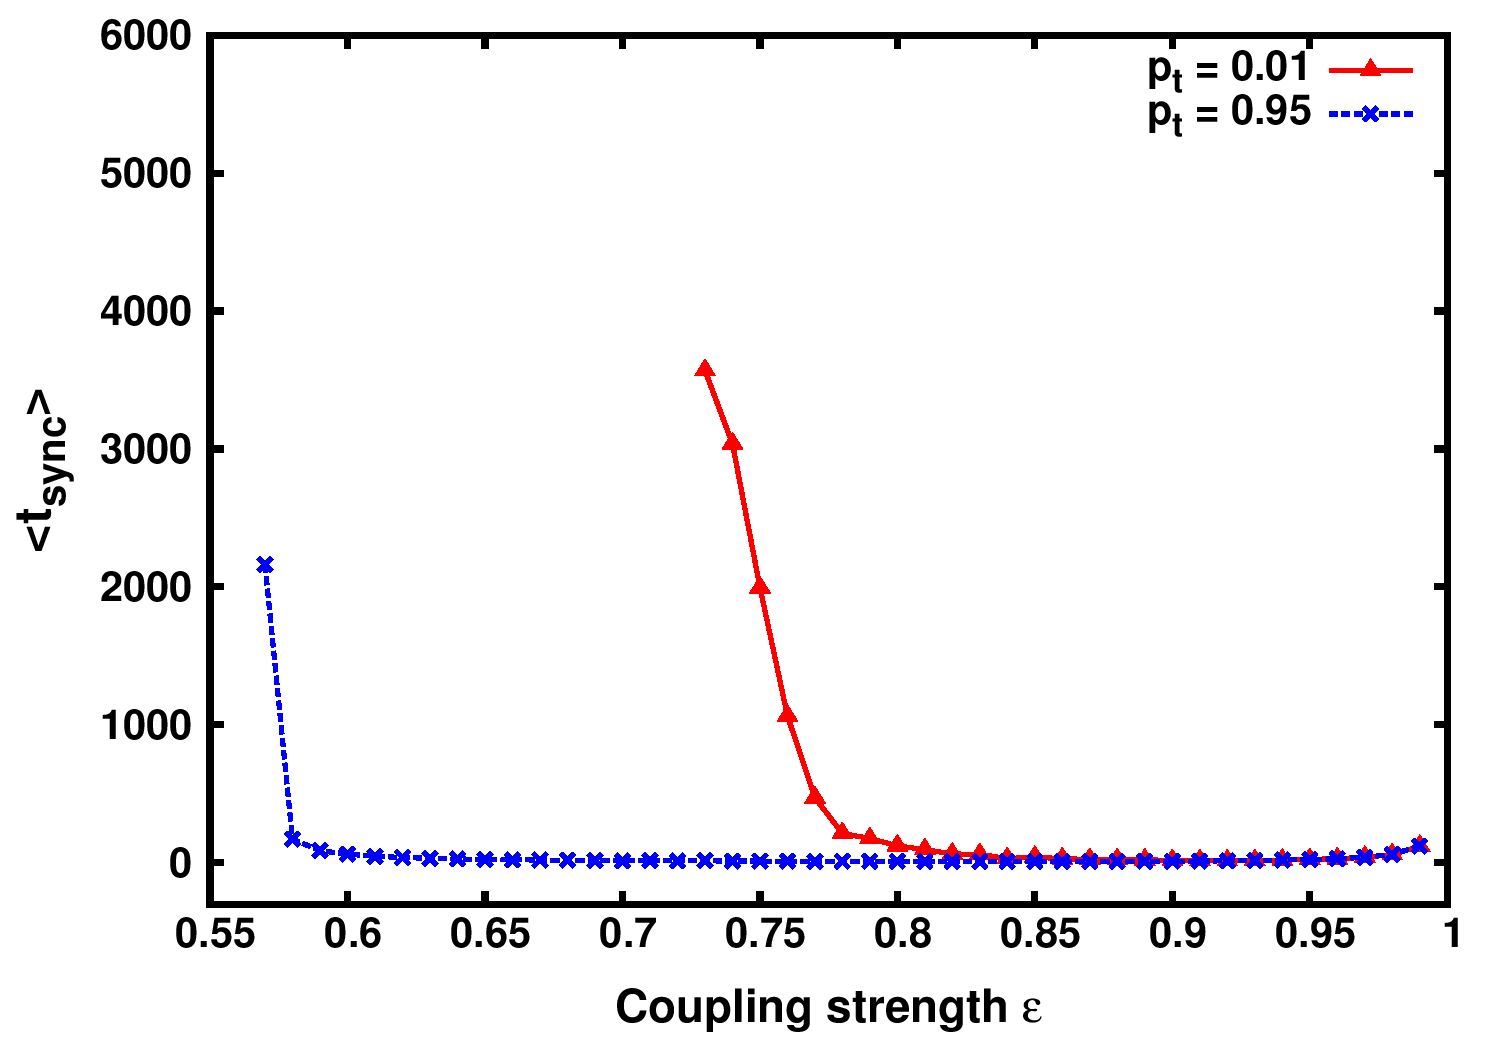
We have also investigated the average time taken by the system, starting from generic random initial conditions, to reach the synchronized state. The results are displayed for two representative cases in Fig. 8. It is clear that more rapid link changes lead to much shorter transience. So the system very quickly reaches the spatiotemporal fixed point when the connections are varying fast.
Analysis:
We now analyse the system to account for the much enhanced stability of the spatiotemporal fixed point under rapidly changing connections. The only possible solution for a spatiotemporally synchronized state here is , where is the fixed point solution of the local map. For the case of the logistic map this is .
To calculate the stability of the network with all sites at , we construct an probabilistic evolution rule for the state of the nodes. In this mean field-like version of the dynamics, the effective influence of the random connections on the local dynamics is given by , and the influence of the nearest neighbours is given by , where is determined by the link change probability as well as the fraction of random sites .
In terms of the averaged evolution equation of node () is
| (3) |
Where and are two random sites ().
Now in order to calculate the stability of the synchronized state, we linearize Eq. 3, by considering , and expanding to first order:
| (4) |
Considering the sum over uncorrelated random neighbours to be equal to zero, one obtains the approximate evolution equation:
| (5) |
For stability considerations one can diagonalize the above expression using a Fourier transform , where is the wavenumber and is the site index, which yields the following growth equation:
| (6) |
with going from to . Specifically, for the case of the chaotic logistic map at we have . So the magnitude of the growth coefficient that appears in the above expression is smaller than q, if and only if
| (7) |
This inequality then yields the coupling strength after which the spatiotemporal fixed point gains stability to be:
| (8) |
Further the range of the spatiotemporal fixed point is given by:
| (9) |
Now is the probability that the links are different from time to time. So must be directly proportional to the probability of random rewiring and the fraction of random links . Starting with the ansatz that , where function is a power law, gives:
| (10) |
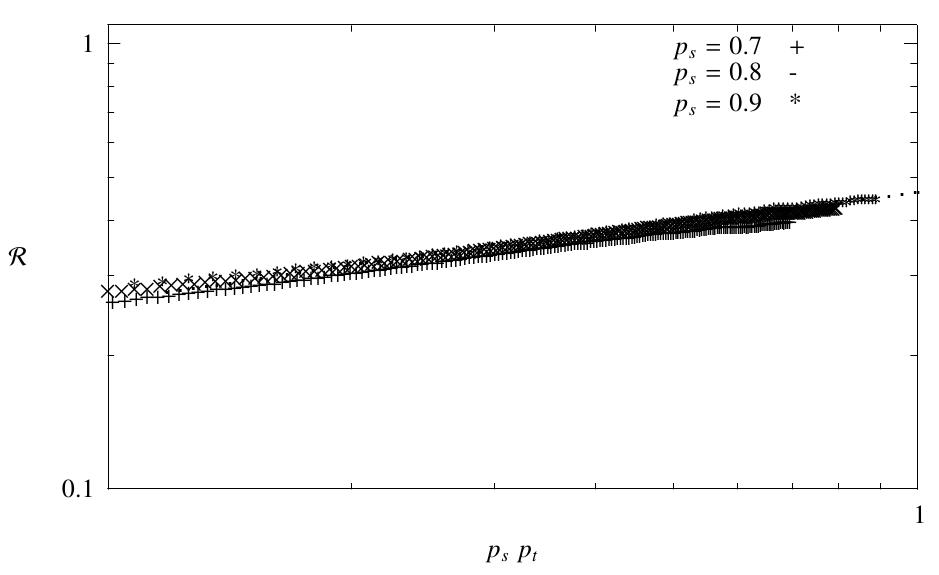
Fig. 9 displays the dependence of the range of the spatiotemporal fixed point obtained numerically for the case of local link change, on . Fitting this to Eq. 10 yields for the range . The range of the spatiotemporal fixed point for the case of global changes can also be fit to the same functional form, with best fit yielding in a similar range of .
Generality of the Results:
In order to gauge the generality of our results, we also analysed a network of Exponential Maps (also known as the Ricker Map). These are given by the dynamical equation:
| (11) |
In the results presented here we take the nonlinearity parameter to be , where the map is strongly chaotic.
Representative results are shown in Fig. 10. Clearly, spatiotemporal synchronization is obtained at coupling strengths , where for .
Further we calculate the variation of , maximum and minimum with respect to link rewiring probability , and the results are displayed in Fig. 11. It is evident that the qualitative picture that emerges is the same as in a network of chaotic logistic maps. Namely, we again observe a wider separation between and at very low (i.e. close to the static limit), and this shrinks rapidly as increases. As before, we also find a smooth decreasing trend for with increasing . So it is clear that more frequent link changes enhances the range of spatiotemporal synchronization, and the critical coupling strength necessary to obtain the spatiotemporal fixed point is lower in networks with faster variation in connectivity.
In summary, in this work we have investigated time varying networks with complex dynamics at the nodes. We considered two scenarios of network change in an interval of time: first, we have the case where each link can change with probability , i.e. the network changes occur locally and independently at each node. Secondly we considered the case where the entire connectivity matrix changes with probability , i.e. the change is global. We demonstrated that network changes, occuring both locally and globally, yield an enhanced range of synchronization. When the connections are changed slowly (i.e. is low) the nodes display nearly synchronized intervals interrupted by intermittent unsynchronized chaotic bursts. However when the connections are switched quickly (i.e. is large), the intermittent behavior quickly settled down to a steady synchronized state. Furthermore we found that the range of synchronization increases significantly with the probability of network change . Additionally the system reaches the synchronized state much more rapidly for the case of switched links. Thus our results highlight the strong effects of time-varying connections on the nodal dynamics, and our principal observations are relevant to the understanding of temporal networks in general.
References
- (1) D J Watts and S H Strogatz, Nature, 393 (1998) 440–2
- (2) A-L. Barabasi and R. Albert, Science, 286 (1999) 509–512
- (3) A. Mondal, S. Sinha, and J. Kurths, Phys. Rev. E, 78 (2008) 066209
- (4) S. Sinha, Phys. Rev. E, 66 (2002) 016209
- (5) Varela, F., Lachaux, J.P., Rodriguez, E. & Martinerie, J., Nat. Rev. Neurosci. 2, 229-239 (2001).
- (6) Brezina, V., Orekhova, I.V. & Weiss, K.R., J Neurophysiol. 83, 207-231 (2000).
- (7) Von der Malsburg, C. Handbook of Brain Theory and Neural Networks,[Dynamic Link Architecture, p.365] (MIT Press, 2002).
- (8) Zanette, D.H. & Gusmán, S.R., J. Biol. Phys. 34, 135-148 (2008)
- (9) Belykh, I. G., Belykh, V. N. & Hasler, M., Physica D 195, 188-206 (2004).
- (10) Amritkar, R. E., Hu, Chin-Kun, Chaos, 16 (2006).
- (11) Kohar, V. & Sinha, S., Chaos, Solitons & Fractals 54, 127-134 (2013).
- (12) A. Choudhary, V. Kohar, S. Sinha, Sci. Rep. (Nature) 4 2014
- (13) Crutchfield, J. & Kaneko, K. in Directions In Chaos, [Hao, B. L.(ed.)] (World Scientific, Singapore, 1987).
- (14) Barahona, M. & Pecora, L.M., Phys. Rev. Lett. 89, 054101 (2002)
- (15) Hong, H., Choi, M.Y. & Kim, B.J., Phys. Rev. E 65, 026139 (2002)
- (16) Poria, S., Shrimali, M.D. & Sinha, S., Phys. Rev. E 78, 035201 (2008).
- (17) Zumdieck, A., Timme, M., Geisel, T., & Wolf, F., Phys. Rev. Lett. 93, 244103 (2004)
