2 LIP-Laboratório de Instrumentação e Física Experimental de Partículas , 3004-516 Coimbra, Portugal
3 Smoluchowski Institute of Physics, Jagiellonian University of Cracow, 30-059 Kraków, Poland
4 GSI Helmholtzzentrum für Schwerionenforschung GmbH, 64291 Darmstadt, Germany
5 Technische Universität Darmstadt, 64289 Darmstadt, Germany
6 Institut für Strahlenphysik, Helmholtz-Zentrum Dresden-Rossendorf, 01314 Dresden, Germany
7 Joint Institute of Nuclear Research, 141980 Dubna, Russia
8 Institut für Kernphysik, Johann Wolfgang Goethe-Universität, 60438 Frankfurt, Germany
9 Excellence Cluster ’Origin and Structure of the Universe’, 85748 Garching, Germany
10 Physik Department E12, Technische Universität München, 85748 Garching, Germany
11 II.Physikalisches Institut, Justus Liebig Universität Giessen, 35392 Giessen, Germany
12 Istituto Nazionale di Fisica Nucleare, Sezione di Milano, 20133 Milano, Italy
13 Institute for Nuclear Research, Russian Academy of Science, 117312 Moscow, Russia
14 Institute of Theoretical and Experimental Physics, 117218 Moscow, Russia
15 Department of Physics, University of Cyprus, 1678 Nicosia, Cyprus
16 Institut de Physique Nucléaire (UMR 8608), CNRS/IN2P3 - Université Paris Sud, F-91406 Orsay Cedex, France
17 Nuclear Physics Institute, Academy of Sciences of Czech Republic, 25068 Rez, Czech Republic
18 LabCAF F. Física, Univ. de Santiago de Compostela, 15706 Santiago de Compostela, Spain
a also at Nuclear Physics Center of University of Lisbon, 1649-013 Lisboa, Portugal
b also at ISEC Coimbra, 3030-199 Coimbra, Portugal
c also at ExtreMe Matter Institute EMMI, 64291 Darmstadt, Germany
d also at Dipartimento di Fisica, Università di Milano, 20133 Milano, Italy
e also at Technische Universität Dresden, 01062 Dresden, Germany
f also at Frederick University, 1036 Nikosia, Cyprus
g now at Lawrence Berkeley National Laboratory, Berkeley, USA
h now at Dipartimento di Fisica Generale and INFN, Università di Torino, 10125 Torino, Italy
∗ corresponding authors: r.kotte@hzdr.de, c.wendisch@hzdr.de
Lambda hyperon production and polarization in collisions of p (3.5 GeV) + Nb
Abstract
Results on hyperon production are reported for collisions of p (3.5 GeV) + Nb, studied with the High Acceptance Di-Electron Spectrometer (HADES) at SIS18 at GSI Helmholtzzentrum for Heavy-Ion Research, Darmstadt. The transverse mass distributions in rapidity bins are well described by Boltzmann shapes with a maximum inverse slope parameter of about 90 MeV at a rapidity of , i.e. slightly below the center-of-mass rapidity for nucleon-nucleon collisions, . The rapidity density decreases monotonically with increasing rapidity within a rapidity window ranging from 0.3 to 1.3. The phase-space distribution is compared with results of other experiments and with predictions of two transport approaches which are available publicly. None of the present versions of the employed models is able to fully reproduce the experimental distributions, i.e. in absolute yield and in shape. Presumably, this finding results from an insufficient modelling in the transport models of the elementary processes being relevant for production, rescattering and absorption. The present high-statistics data allow for a genuine two-dimensional investigation as a function of phase space of the self-analyzing polarization in the weak decay . Finite negative values of the polarization in the order of are observed over the entire phase space studied. The absolute value of the polarization increases almost linearly with increasing transverse momentum for MeV/c and increases with decreasing rapidity for .
pacs:
25.75.Dw, 25.75.Gz1 Introduction
During the past two decades strangeness carrying particles which are produced in relativistic heavy-ion reactions at energies around the corresponding production thresholds in nucleon-nucleon (NN) collisions attracted strong attention from both experimental and theoretical sides Hartnack12 ; GiBUU ; Fuchs04 ; CBMphysicsBook12 ; SengerStroebele99 since their production and propagation are expected to provide insight into the nature of hot and dense nuclear matter. For instance, at energies available at SIS18/GSI Darmstadt densities up to three times that of ground-state nuclear matter and temperatures up to MeV can be achieved. In the pioneering work of the KaoS collaboration at SIS18 on sub-threshold kaon production Sturm01 and based on comparisons to transport approaches Fuchs01 ; Hartnack06 a soft equation of state (EoS) was extracted as predicted already long before AichelinKo85 ; LiKo95 . A strong focus was put on the study of in-medium properties of kaons and antikaons. Especially, their collective flow and spectral shapes at low transverse momenta are expected to be altered within the nuclear environment. The corresponding nuclear mean-field potential acting on the kaons and antikaons are predicted to be weakly positive ( 20 to 40 MeV) and strongly negative ( to MeV), respectively LiBrown_kpm98 ; CassBrat99 . Kaon and antikaon phase-space distributions Hartnack12 ; Kwisnia00 ; Foerster03 ; Merschmeyer07 ; Foerster07 ; Lotfi09 ; hades_K0_ArKCl as well as azimuthal emission (flow) patterns of kaons Hartnack12 ; Crochet00 ; Uhlig05 ; Leifels10 support these predictions while the antikaon flow data are not conclusive yet. The tight interplay of experimental and and theoretical efforts revealed the importance of strangeness-exchange reactions for antikaon production () and absorption (). Also hyperons, being co-produced with kaons, are predicted to feel a weakly attractive potential ( MeV) LiKo96 ; LiBrown98 ; Wang99 . However, experimental data on the flow properties Ritman95 and on spectral shapes Merschmeyer07 ; Justice98 ; hades_Lambda_ArKCl of hyperons produced in heavy-ion collisions near or below threshold are scarce. Evidently, not only nucleus-nucleus but also nucleon-nucleus collisions, though proceeding at densities not exceeding nuclear-matter ground-state density, may contribute to the discussion on medium modifications of meson and baryon properties. Here, valuable information has been collected by the KaoS collaboration, too Scheinast06 . The availability of such information is of great importance, since the reliable characterization of strangeness production and propagation in pA collisions is an indispensable prerequisite for the understanding of heavy-ion collisions. No experimental information is available on hyperon production in case of near-threshold nucleon-nucleus collisions which is assumed to serve as a link between elementary NN and heavy-ion collisions. Such data would allow for an improvement of the predictive power on the strangeness sector of state-of-the-art transport approaches which partially lack reliable input information on elementary processes.
Parity conservation in strong interaction requires that the spin of produced hyperons is aligned perpendicularly to the production plane. In the parity-nonconserving weak process, , the polarization causes a significant up-down asymmetry of the decay proton w.r.t. that plane. The polarization, surprisingly appearing in inclusive reactions with unpolarized beams and targets, was first observed in 1976 at Fermilab in collisions of p (300 GeV) + Be Bunce76 . The observation of the negative polarization and the strong (almost linear) transverse-momentum dependence of its magnitude was rapidly confirmed in p (24 GeV/c) + Pt collisions at CERN-PS Heller77 , in p (400 GeV) + Be again at the Fermilab neutral hyperon beam ( and ) Heller78 , in p (28.5 GeV/c) + Ir at AGS Lomanno79 , and in p (12 GeV) + W at KEK Abe83 . polarization measurements in pp interactions at the CERN intersecting storage rings Smith87 showed no obvious dependence on which was varied from 31 to 62 GeV (which would correspond to 510 and 2050 GeV beam protons on a stationary proton target). However, the polarization was found to increase strongly with Feynman- () and with transverse momentum approaching -40 % when both quantities are maximum. Experiments with polarized beams followed soon, e.g. p + Be collisions at 13.3 and 18.5 GeV/c at the AGS Bonner88 . It is worth mentioning that all of these early experiments consisted of magnetic spectrometers set to fixed scattering angles. But more importantly, they suffered from a rather small solid-angle coverage resulting in a high degree of correlation between the transverse () and longitudinal ( or rapidity) coordinates (e.g. in pN reactions at 450 GeV at CERN-SPS Fanti99 ). Any larger phase-space coverage implied a time-consuming setting of the corresponding spectrometer to different scattering angles with proper relative normalization as tried at Fermilab in p (400 GeV) collisions on Be, Cu, and Pb targets with the main focus on the behaviour of the and polarization at large transverse momentum Lundberg89 . The first exclusive measurements of the polarization were performed with the E766 experiment at the AGS in (n=1-4) at 27.5 GeV/c Felix96 ; Felix99 . polarization in collisions is antisymmetric in by virtue of rotational invariance. Since the detector used had uniform acceptance in , the same polarization magnitude was measured for positive and negative . The behaviour of the polarization in and was found the same for all the studied reactions. First polarization studies of hyperons produced in heavy-ion collisions (10.7 GeV Au + Au) were reported by the E896 collaboration at BNL-AGS Bellwied02 . Their results revealed a dependence of the polarization on the transverse momentum and being consistent with previous measurements in pp and pA collisions. The polarization of hyperons produced inclusively by a beam of 340 GeV/c at CERN-SPS Adamovich04 , however, exhibited the striking feature of the mostly positive sign of the polarization which is opposite to what has been observed in production by protons or neutrons. The HERMES collaboration at DESY determined and polarizations in quasireal photoproduction at the 27.6 GeV positron beam of the HERA collider on an internal gas target Airapetian07 . Surprisingly, the polarization, averaged over the acceptance of the spectrometer, appeared positive, in contrast to almost all other experiments, while the polarization appeared compatible with zero. A linear rise of the polarization magnitude with increasing transverse momentum was found similar to that observed in earlier experiments.
At lower beam energies only few hyperon polarization data exist. The DISTO collaboration at SATURNE investigated strangeness production in elementary pp collisions with polarized proton beam at 3.67 GeV/c Choi98 . First polarization transfer measurements for exclusive hyperon production reactions were reported in ref. Balestra99 . At COSY, the TOF collaboration studied polarization in the elementary reaction with polarized beams at 2.75 and 2.95 GeV/c Pizzolotto07 ; Roeder11 ; Roeder12 . At higher energy and similar to DISTO Choi98 and E766 at AGS Felix96 , the experiments revealed a negative (positive) polarization in the beam (target) fragmentation region, while the polarization seemed to vanish at the lower energy. Besides the polarization of the hyperon, the analyzing power and the spin-transfer coefficient, also referred to as depolarization, could be determined. The lowest beam energy so far for which a polarization value could be determined amounts to 1.8 GeV. For central nucleus-nucleus collisions of Ar+KCl at this beam kinetic energy per incident nucleon, the streamer-chamber group at the BEVALAC reported an average polarization value of about Harris81 . For recent reviews including parameterizations of various polarization dependences on kinematic quantities we refer the reader to refs. Felix99a ; Siebert08 ; Nurushev2013 .
While the polarization seems to be established as an experimental fact, its origin remains a mystery. Various models are proposed, assigned either to the quark-exchange Andersson79 ; DeGrand81 ; Zuo-tang97 ; Hui04 ; Yamamoto97 ; Kubo99 or to the meson-exchange picture Laget91 ; Soffer92 ; Sibirtsev98 ; Gasparian01 ; Sibirtsev06 . But, there is still no theoretical description which is able to explain the experimental observations consistently Felix99a .
Summarizing the experimental situation on production and polarization, we conclude that the high-acceptance spectrometer HADES hades_spectro would be an appropriate experimental device allowing for I) the investigation of the phase-space distribution in proton-nucleus collisions and II) the study of a genuine two-dimensional (transverse, longitudinal) dependence of the polarization over a large phase-space region, feasible with one and the same apparatus setting.
The present paper is organized as follows. In Sect. 2 we give an overview of the HADES experiment on p + Nb collisions at 3.5 GeV beam kinetic energy. We proceed with the data analysis in Sect. 3. In Sect. 3.1 we present the method to identify the hyperons from their weak decay into proton- pairs, while in Sect. 3.2 we describe the analysis chain for the extraction of experimental phase-space distributions and the corresponding predictions by transport models. In Sect. 3.3 the results on the polarization and its phase-space dependence will be presented. Finally, in Sect. 4 we summarize our results.
2 The experiment
The experiment was performed with the High Acceptance Di-Electron Spectrometer (HADES) at the Schwerionensynchrotron SIS18 at GSI, Darmstadt. HADES, although primarily optimized to measure di-electrons HADES-PRL07 , offers excellent hadron identification capabilities hades_K0_ArKCl ; hades_Lambda_ArKCl ; PhD_Schmah ; hades_kpm_phi ; hades_Xi allowing for a profound correlation analysis. A detailed description of the spectrometer is presented in ref. hades_spectro . The present results are based on a dataset which was previously analyzed with respect to e+e- hades_epm_pNb as well as to pion and production hades_pion_eta_pNb ; Tlusty_Bormio_2012 in collisions of p + Nb at 3.5 GeV; the production of mesons, focussing on the phase-space distribution and its alteration due to the influence of a kaon-nucleon potential at nuclear-matter ground-state density, will be reported elsewhere. In the following we summarize the main features of the apparatus.
HADES consists of a 6-coil toroidal magnet centered on the beam axis and six identical detection sections located between the coils and covering polar angles from 18 to 85 degrees. The six sectors consist of hadron blind Ring-Imaging Cherenkov (RICH) detectors (not used for the present investigation), four planes of Multi-wire Drift Chambers (MDCs) for track reconstruction, and two time-of-flight walls, TOFino (polar angles ) and TOF (), supplemented at forward polar angles with Pre-Shower chambers. The TOF and TOFino+Pre-Shower detectors were combined into a Multiplicity and Electron Trigger Array (META). A reconstructed track in the spectrometer is composed of straight inner and outer track segments in the MDCs. The pointing vector of the outer track segment is used for matching with a META hit. Possible trajectories through pairs of inner and outer track segments are combined to track candidates. A Runge-Kutta algorithm allows to calculate the momentum of each track candidate making use of the track deflection in the magnetic field between the inner and outer segments. The quality of the META-hit matching and the Runge-Kutta fitting (characterized by values) is used to create an ordered list of track candidates. The track candidate with the lowest product of both values is selected as the true track. Its segments and associated track candidates are then deleted from the candidate list. This procedure is repeated until no track candidates are left in the list.
Particle identification of protons and mesons is based on the correlation of their momenta and energy loss in the MDCs. Two-dimensional cuts in the corresponding correlation plots are used to select the different particle species. For more details, e.g. the quality of kaon identification, see refs. PhD_Schmah ; hades_kpm_phi . Finally, the momentum calculated from the track curvature is corrected for the energy loss of the charged particles in the target, beam pipe and detector materials.
In the present experiment, a proton beam of about particles per second with kinetic energy of 3.5 GeV (corresponding to an excess energy w.r.t. the threshold for production in NN collisions of GeV) was incident on a 12-fold segmented target of natural niobium (93Nb). The choice of the target was the result of simulations aimed at optimizing the di-electron experiment hades_epm_pNb , i.e. compromising on the ratio of the vector-meson production and the combinatorial background due to conversion. However, the usage of this medium-size target is of advantage also for the present investigations, since the p- combinatorial background increases stronger with target mass than the yield which in turn is tightly connected to the production of the associated kaons Scheinast06 . The data readout was started by different trigger decisions hades_pion_eta_pNb . For the present analysis, we employ only the data of the first-level trigger (LVL1, downscaled by a factor of three), requiring a charged-particle multiplicity in the TOF/TOFino detectors. We processed about of such LVL1 events. The total reaction cross section of mb is provided by measuring charged pions and by interpolating known pion production cross sections hades_epm_pNb ; Tlusty_Bormio_2012 .
3 Analysis
3.1 identification
It is important to mention that hyperons decay almost exclusively into ’s via the decay (branching ratio %, lifetime m PDG2012 ), with the photon not being detected in the present experiment. Hence, throughout the paper, any “ yield” has to be understood as that of . Correspondingly, in case of transport model simulations (cf. Sect. 3.2.3), where the individual particle species are known, the yields of and hyperons are summed up. Furthermore, we note that the actual polarization may be considerably larger than the measured one presented in Sect. 3.3, since hyperons from decay are expected to carry, on average, -1/3 the polarization of the Heller77 . The latter one is predicted Heller78 ; Andersson79 and measured Dukes87 to be opposite to that of the .
In the present analysis, we identify the hyperons through their weak decay ( %, cm PDG2012 ), with the charged daughter particles detected in HADES hades_Lambda_ArKCl ; hades_Xi . The long lifetime of the causes a sizeable fraction of these particles to decay away from the primary vertex. The precision of the track reconstruction with HADES is sufficient to resolve these secondary vertices PhD_Schmah ; hades_Xi . For the selection of ’s, topological cuts are used. As a compromise between a high yield and a reasonable signal-to-background ratio ( all over the investigated phase space), we choose
i) a minimum value of the decay vertex distance to the primary vertex, mm,
ii) minimum values of the proton and shortest track distances to the primary vertex, mm, mm, and
iii) an upper threshold of the proton- minimum track distance, mm.
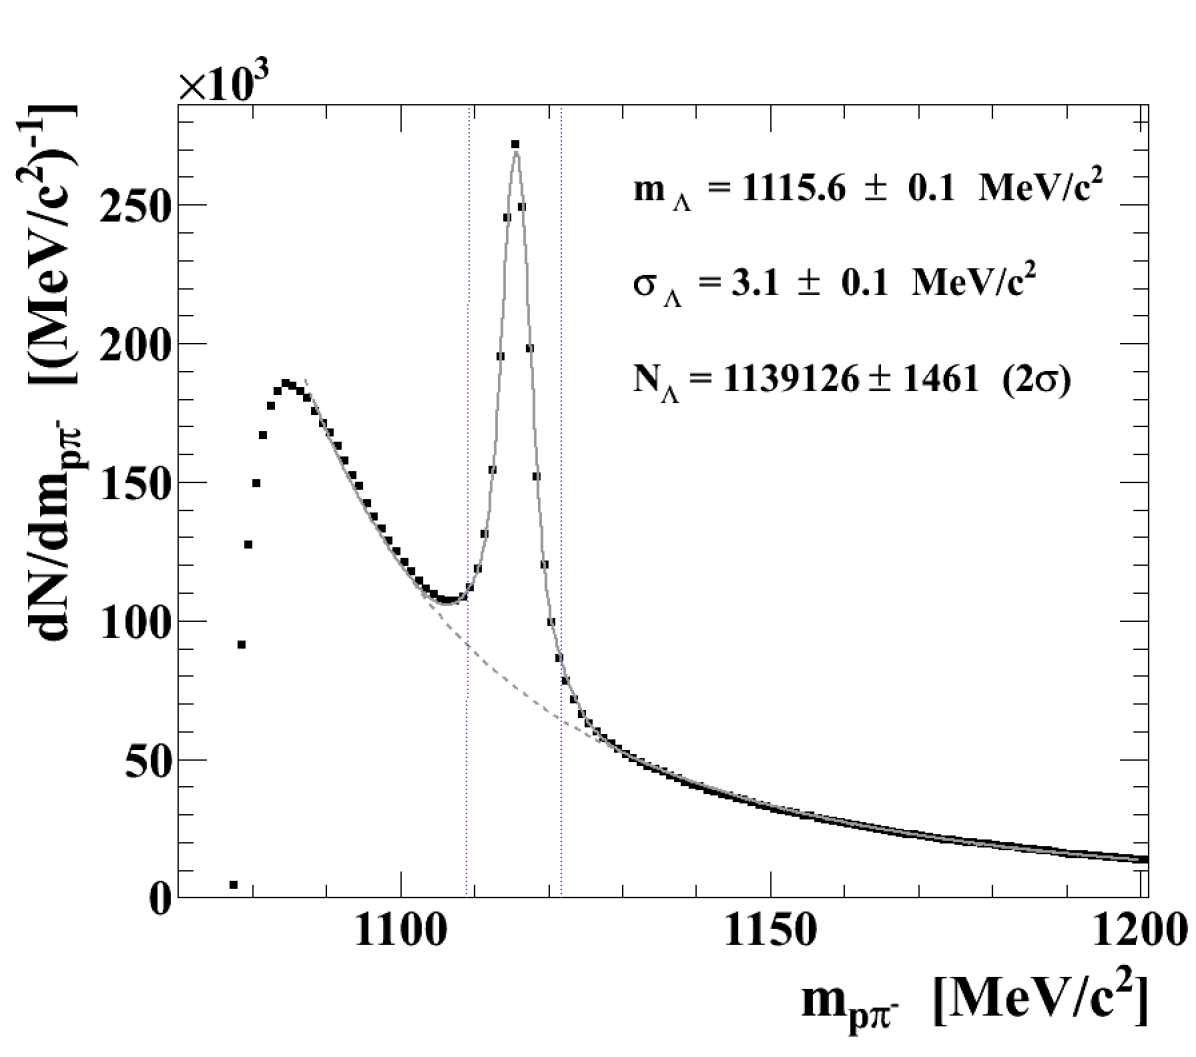
Here, the off-vertex cut i) is the main condition responsible for the extraction of a signal with good ( 1) signal-to-background ratio. Figure 1 shows the invariant-mass distribution of all proton- pairs which pass the cuts listed above. To extract the yield, the invariant-mass spectrum is fitted, typically in the range from 1090 to 1200 MeV, with a combination of different functions describing both the signal and the combinatorial background of uncorrelated proton- pairs. The signal peak is parametrized by two Gaussians (with identical mean values but different widths to account for a certain broadening of the peak at its base), while the background is approximated by a Tsallis (q-exponential) function, . Here, is a linear function of the invariant mass, , and is a shape parameter which may account for the phase-space limitation at large invariant masses, due to energy-momentum conservation. (Approximating instead the combinatorial background with the event-mixing technique, a quite similar quality of reproduction of the invariant-mass distribution over almost the entire mass ranges below and above the peak () is possible, with a slight exception of some underestimate of the data near ( MeV) to the kinematical limit, i.e. the sum of the proton and masses.) From the Gaussian fit to the peak, the pole mass is determined to be MeV, in very good agreement with the value of MeV listed by the Particle Data Group PDG2012 . The peak width, which is a pure apparatus effect, is taken as the weighted average of the sigma widths of both Gaussians. It amounts to 3.1 MeV, being only slighty larger than the corresponding widths measured in previous HADES analyses of the system Ar (1.76 GeV) + KCl hades_Lambda_ArKCl ; hades_Xi where, on average, lower momenta and hence tracks with higher curvature are involved. In total, for the cuts listed above and after background subtraction, about hyperons were reconstructed within a window around the peak mass, with a mean signal-to-background ratio of 1.1.
3.2 inclusive phase-space distribution
3.2.1 Experimental data
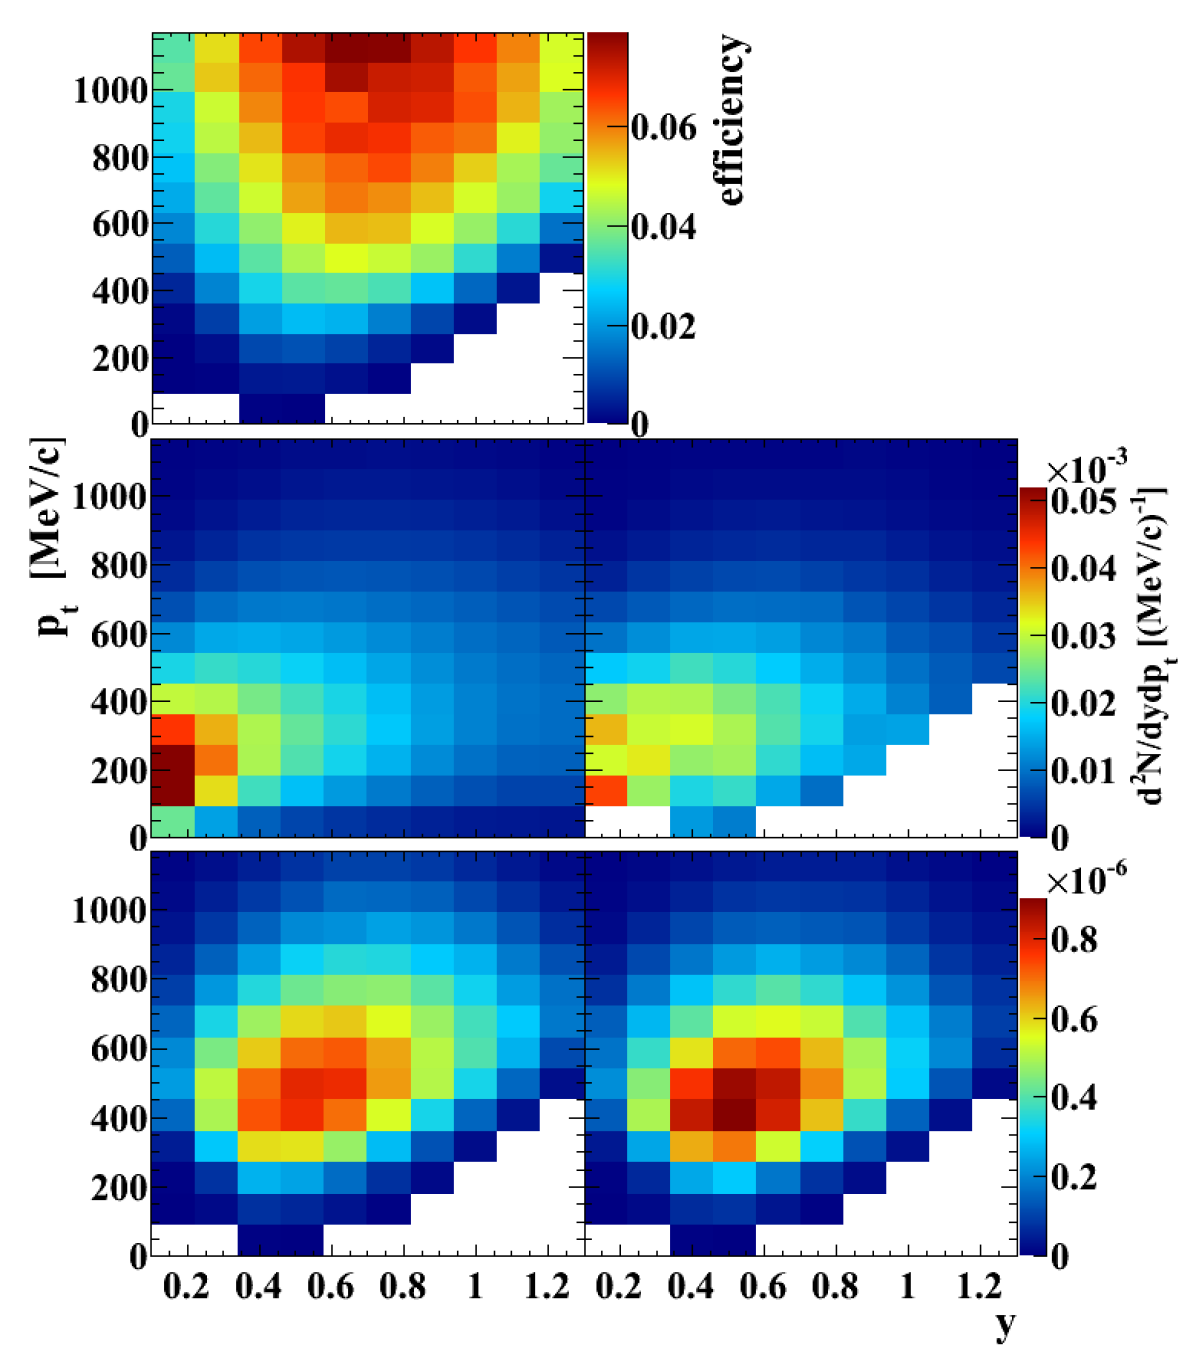
The bottom right panel of Fig. 2 shows the two-dimensional raw data yield (i.e. peak yields extracted from the proton- invariant-mass distributions after subtraction of the combinatorial background) as a function of transverse momentum and rapidity. Corrections for detector acceptance and reconstruction efficiency were performed with Monte-Carlo simulations involving, as appropriate event generator, the UrQMD transport approach UrQMD1 ; UrQMD2 and the GEANT GEANT package accounting for the proper particle decays and the finite detector acceptance, granularity, resolution, etc. The minor missing experimental yield outside the window around the -peak mass (cf. Fig. 1) is well considered by applying the same cut to the simulation which exhibits a similar broadened peak base proved to be due to small-angle scattering in air and in the detector materials of the decay products. The bottom left panel of Fig. 2 displays the GEANT output, while the middle left panel shows the UrQMD output. The ratio of both distributions of simulated data delivers the corresponding reconstruction efficiency matrix (top left panel). Note that also the bias on the yield due to the effect of the LVL1 trigger is estimated with the help of UrQMD+GEANT simulations. An enhancement of the LVL1 triggered yield over the minimum-bias value of has been found which is corrected for when determining the final (minium-bias) yield as a function of phase-space population. Within the given marginal uncertainty, the correction factor itself exhibits no dependence on phase space. Finally, after dividing – for each phase-space cell – the experimental raw data by the corresponding efficiency, the distribution corrected for acceptance, reconstruction efficiency, LVL1 trigger bias, and non-target interaction (17 % events w/o tracks), is derived and displayed in the middle right panel of Fig. 2. Note that this phase-space distribution is the prerequisite for the two-dimensional investigation of the polarization presented in Sect. 3.3.
To extrapolate into the unmeasured region at low transverse momentum, we follow the widely applicable and commonly used recipe of approximating the spectra by Maxwell-Boltzmann distributions. To do so, we start with the triple differential yield . Here, is the total energy, is the lab. rapidity, is the transverse mass, () is the transverse (longitudinal in beam direction) momentum, and is the rest mass of the particle of interest. Finally, gives the speed of light in vacuum. Transformation from spherical to cylindrical coordinates (being more appropriate for an almost rotational symmetric apparatus) and integration over the azimuthal angle delivers the two-dimensional yield
| (1) |
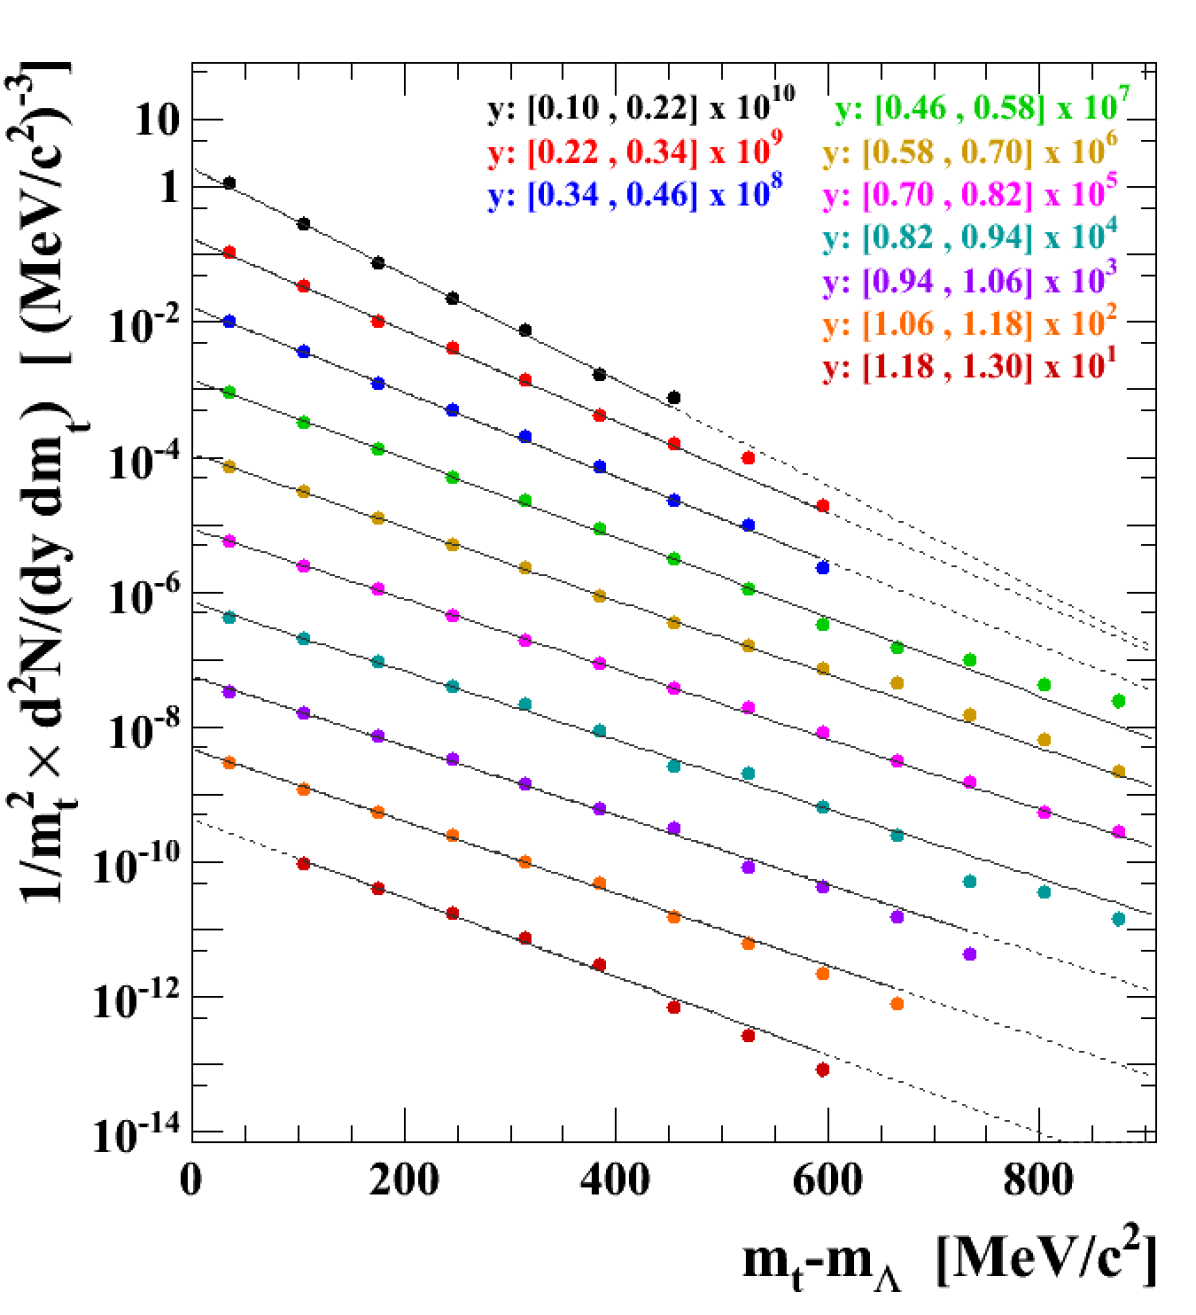
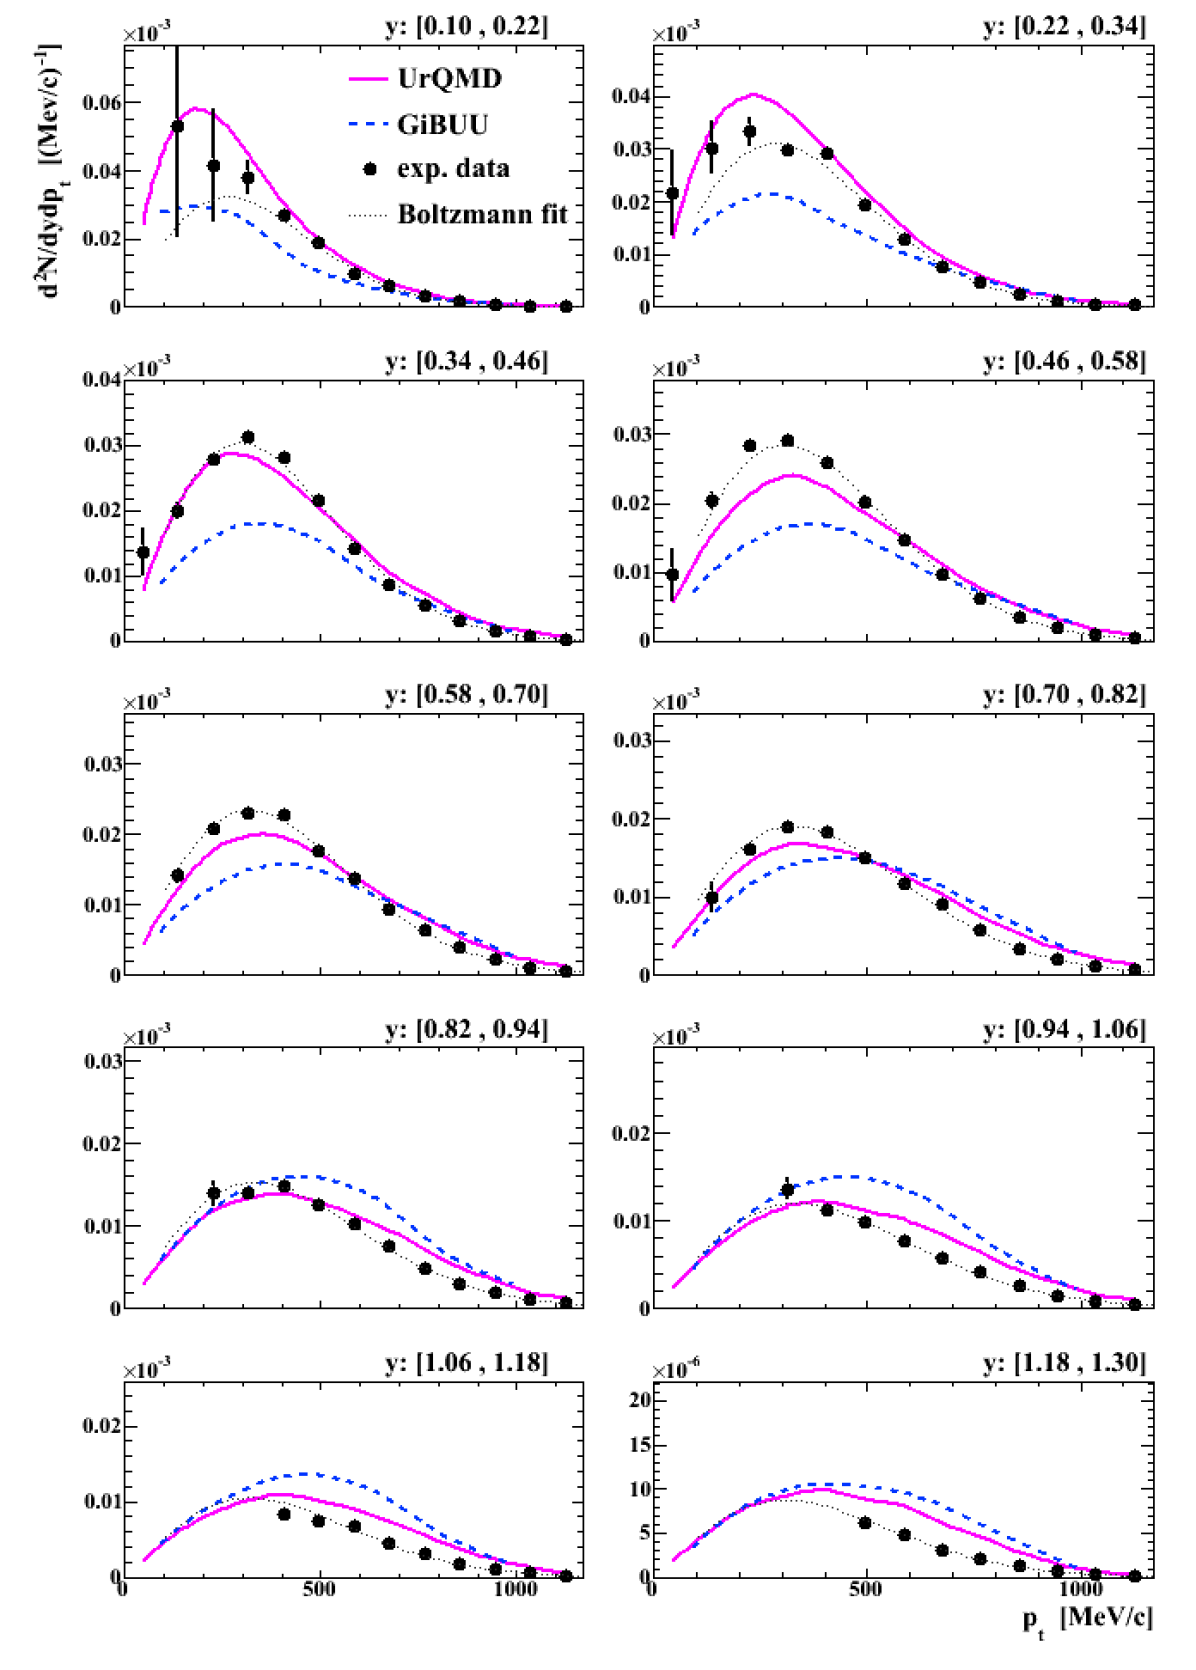
Fits with a simple exponential to these transverse-mass spectra in slices of rapidity deliver constants, , and inverse (Boltzmann) slope parameters, . Figure 3 shows the distributions for the indicated rapidity regions. The lines are Boltzmann fits to the data according to Eq. (1). For the determination of the distribution, the experimental data, where available, are integrated, and the yield in the unmeasured region is obtained from the fit.
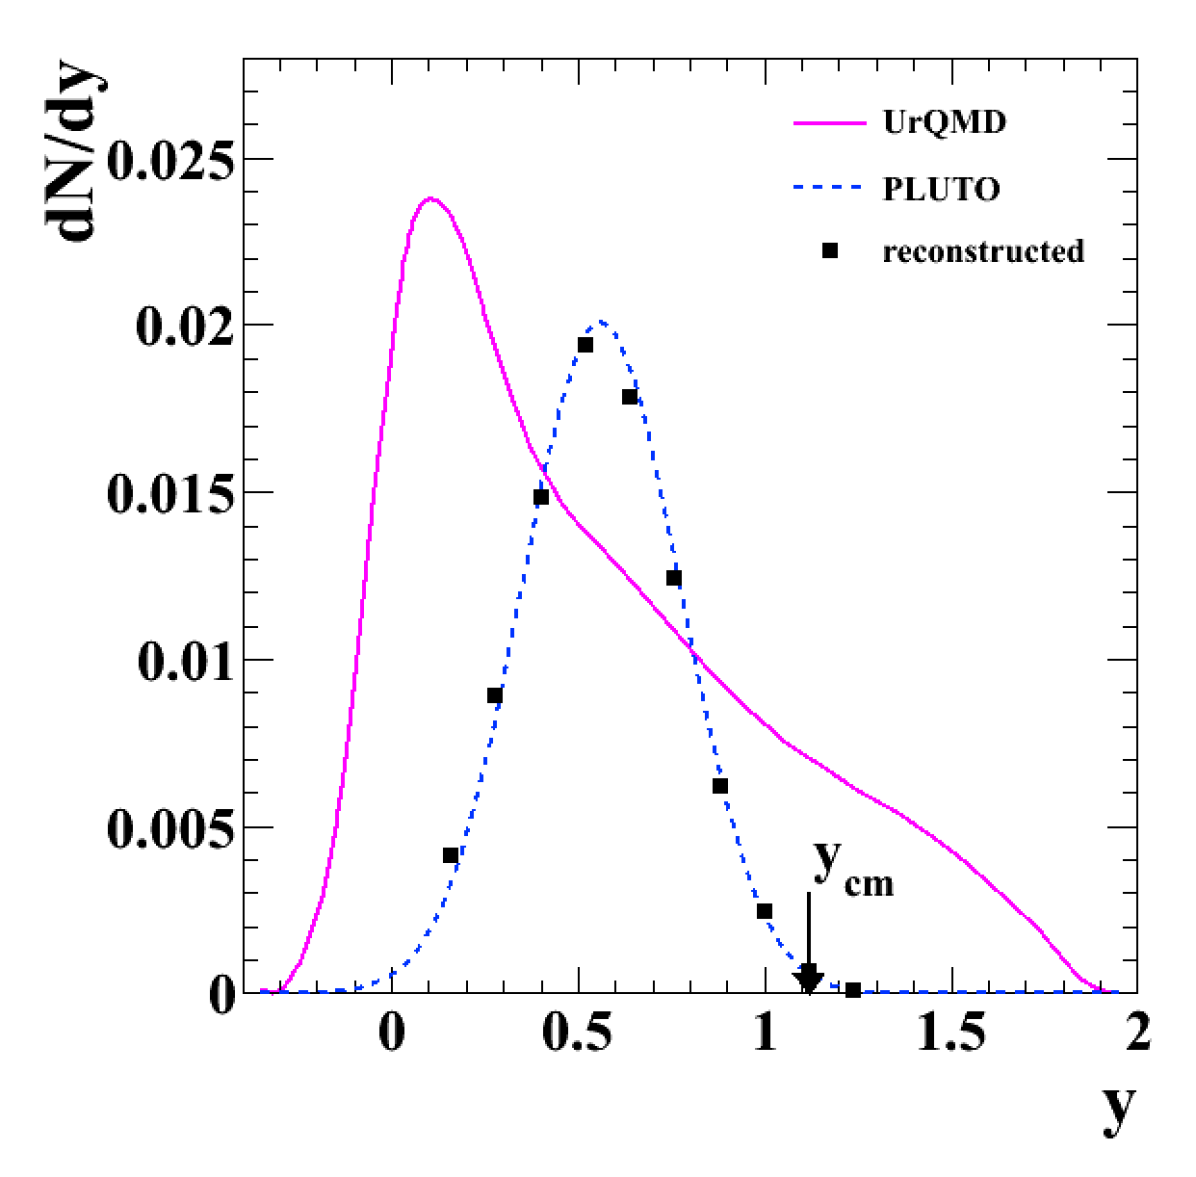
Before we present the rapidity dependences of the inverse slope parameter, , and the rapidity density distribution, , of hyperons produced in p+Nb collisions, we show the result of a self-consistency check, i.e. using UrQMD simulations for the acceptance and reconstruction efficiency corrections and analyzing another simulation similarly to the experimental data. For this purpose, we used the fireball option of the event generator Pluto Pluto . Based on the expected experimental phase-space distribution, we generated hyperon events populating the phase space according to an isotropic thermal source with a temperature of MeV centered at an average rapidity of . The Pluto events were tracked through GEANT to account for the detector response and the geometrical decay topology. The GEANT output was embedded into experimental events to account for a proper track environment and, finally, passed through the entire analysis chain with the correction matrix taken from UrQMD simulation. Figure 4 shows the result for the rapidity distribution. Though the shapes of both simulations differ significantly, the initial shape of the phase-space distribution generated by Pluto is well recovered. Hence, we are convinced that our reconstruction method is based on solid grounds.
Furthermore, we note that the experimental distributions given below represent the average of two analyses from two independent groups Wendisch14 ; Arnold13 . The given systematic errors comprise the slight differences of the corresponding analysis results and those from a variation of the cut values given in Sect. 3.1 within reasonable limits (). The statistical errors are often smaller than the symbols displayed in the figures.
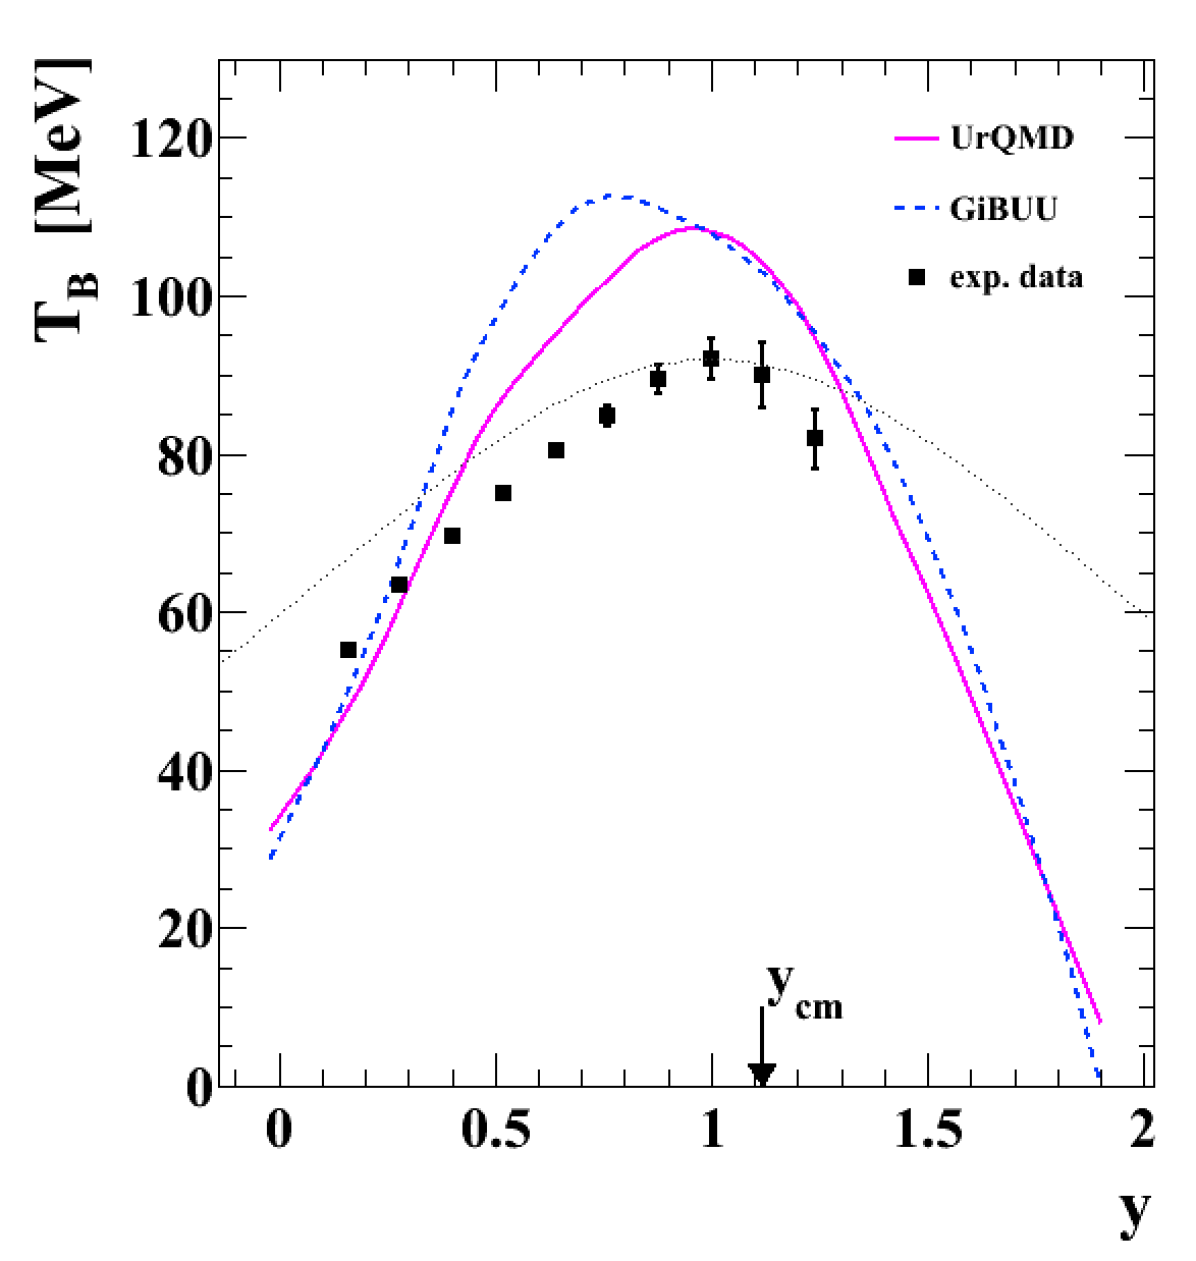
Figure 5 presents the dependence of the inverse (Boltzmann) slopes on rapidity, (with different transport model predictions overlaid, for discussion see Sect. 3.2.3). The error bars represent the uncertainties arising from the variations of the topological cuts to select the hyperons and of the borders of the Boltzmann fits applied to the () distributions displayed in Fig. 3 (7). We find slope parameters, i.e. apparent transverse temperatures, from 55 to 92 MeV with the maximum at a rapidity of , that is below the center-of-mass rapidity of the nucleon-nucleon reference system, . Note that in symmetric heavy-ion collisions, e.g. of Ar + KCl at 1.76 GeV (, HADES hades_Lambda_ArKCl ) and Ni + Ni at 1.93 GeV (, FOPI Merschmeyer07 ) at SIS18 or of Au+Au at 10.7 GeV at AGS (, E896 Albergo02 ), the rapidity dependence of the inverse slope parameter was found to follow well the thermal model prediction, i.e. a decline of the slope with increasing distance from mid-rapidity as . Corresponding mid-rapidity values , , and MeV have been reported in refs. hades_Lambda_ArKCl , Merschmeyer07 , and Albergo02 , respectively. Note that, in a recent analysis of meson production in our reaction, p (3.5 GeV) + Nb, we found a similar symmetric rapidity dependence of the inverse slope, which could be parametrized with the above dependence, however with the maximum located well below , i.e. hades_pion_eta_pNb . In contrast, the present rapidity dependence of the Boltzmann slope parameter for hyperons does not follow the isotropic thermal model prediction. Rather, it falls faster than , cf. dotted curve in Fig. 5.
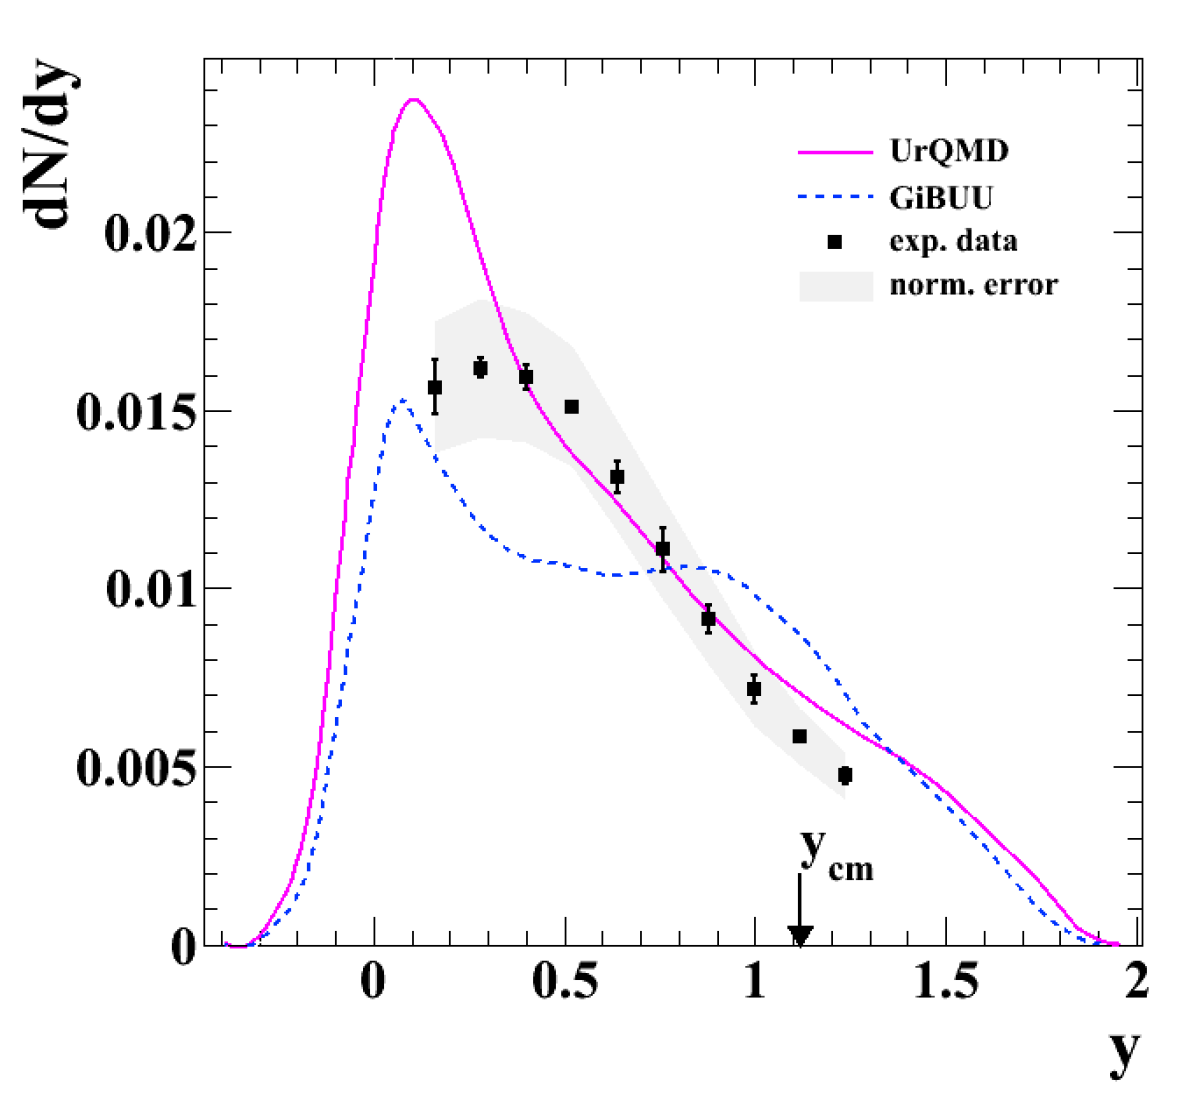
Integrating the two-dimensional phase-space distribution over transverse momentum, the rapidity-density distribution, , is derived. It is displayed in Fig. 6. Except for the first data point, the statistical errors are smaller than the symbols. The given error bars represent the systematic errors. The gray-shaded band displays the uncertainty of the absolute normalization of about 12 %. In contrast to symmetric heavy-ion collisions at comparable beam energies, where the rapidity distributions of secondary particles are symmetric around maxima at the center-of-mass rapidity of the nucleon-nucleon system Merschmeyer07 ; Justice98 ; hades_Lambda_ArKCl ; Albergo02 ; Ahmad96 ; Barrette00 , the present yield at rapidities of decreases monotonically with increasing rapidity. Unfortunately, the interesting region around target rapidity is not covered by the detector, due to its limiting upper polar angle, degrees. For comparison, we note that our pion and meson analyses in the same collision system, p (3.5 GeV) + Nb, showed Gaussian shaped rapidity distribution centered, however, at rapidities of about 0.95 hades_pion_eta_pNb , i.e. well below . Even slower emission sources () are estimated by KaoS for and production in p+Au collisions at 3.5 GeV Scheinast06 . It is worth to be noted that this observation is confirmed by our preliminary data on meson production in p+Nb exhibiting a rapidity density distribution centered around Lapidus13 .
Finally, we try to estimate the total production probability of hyperons. Since the shape of the experimental distribution at the acceptance limits is not precisely known, especially at large polar angles, i.e. around target rapidity, , this attempt is possible only in a model-dependent way. Since the distribution is declining almost linearly, we performed a straight-line fit to the data points and extrapolated the distribution for linearly. Similarly, the distribution at low rapidities, , is assumed to increase linearly from zero at to the first data point. The resulting total yield amounts to , where the error comprises both, experimental and systematic errors. With this extrapolation, about 20 % of the yield is outside of the experimentally accessible rapidity range. For comparison, our preliminary yield in p+Nb, as estimated from the integral of a Gaussian function fitted to the rapidity distribution Lapidus13 , amounts to . With the yield ratios of , , and taken from UrQMD, we find strangeness balance, i.e. the equality of the total number of and quarks, being nicely fulfilled on average.
3.2.2 Comparison with other data
Looking for other experimental results on production in pA collisions, no data could be found at beam energies below 9 GeV. The results next to ours are derived with the JINR Dubna 2 m propane bubble chamber for collisions of p+C at 10 GeV/c Aslanyan05 ; Aslanyan07 , i.e. already at an excess energy w.r.t. the threshold in NN collisions of GeV. The authors report a production probability of . The transverse momentum spectrum was found slightly harder than ours, as expected from the higher beam energy allowing for more energetic particles and hence larger transverse momenta. The rapidity distribution appeared asymmetric with the upper tail reaching to rapidities of 2.6. The maximum and mean values are located at about 0.8 and 1.0, respectively, i.e. both are well below the corresponding c.m. rapidity for NN collisions (), qualitatively similar to our observation (Fig. 6). Similar results have already been reported earlier in central collisions of carbon and oxygen at 4.5 GeV/c beam momentum per incident nucleon on different target nuclei, as measured with the 2 m streamer chamber SKM-200 at the Synchrophasotron in Dubna Anikina83 ; Anikina84 . Systematically increasing the target mass, the authors found a rapidity distribution which steadily became asymmetric and shifted towards target rapidity.
To be able to compare our production probability to the strange particle yields of another proton-nucleus experiment performed at the same beam energy but with different target nuclei, i.e. KaoS data on and production in p+C and p+Au collisions Scheinast06 , we normalize the yields to the number of participants, . Using a nuclear overlap (Glauber) model Eskola89 (with a Woods-Saxon density profile, an inelastic nucleon-nucleon cross section of mb, and an impact parameter range of fm), we get for p+Nb (p+Au). Hence, we derive for our system, p+Nb, a normalized yield being about 1.9 times larger than the yield per number of participants for p+Au collisions at the same beam energy Scheinast06 .
3.2.3 Transport model predictions
Two transport approaches are compared with the experimental data, i.e. the Ultra-relativistic Quantum Molecular Dynamics (UrQMD) model UrQMD1 ; UrQMD2 and the Giessen Boltzmann Uehling Uhlenbeck (GiBUU) model GiBUU ; Weil12 . For UrQMD111http://urqmd.org, we used code release version 3.3p1, while for GiBUU222https://gibuu.hepforge.org, we worked with release 1.6.6179 in real-particle mode (w/o mean-field baryon-baryon potential). In GiBUU, a threshold energy of GeV (default) steers, for baryon-baryon collisions, the smooth transition from the resonance model to the PYTHIA implementation (version 6.4.26).
The rapidity dependence of the inverse slope dependence presented in Fig. 5 is neither reproduced by the UrQMD nor by the GiBUU model. Both approaches significantly overestimate this transverse shape parameter of the phase-space distribution for most of the accessible rapidities.
In contrast, the rapidity density distribution, , presented in Fig. 6 is fairly well described by UrQMD, not only in shape but also on an absolute scale, over a large part of the experimentally accessible rapidity range, while GiBUU systematically underestimates (overestimates) the yield below (above) rapidities of and does not reproduce the shape. The strong yield around target rapidity visible in both models, however, can not be compared with experimental data due to acceptance limitations.
Inspecting the transverse-momentum distributions within rapidity slices, , as displayed on a linear scale in Fig. 7, one realizes that the highest predictive power of the transport models would result from the low transverse momenta, where, however, the detector acceptance often prevents reliable experimental data. For rapidities , both models exhibit spectra with shapes similar to those of the single-slope Maxwell-Boltzmann distributions fitted to the experimental data (dotted curves). In the target-rapidity range, however, the models show deviations from the one-slope shape, i.e. a superposition of differently hard spectra. The two main sources of these spectra are the contribution from first chance collisions yielding a rapidity spectrum centered around and the contribution from subsequent hyperon-nucleon (YN) collisions slowing down the ’s down to target rapidity, . This finding could be well established by inspecting the sub-processes governing the rapidity distributions generated with the models (cf. Fig. 6). Thus, increasing in GiBUU the YN cross sections by a factor of two the yield could be partially redistributed to lower rapidities leading to a stronger enhancement around target rapidity. However, neither the shape nor the absolute yield of the experimental rapidity distribution could be reproduced.
We tested the influence of the energy threshold at which GiBUU switches from the resonance model to PYTHIA in baryon-baryon collisions. Decreasing this threshold, hence increasing the operating range of PYTHIA, the inverse slope parameter derived from Boltzmann fits to the model distributions decreased (i.e. the spectra got softer) and the rapidity density increased, for all rapidities. E.g., for a threshold of 2.6 GeV (default value in release 1.5), from the simulation is throughout smaller than the experimental data with a maximum of 75 MeV at , while the yield increases roughly by an overall factor of 1.5. Apparently, in PYTHIA some elementary cross sections being relevant for production are larger than the corresponding ones implemented into the resonance model. For a threshold of 3.3 GeV, the average yield within the detector acceptance would match the experimental one. The shape of the experimental distribution, however, could not be reproduced, i.e. the model distribution falls slower with rapidity than the experimental one (cf. Fig. 6).
Finally, on an absolute scale, the UrQMD approach does a better job than the GiBUU model, since it largely reproduces the experimental transverse-momentum and rapidity-density distributions. The ongoing analysis of inclusive and production in pp collisions at the same kinetic beam energy of 3.5 GeV will provide cross section measurements of quite a number of elementary reaction channels (especially ) and perhaps even of new channels (e.g. channels involving or hades_pp_Sigma1385 ; hades_pp_Lambda1405 ) which may help to improve the resonance-model part of GiBUU.
3.3 Polarization
hyperons might be polarized perpendicularly to the production plane, i.e. a plane defined by the momentum vector of the beam and the momentum vector of the hyperon. The normal vector of that plane is defined as
| (2) |
The relevant angle to be studied is the angle between and the momentum vector of the decay proton in the rest frame (marked by an asterisk), i.e.
| (3) |
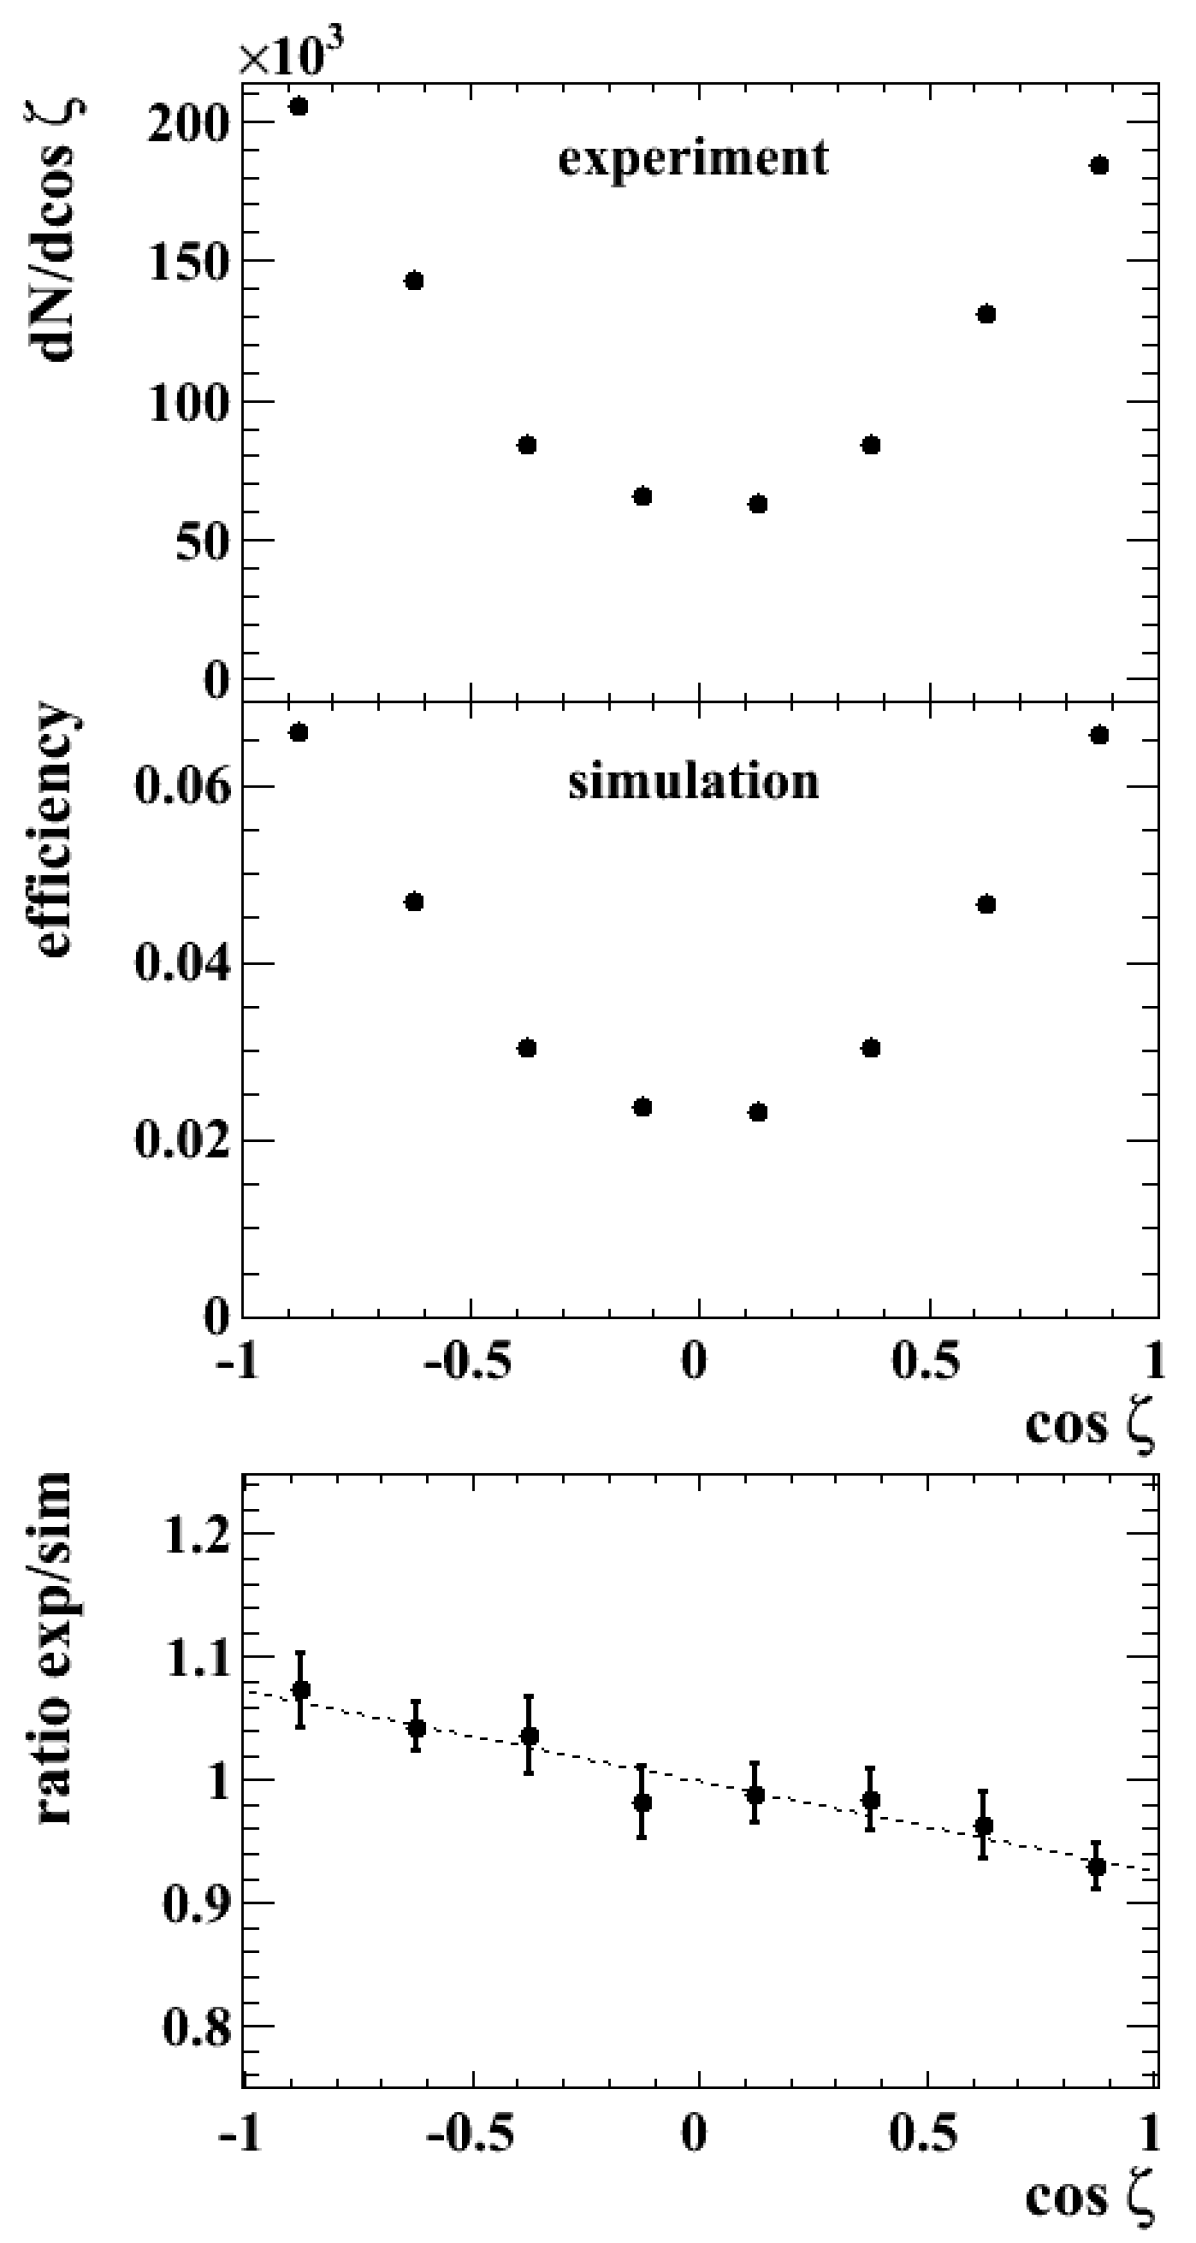
The corresponding experimental angular distribution is displayed in the upper panel of Fig. 8. It is derived similarly to the filling of the raw phase-space distribution of the , i.e. performing, for each angular bin , a combinatorial-background subtraction on the proton- invariant-mass distribution with subsequent -peak integration. The corresponding (polarization-free) UrQMD-simulated angular distribution is given in the middle panel of Fig. 8. The yield suppression around is the result of the detector acceptance. Both, the experimental and simulated, angular distributions exhibit a high degree of mirror symmetry w.r.t. the production plane. Since the statistics is copious, we extract the polarization by fitting a straight line
| (4) |
to the distribution of the corrected (experimental/simulation) angular distribution shown in the lower panel of Fig. 8. Note that in Eq. (4), the asymmetry parameter, , of the parity-violating weak decay of the hyperon is a measure of the interference between s and p waves of the final state PDG2012 . The polarization, averaged over the available phase space, is determined with different methods, thus allowing for a consistence check of the various analyses. Method (1) implies first the averaging over a set of phase-space distributions resulting from a reasonable, i.e. , variation of the topological cuts to select the candidates (cf. Sect. 3.1) and then one overall fit to the mean angular distribution. It delivers . Method (2) involves first individual angular fits (each for a certain geometrical cut setting) yielding a variety of polarization numbers and then an average (i.e. weighted with the proper yield) over this set of fit results. Here, we get , in agreement with the value derived with method (1). In both cases, statistical and systematic errors are given, where the latter ones include the variations of the topological cuts and of the fit ranges applied to the p- invariant-mass distributions. Finally, method (3) makes use of the mirror symmetry mentioned above. Though it is possibly not fully met due to slight acceptance differences at the detector edges of experiment and simulation, it can be used to determine the polarization by simply integrating the corrected angular distribution over the positive (Up) and negative (Down) cosine of the angle , i.e.
| (5) |
(Another, equivalent, approach to the polarization is based on the relation , where the angle brackets imply the average over the entire angular range and all events.) The corresponding overall polarization derived with Eq. (5) amounts to , in agreement with the values derived with the linear fit. The mean value following from the various methods amounts to with the given statistical and systematic errors. For the differential polarization investigated in the following, the linear fit with Eq. (4) is used, and the systematic errors are accounted for by method (1).
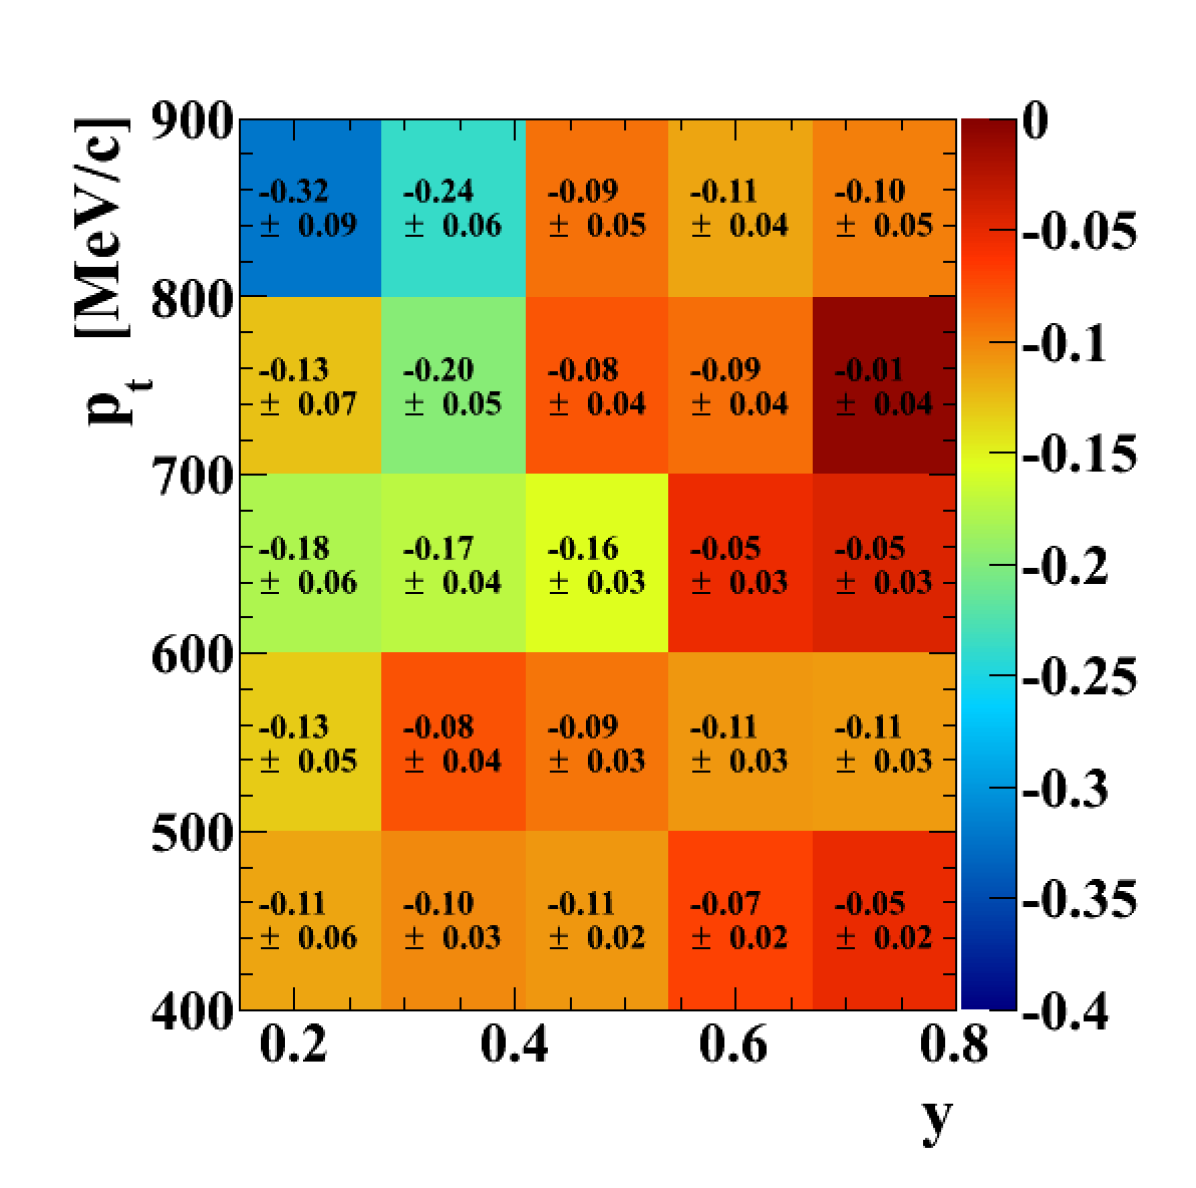
Now, we study the phase-space dependence of the polarization. Figure 9 shows the polarization as a function of rapidity and transverse momentum, . Note that, for this (quasi triple-differential) figure, sixteen hundred invariant-mass distributions of proton- pairs have been analyzed (i.e., 8 topological cut sets, 8 bins, 5 bins, 5 bins). We exclusively observe negative central polarizations values over the entire phase space displayed. Even when incorporating the given errors, this finding keeps almost unchanged. Though the statistics is copious, the absolute value of the polarization is somewhat fluctuating, i.e. it shows differences between the central values determined in neighbouring phase-space cells. Typically, these deviations of the polarization values from the average trends in slices of rapidity or transverse momentum (determined, e.g., by linear regression), are well within the errors. A clear tendency from the lower right to the upper left corner is found: The polarization is strongest at low rapidities and large transverse momenta. Its absolute value increases with transverse momentum for the two lowest rapidity bins while it is almost independent of within the remaining region; and it decreases with rapidity for the three upper transverse-momentum bins while it hardly changes with rapidity for the two low- bins.
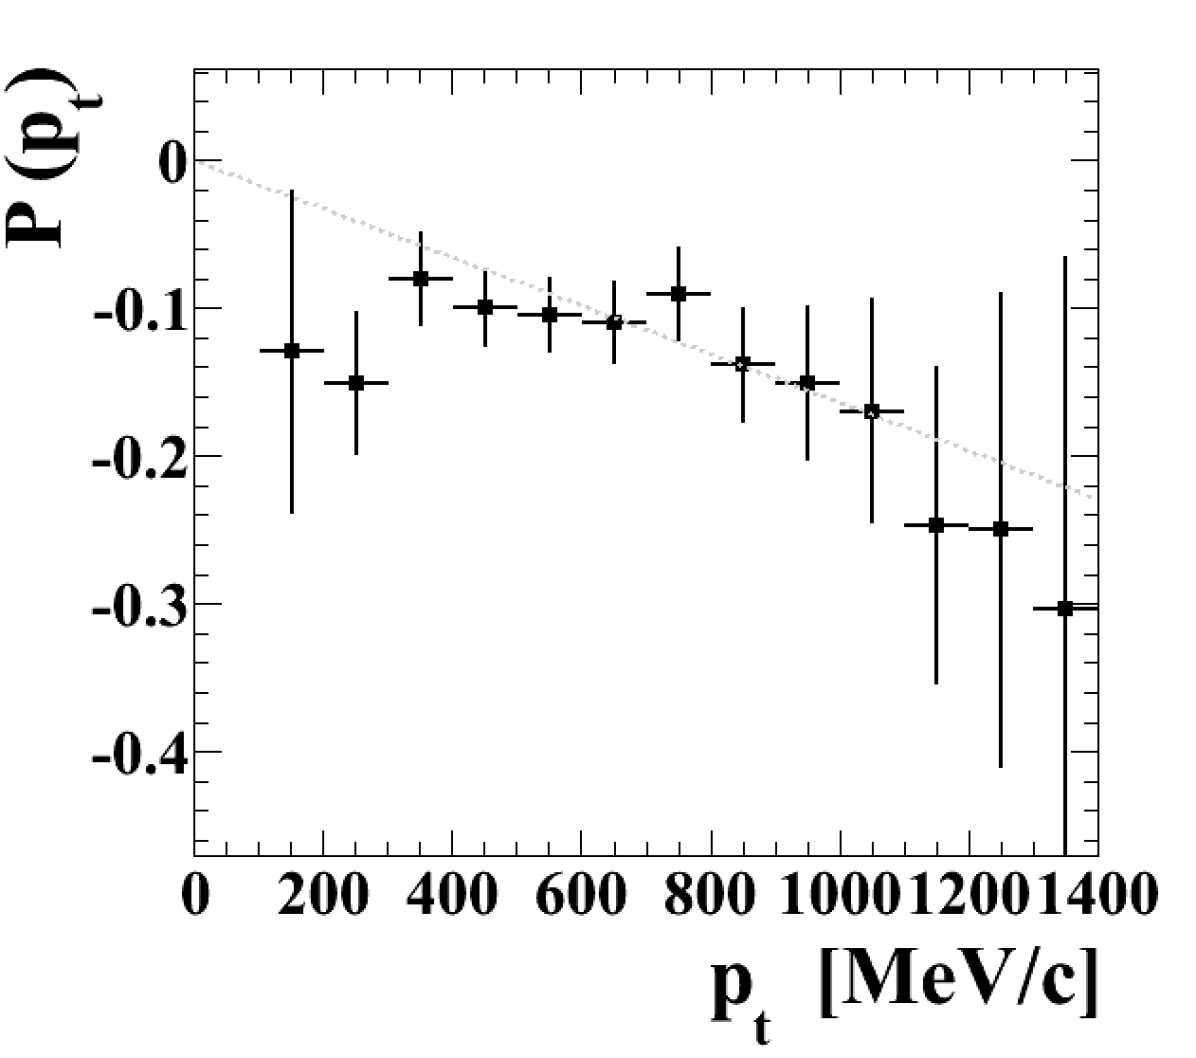
To make this finding more obvious, we studied the one-dimensional dependences. For that reason, we included also the regions outside the sharp upper and lower rapidity and transverse-momentum limits of Fig. 9 which were applied for statistical reasons. Integrating over all experimentally populated rapidities, Fig. 10 shows the dependence of the polarization on the transverse momentum. Its absolute value clearly increases with . The dotted line is a linear fit to the data with the simplest formula ensuring a vanishing polarization at zero transverse momentum, i.e. . The corresponding slope amounts to (GeV/c)-1. Looking for phase-space dependences of earlier measurements one realizes that, because of the fixed production angle in most of the high-energy experiments, a definite Feynman- value corresponds to a certain transverse momentum. Hence, there the dependence of the polarization reflects both - and -dependences. Nevertheless, our slope is well in between the slopes of about -0.05 to -0.30 (GeV/c)-1 found for pN-reactions at energies from 400 to 800 GeV and presented in the compilation of ref. Fanti99 .
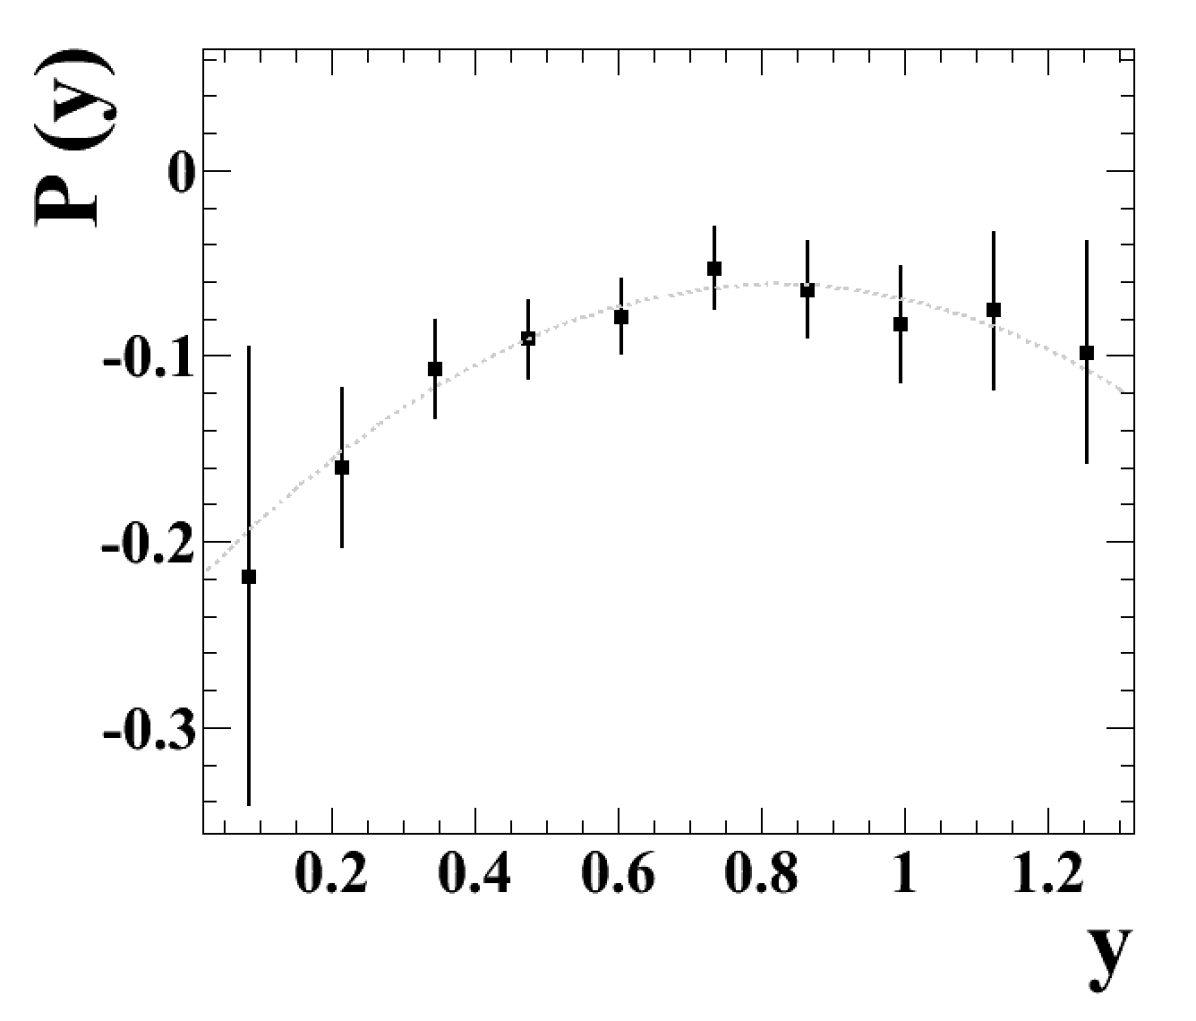
Integrating instead over all experimentally accessible transverse momenta, Fig. 11 gives the rapidity dependence of the polarization, . Its absolute value is smallest at an intermediate rapidity, , as derived from a parabolic fit (dotted curve) to the experimental data, and increases weakly both with decreasing and increasing rapidity, whereby the behaviour at the upper rapidities is compatible with a constant polarization. It is worth to recall that polarization in pp collisions is odd in (or (-)) with negative (positive) sign in the beam (target) fragmentation region Felix96 ; Choi98 ; Roeder12 . In the present experiment, however, the hyperons carry exclusively negative polarizations while they populate mostly the target hemisphere (Fig. 6). Hence, the number of ’s arising from primary (first chance) pN collisions is negligible, and the polarization we see at low rapidities is supposed to come from ’s which have scattered, which are produced by slowed-down beam protons, or which are produced by “unwounded” protons on a cluster of many nucleons from the target.
4 Summary
Summarizing, we presented high-statistics data on production and polarization of hyperons produced in collisions of p (3.5 GeV) + Nb. The data were taken with HADES at SIS18/GSI. The phase-space distribution was compared with corresponding results of other experiments and with transport model predictions. The rapidity density was found to decrease monotonically within a rapidity window ranging from 0.3 to 1.3, i.e. from values above the target rapidity to values beyond the center-of-mass rapidity for nucleon-nucleon collisions. None of the employed models was able to reproduce fully the experimental distributions, i.e. in absolute yield and in shape. We link this observation to an insufficient modelling in the transport approaches of the elementary processes being relevant for production, rescattering and absorption. For the first time, the data allow for a genuine two-dimensional investigation of the polarization as a function of the large phase space covered by HADES. We found finite negative values of the polarization in the order of over the entire phase space with its magnitude increasing almost linearly with increasing transverse momentum for MeV/c, (GeV/c), and increasing with decreasing rapidity for . The average polarization amounts to . Assuming that the polarization origins from interactions of the primary beam protons with target nucleons, the surprise is the survival of the spin orientation in subsequent rescattering processes until kinetic freeze-out. Even if the hyperons are not produced in primary (first chance) collisions, they carry the information on the beam projectile.
Acknowledgements.
Useful conversations with W. Eyrich, J. L. Ritman and E. Roderburg on polarization measurements are gratefully acknowledged. The HADES collaboration acknowledges the support by BMBF grants 05P09CRFTE, 05P12CRGHE, 06FY171, 06MT238 T5, and 06MT9156 TP5, by HGF VH-NG-330, by DFG EClust 153, by GSI TMKRUE, by the Hessian LOEWE initiative through HIC for FAIR (Germany), by EMMI (GSI), by grant GA CR 13-067595 (Czech Rep.), by grant NN202198639 (Poland), by grant UCY-10.3.11.12 (Cyprus), by CNRS/IN2P3 (France), by INFN (Italy), and by EU contracts RII3-CT-2005-515876 and HP2 227431.References
- (1) Ch. Hartnack, H. Oeschler, Y. Leifels, E. L. Bratkovskaya, J. Aichelin, Phys. Rept. 510, 119 (2012).
- (2) O. Buss, T. Gaitanos, K. Gallmeister, H. van Hees, M. Kaskulov, O. Lalakulich, A. B. Larionov, T. Leitner, J. Weil, U. Mosel, Phys. Rept. 512, 1 (2012).
- (3) C. Fuchs, Progr. Part. Nucl. Phys. 53, 113 (2004).
- (4) B. Friman et al., The CBM Physics Book, Lect. Notes Phys. 814, 1 (2011).
- (5) P. Senger and H. Ströbele, J. Phys. G: Nucl. Part. Phys. 25, R59 (1999).
- (6) C. Sturm et al. (KaoS collaboration), Phys. Rev. Lett. 86, 39 (2001).
- (7) C. Fuchs, A. Faessler, E. Zabrodin, Y. Zheng, Phys. Rev. Lett. 86, 1974 (2001).
- (8) Ch. Hartnack, H. Oeschler, and J. Aichelin, Phys. Rev. Lett. 96, 012302 (2006).
- (9) J. Aichelin and C. M. Ko, Phys. Rev. Lett. 55, 2661 (1985).
- (10) G. Q. Li and C. M. Ko, Phys. Lett. B 349, 405 (1995).
- (11) G. Q. Li and G. E. Brown, Phys. Rev. C 58, 1698 (1998).
- (12) W. Cassing, E. L. Bratkovskaya, Phys. Rep. 308, 65 (1999).
- (13) K. Wisniewski et al. (FOPI collaboration), Eur. Phys. J. A 9, 515 (2000).
- (14) A. Förster et al. (KaoS collaboration), Phys. Rev. Lett. 91, 152301 (2003).
- (15) M. Merschmeyer et al. (FOPI collaboration), Phys. Rev. C 76, 024906 (2007).
- (16) A. Förster et al. (KaoS collaboration), Phys. Rev. C 75, 024906 (2007).
- (17) M. L. Benabderrahmane et al. (FOPI collaboration), Phys. Rev. Lett. 102, 182501 (2009).
- (18) G. Agakishiev et al. (HADES collaboration), Phys. Rev. C 82, 044907 (2010).
- (19) P. Crochet et al. (FOPI collaboration), Phys. Lett. B 486, 6 (2000).
- (20) F. Uhlig et al. (KaoS collaboration), Phys. Rev. Lett. 95, 012301 (2005).
- (21) Y. Leifels (FOPI collaboration), J. Phys. G: Conf. Ser. 230, 012002 (2010).
- (22) G. Q. Li and C. M. Ko, Phys. Rev. C 54, 1897 (1996).
- (23) G. Q. Li, G. E. Brown, Nucl. Phys. A 636, 487 (1998).
- (24) Z. S. Wang, A. Faessler, C. Fuchs, T. Gross-Boelting, Nucl. Phys. A 645, 177 (1999).
- (25) J. L. Ritman et al. (FOPI collaboration), Z. Phys. A 352, 355 (1995).
- (26) M. Justice et al. (EOS collaboration), Phys. Lett. B 440, 12 (1998).
- (27) G. Agakishiev et al. (HADES collaboration), Eur. Phys. J. A 47, 21 (2011).
- (28) W. Scheinast et al. (KaoS Collaboration), Phys. Rev. Lett. 96, 072301 (2006).
- (29) G. Bunce et al., Phys. Rev. Lett. 36, 1113 (1976).
- (30) K. Heller, O. E. Overseth, G. Bunce, F. Dydak, H. Taureg, Phys. Lett. 68B, 480 (1977).
- (31) K. Heller et al., Phys. Rev. Lett. 41, 607 (1978).
- (32) F. Lomanno, D. Jensen, M. N. Kreisler, R. Poster, J. Humphrey, Phys. Rev. Lett. 43, 1905 (1979).
- (33) F. Abe et al., Phys. Rev. Lett. 50, 1102 (1983).
- (34) A. M. Smith et al., Phys. Lett. B 185, 209 (1987).
- (35) B. E. Bonner et al., Phys. Rev. D 38, 729 (1988).
- (36) V. Fanti et al. (NA48 collaboration), Eur. Phys. J. C 6, 265 (1999).
- (37) B. Lundberg et al., Phys. Rev. D 40, 3557 (1989).
- (38) J. Felix et al. (E766 collaboration), Phys. Rev. Lett. 76, 22 (1996).
- (39) J. Felix et al. (E766 collaboration), Phys. Rev. Lett. 82, 5213 (1999).
- (40) R. Bellwied (for the E896 collaboration), Heavy Ion Physics 15, 437 (2002).
- (41) M. I. Adamovich et al. (WA49 collaboration), Eur. Phys. J. C 32, 221 (2004).
- (42) A. Airapetian et al. (HERMES collaboration), Phys. Rev. D 76, 092008 (2007).
- (43) S. Choi (for the DISTO collaboration), Nucl. Phys. A 639, 1c (1998).
- (44) F. Balestra et al. (DISTO collaboration), Phys. Rev. Lett. 83, 1534 (1999).
- (45) C. Pizzolotto, PhD thesis, Friedrich-Alexander-Universität Erlangen-Nürnberg (2007).
- (46) M. Röder, PhD thesis, Ruhr-Universität Bochum (2011).
- (47) M. Röder and J. Ritman (for the COSY-TOF collaboration), EPJ Web of Conferences 37, 01008 (2012).
- (48) J. W. Harris, A. Sandoval, R. Stock, H. Stroebele, R. E. Renfordt, J. V. Geaga, H. G. Pugh, L. S. Schroeder, K. L. Wolf, A. Dacal, Phys. Rev. Lett. 47, 229 (1981).
- (49) J. Felix, Mod. Phys. Lett. 14, 827 (1999).
- (50) H.-W. Siebert, Eur. Phys. J. Special Topics 162, 147 (2008).
- (51) S. B. Nurushev, M. F. Runtso, M. N. Strikhanov, Lect. Notes. Phys. 859, 343 (2013).
- (52) B. Andersson, G. Gustafson, and G. Ingelman, Phys. Lett. B 85, 417 (1979).
- (53) Th. A. DeGrand and H. U. Miettinen, Phys. Rev. D 24, 2419 (1981).
- (54) L. Zuo-tang and C. Boros, Phys. Rev. Lett. 79, 3608 (1997).
- (55) D. Hui and L. Zuo-tang, Phys. Rev. D 70, 014019 (2004).
- (56) Y. Yamamoto,K. Kubo, and H. Toki, Prog. Theor. Phys. 98, 95 (1997).
- (57) K. Kubo, Y. Yamamoto, and H. Toki, Prog. Theor. Phys. 101, 615 (1999).
- (58) J. M. Laget, Phys. Lett. B 259, 24 (1991).
- (59) J. Soffer and N. A. Törnqvist, Phys. Rev. Lett. 68, 907 (1992).
- (60) A. Sibirtsev and W. Cassing, e-Print: nucl-th/9802019 (1998).
- (61) A. M. Gasparian, J. Haidenbauer, C. Hanhart, L. Kondratyuk, J. Speth, Nucl. Phys. A 684, 397 (2001).
- (62) A. Sibirtsev, J. Haidenbauer, H.-W. Hammer, and S. Krewald, Eur. Phys. J. A 27, 269 (2006).
- (63) G. Agakichiev et al. (HADES collaboration), Eur. Phys. J. A 41, 243 (2009).
- (64) G. Agakichiev et al. (HADES collaboration), Phys. Rev. Lett. 98, 052302 (2007).
- (65) A. Schmah, PhD thesis, Techn. Universität Darmstadt (2008).
- (66) G. Agakishiev et al. (HADES collaboration), Phys. Rev. C 80, 025209 (2009).
- (67) G. Agakishiev et al. (HADES collaboration), Phys. Rev. Lett. 103, 132301 (2009).
- (68) G. Agakishiev et al. (HADES collaboration), Phys. Lett. B 715, 304 (2012).
- (69) G. Agakishiev et al. (HADES collaboration), Phys. Rev. C 88, 024904 (2013).
- (70) P. Tlusty et al. (HADES collaboration), Proc. 50th Int. Winter Meeting on Nucl. Phys., Bormio (Italy) 2012, Proceedings of Science, PoS(Bormio2012)019.
- (71) J. Beringer et al., (Particle Data Group), Phys. Rev. D 86, 010001 (2012).
- (72) E. Dukes et al., Phys. Lett. B 193, 135 (1987).
- (73) S. A. Bass et al., Prog. Part. Nucl. Phys. 41, 255 (1998).
- (74) M. Bleicher et al., J. Phys. G 25, 1859 (1999).
- (75) GEANT 3.21, http://consult.cern.ch/writeup/geant/ (1993).
- (76) I. Fröhlich et al., Proceedings of Science, PoS(ACAT)076 (2007).
- (77) C. Wendisch, PhD thesis, Techn. Universität Dresden (2014).
- (78) O. Arnold, Diploma thesis, Techn. Universität München (2013).
- (79) S. Albergo et al. (E896 collaboration), Phys. Rev. Lett. 88, 062301 (2002).
- (80) S. Ahmad et al. (E891 collaboration), Phys. Lett. B 382, 35 (1996).
- (81) J. Barrette et al. (E877 collaboration), Phys. Rev. C 63, 014902 (2000).
- (82) K. Lapidus, Proc. “FAIRNESS 2013”, 16-21 Sep 2013, Berlin, Germany, J. Phys.: Conf. Ser., in print.
- (83) P. Zh. Aslanyan, AIP Conf. Proc. 796, 184 (2005).
- (84) P. Zh. Aslanyan, V. N. Emelyanenko, G. G. Rikhkvitzkaya, Phys. Part. Nucl. Lett. 4, 60 (2007).
- (85) M. Anikina et al., Phys. Rev. Lett. 50, 1971 (1983).
- (86) M. Anikina et al., Z. Phys. C 25, 1 (1984).
- (87) K. J. Eskola, K. Kajantie, J. Lindfors, Nucl. Phys. B 323, 37 (1989).
- (88) J. Weil, H. van Hees, and U. Mosel, Eur. Phys. J. A 48, 111 (2012).
- (89) G. Agakishiev et al. (HADES collaboration), Phys. Rev. C 85, 035203 (2012).
- (90) G. Agakishiev et al. (HADES collaboration), Phys. Rev. C 87, 025201 (2013).