A kinematic study of energy barriers to crack formation in graphene tilt boundaries
Abstract
Recent experimental studies have observed a surprisingly wide range of strengths in polycrystalline graphene. Previous computational investigations of graphene tilt boundaries have highlighted the role of interfacial topology in determining mechanical properties. However, a rigorous characterization of deformation energy barriers is lacking, which precludes direct comparison to the available experimental data. In the current study, molecular dynamics tensile studies are performed to quantify kinematic effects on failure initiation in a wide range of graphene tilt boundaries. Specifically, the process of crack formation is investigated to provide a conservative estimate of strength at experimental loading rates.
Contrary to previous studies, significant strain rate sensitivity is observed, resulting in reductions of
crack formation stresses on the order of 7 to 33%. Activation energies
of crack formation are calculated in the range of 0.58 to 2.07 eV based
on an Arrhenius relation that is fit to the collected simulation data. Physically, the magnitude of activation energies in graphene tilt boundaries are found to be linearly correlated to the
pre-stress found at the critical bonds in graphene tilt boundaries.
Predictions reported in the present study provide a possible explanation for the wide range of strengths experimentally observed in polycrystalline graphene and greatly improve upon current theoretical estimates.
This article has been published in Journal of Applied Physics 115 22, 223513. doi:10.1063/1.4883190
I Introduction
With an intrinsic strength reported at above 100 GPa Lee2008 , graphene permits access to previously uncharted areas of material-property space making it a desirable material for a number of composite applicationsStankovich2006 . Efforts to increase manufacturing yield have resulted in the synthesis of polycrystalline grapheneLi2009 , with tilt boundaries separating misoriented crystallographic domainsKim2011a . The impact of such tilt boundaries on mechanical properties is currently an area of extreme research fervor, with experimental reports of polycrystalline strength ranging from as low as 35 GPa Ruiz-Vargas2011 to near pristine values of 98.5 GPa Lee2013 . Weakening of polycrystalline graphene has previously been suggested as a result of high porosity in the graphene samplesLee2013 . A recent atomic force microscopy investigation of high quality graphene bicrystals, however, has reported a wide strength envelope, with breaking stresses encompassing approximately the entire range observed in the previous studies (48 to 83 GPa)Rasool2013 . The phenomena underpinning strength in polycrystalline graphene may therefore be more complicated than sample quality considerations and merits further investigation.
Tilt boundaries in graphene are known to be populated by topological defectsAn2011 ; Kim2011a ; Huang2011a ; Yakobson2011b . On the atomic scale, topological defects take the form of a periodic arrangement of heptagon-pentagon disclination dipole clusters Yazyev2010 ; Grantab2010 ; Wei2012 . The density and periodicity of such defect tilings is dictated by the tessellation requirements of adjacent grains. Therefore, the tilt angle between graphene crystals determines the spacing of disclination clusters and the specific structure of the grain boundary. Relative to 3D structures, planar defects such as grain boundaries possess a greater influence on the properties of low dimensional materials. In 2D systems, a planar defect may be considered as a flaw transcending the entire thickness of a graphene sheet. It is therefore expected that the strength of polycrystalline graphene is strongly related to the interfacial configuration connecting adjacent graphene grains. Given the large range of strengths reported in existing experimental studies, a rigorous study of the strength limiting features of tilt boundaries in polycrystalline graphene is therefore required to understand the physical phenomena underscoring weakening.
The nature of weakening in polycrystalline graphene as it relates to tilt angle and topological structure has been examined in a number of theoretical investigations Cao2013 ; Cao2012b ; Cao2012 ; Zhang2012 ; Wei2012 ; Song2013 ; Kotakoski2012 ; Zhang2013a ; Yi2013 ; Grantab2010 ; Jhon2012 . Notable athermal molecular dynamics (MD) studies have identified defect-saturated high angle boundaries as possessing both the lowest interfacial energies and the greatest strength Grantab2010 ; Wei2012 , supporting recent experimental characterization Lee2013 ; Rasool2013 . The effects of temperature on the fracture behavior of graphene tilt boundaries have also been investigated briefly in theoretical studiesZhang2013a ; Kotakoski2012 ; Song2013 ; Jhon2012 ; Zhang2012 ; Cao2012 ; Yi2013 , with results being qualitatively comparable to the available athermal computational investigations. Although these numerical studies have proven successful in establishing trends in mechanical properties, the vast majority of these investigations are restricted to high strain rates in a relatively narrow loading rangeYi2013 ; Cao2012b , which may inflate strength predictions and underestimate the impact of kinematic effects. For instance, Yi et al.Yi2013 performed uniaxial MD tensile simulations on a number of graphene tilt boundaries at strain rates ranging from to /s. In this study, the authors report strain rate insensitivity with respect to strength which may be a consequence of the relatively small range of strain rates tested. Since large interfacial stresses have been observed in many of the sampled tilt boundary configurations Wei2012 , it is likely that kinematic effects become significant at strain rates more representative of experimental conditions (e.g. at 10/sRasool2013 ). From a time-scale perspective, quantification of deformation energy barriers in graphene tilt boundaries is therefore necessary to accurately capture strain rate sensitivity. To the authors’ knowledge, analysis of deformation energy barriers in polycrystalline graphene is limited to a preliminary investigation of tilted graphene bicrystals Cao2012b , with strengths of 125 GPa predicted under quasi-static loading conditions. However, current experimental reports suggest an upper limit of approximately 98.5 GPa for polycrystalline grapheneLee2013 , which indicates that kinematic effects are not fully captured by this computational study, rendering these strength predictions less accurate at experimental time-scales. A comprehensive characterization of the deformation activation energies in graphene tilt boundaries is therefore warranted to quantify the energy barrier resisting material fracture and inform reasonable predictions of strength.
The purpose of the current work is to perform a comparative analysis of kinematic effects on failure initiation over a wide range of graphene tilt boundaries. Specifically, the activation energy of the initial bond-breakage event as it relates to crack formation is selected for study. As failure in graphene is considered to be brittle in natureBooth2008 , the crack formation stress is assumed to provide a conservative estimate of strength. In order to capture the probabilistic nature of the strength in polycrystalline graphene, an in-depth statistical study of critical stresses to crack formation is performed. Both lower and higher energy grain boundaries are studied in order to sample a wide range of tilt angles. Results of this study may serve to reconcile the wide strength ranges observed in experimental testing and improve the accuracy of numerical simulations.
II Computational methods
MD simulations are conducted using the freely available Large-scale Atomic/Molecular Massively Parallel Simulator (LAMMPS)Plimpton1995 . The Adaptive Intermolecular Reactive Empirical Bond Order (AIREBO) interatomic potential with a bond cutoff radius of 1.92 ÅAkdim2011 is used for all MD simulations. In the current work, six different graphene tilt boundaries are investigated and their relevant structural properties are summarized in Table 1. For the purposes of comparison, tilt angles reported in previous numericalGrantab2010 ; Wei2012 ; Yi2013 ; Cao2012b and experimental studiesLee2013 ; Rasool2013 are chosen for investigation. The selected tilt boundaries are characterized using coincidence site lattice theory (CSL), following the topology construction methodology and boundary classification system outlined in Ref. Carlsson2011b, . Using the nomenclature of Grantab et al.Grantab2010 and Yazyev and LouieYazyev2010 , tilt boundaries may be further categorized into zigzag and armchair groups with the former constructed of (1,0) and the latter with (1,0)+(0,1) disclination dipole defects. Disclination clusters are periodically spaced over a distance as required for tessellation. Figure 1 provides schematics of (1,0) and (1,0)+(0,1) disclination clusters. For the purposes of the current work, graphene tilt boundaries are referenced with respect to the CSL parameter, . Zigzag oriented boundaries with a tilt angle of may be described in terms of the armchair lattice angles () by the relation: . Figure 2 provides the topologies of graphene tilt boundaries selected for study. As shown in the figure, athermal atomic potential energies increase in the vicinity of the disclination clusters and are consistent with previous reports Wei2012 .
A schematic of a typical graphene tilt boundary supercell used in MD studies is provided in Figure 1. Two anti-symmetric grain boundaries are constructed to enforce periodic boundary conditions and avoid unwanted stress concentration along the supercell boundaries. Uniaxial loading is applied perpendicular to the defect line and the simulation supercell is allowed to contract in the longitudinal direction to accommodate Poisson effects. This loading configuration is selected in order to provide the most conservative configuration for mechanical results. Based on previous studies, fracture is expected to originate along the disclination cluster line Yi2013 ; Wei2012 , with each dipole acting as a potential failure nucleation site. The longitudinal dimensions of the supercell are therefore selected to maintain a constant number of failure initiation sites across each of the examined tilt boundaries. All tilt boundary samples possess at least 8000 atoms. Strain-controlled uniaxial tensile simulations are performed using the isothermal-isobaric (NPT) ensemble available in LAMMPS. Prior to tensile loading, a relaxation step is programmed to ensure a minimum system energy and to stabilize the global temperature (T). Stress is calculated as the spatial and temporal average of the combined per atom virial and thermal components and the thickness of the graphene plane is assumed to be 3.35 Å Lee2008 . For the purposes of energy barrier calculations and strain rate sensitivity analysis, MD simulations are conducted over a large span of loading rates. Tensile studies are undertaken in the range of 5x10 to 10/s, which provides a much wider sampling of kinematic effects than previously accessed by computational studies of graphene tilt boundaries. Statistical replication of each simulation condition is achieved using the Gaussian random seed method and all simulations are conducted with a timestep of 1 fs. Visualization of atomic topologies is achieved using the AtomEye atomistic configuration viewerLi2003a .
III Energy barrier analysis of crack formation
Energy barriers resisting failure initiation may be quantitatively sampled through measurement of global loading conditions at the instant of bond-breakage and subsequent crack formation. Since graphene is known to exhibit brittle fractureBooth2008 , taking the crack formation event as strength limiting permits a conservative estimate for the bounds on graphene strength. In all MD simulations, material failure is observed to initiate along the defect line at a disclination cluster. Figure 3 presents typical topologies in zigzag and armchair oriented tilt boundaries at the instant of crack formation. Crack formation may be identified by monitoring the atomic coordination of critical bonds. In most simulations, cracks nucleate along the bond shared between the heptagon-hexagon carbon rings. In some simulations of zigzag oriented tilt boundaries, however, failure initiates from the heptagon-pentagon bond. Given the relatively small statistical scatter in each tested simulation condition, the kinematics surrounding these deformation events are expected to be quantitatively similar.
Using the thermal activation theory of EyringHalsey1945 , the Arrhenius relationship may be used to describe the lifetime of a specimen as a function of loading and temperature T by the relation:
| (1) |
where is related to the vibrational frequency of crystalline oscillations, is the number of sites available for thermal activation, is the athermal activation energy of the deformation event, is the activation volume, and is the Boltzmann constant. Following the analytical formulation provided by Zhao and AluruZhao2010 , Eq. (1) may be used in combination with Bailey’s principleBailey1939 to provide unique equations for the expectation time () and stress of crack formation () as functions of and T. In order to reconcile strain rate sensitivity with this analytical approach, an additional constitutive relation for the time dependent applied stress (i.e. ) is required. The non-linear elastic response of graphene may be accurately represented by a logarithmic function of the form:
| (2) |
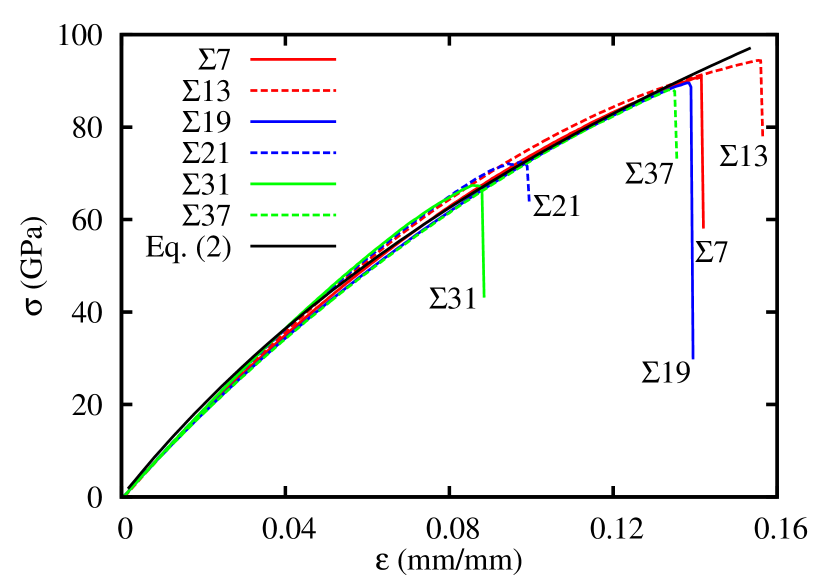
Representative MD tensile simulations of each graphene tilt boundary are provided in Figure 4. All tilt boundaries exhibit a similar mechanical response and therefore only a singular form of Eq. (2) is required to capture the non-linear elastic behavior of each grain boundary. A least squares fit to the collected data yields a = 93.25 GPa and b = 11.94. Eq. (2) can be shown to reduce to a linear relation of Zhao2010 , where = 1.11 TPa, which is approximately equal to the experimentally measured in-plane modulus of 1.02 TPa Lee2008 . If t = t then the crack formation stress may be defined as . As per Ref. Zhao2010, substitution of Eq. (2) and (1) into the Bailey criterion with t = t provides a unique expression for of the form:
| (3) |
The expectation time of crack formation may then be defined as:
| (4) |
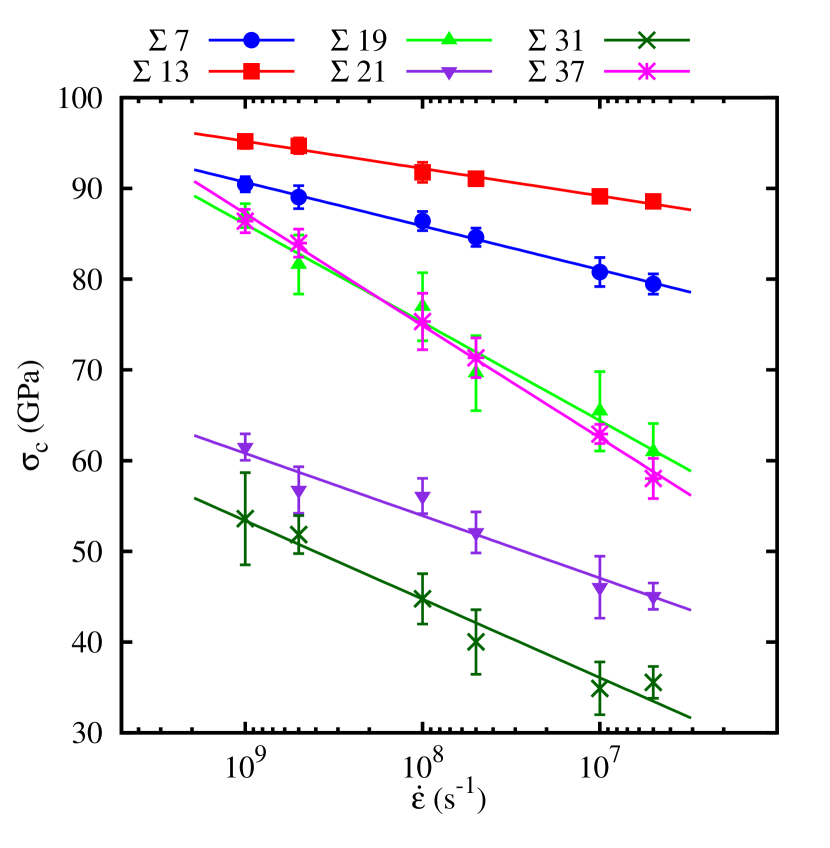
Application of Eqs. (3) and (4) permits direct analysis of the energy barrier to crack formation. However, before the presented Arrhenius formulation is applied to the tilted graphene samples, MD simulation results should be validated against existing experimental data to provide confidence in methodology. Energy barrier analysis of pristine graphene using the experimentally determined in-plane bond dissociation energy (4.93 eV Brenner2002 ) of graphite results in excellent agreement with MD data. Further details of the kinematic study of pristine graphene are provided as supplementary datasupp . The collected crack formation stresses for the graphene tilt boundary samples at T = 300 K are provided in Figure 5, with error bars representing 95% confidence. Each of the sampled tilt boundaries are found to exhibit some degree of strain rate sensitivity. The smallest reductions in crack formation stress are observed in the 13 tilt boundary whereas the largest reductions occur in the 31 samples. These extrema of strain rate sensitivity represent reductions ranging from 7% to 33% over the approximately four orders of magnitude of sampled loading rates. These results suggest that in some cases graphene can exhibit a significant degree of strain rate sensitivity and seem to contradict previous reports declaring the insensitivity of polycrystalline grapheneYi2013 .
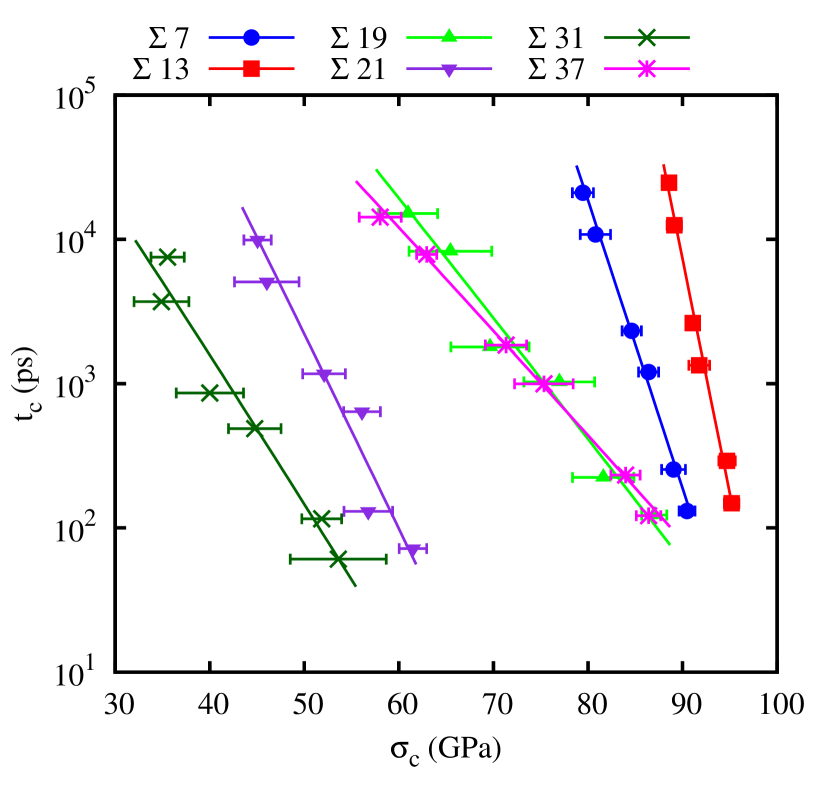
The collected MD data presented in Figure 5 is fit to Eq. (3) in order to determine the activation energies of crack formation. The fitted activation energies and volumes are then applied to Eq. (3) and overlaid with the collected crack formation stresses, showing excellent correlation with the MD data. In all fitting of tilt boundary data = 100, and = 0.1 psZhurkov1965 . Activation energies are found to follow a similar trend to strain rate sensitivities and range from 0.58 ( 31) to 2.07 eV ( 13). Activation volumes are found to be in the range of 1-3Å which is approximately the size of a sp covalent bond. The expectation time may be also evaluated using Eq. (4) from the activation energies obtained from Eq. (3). Figure 6 provides the predicted expectation times for crack formation as a function of critical stress for each tilt boundary. Agreement with the collected MD data is good, providing confidence in the activation energies obtained from Eq. (3) and the validity of the presented energy barrier formulation. In order to validate the robustness of the analytical formulation with respect to temperature variations, a parallel energy barrier analysis of the 7 boundary at T = 450 K is performed using and obtained from fitting the data in Figure 5. The results of this comparative analysis show excellent agreement across both thermal conditions and are provided in the supplementary materialsupp .
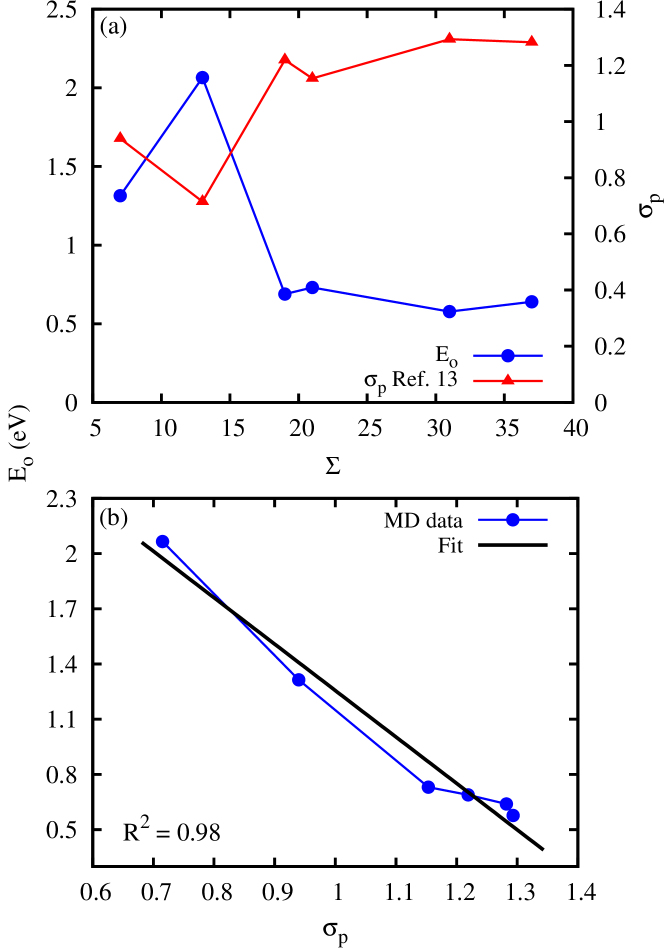
In order to establish a physical rationale for trends in the calculated activation energies, the pre-stress arising from tessellation mismatches in the interfacial structures of the sampled tilted boundaries is considered. Examination of relaxed interfacial topologies shows that pre-stress in bonds range from -75 to 90 GPa, in the 13 and 31 tilt boundaries, respectively, with the critical bond in the 31 tilt boundary loaded to near the upper tensile limit of the colormap (Figure 7). These large tensile and compressive stresses in the critical crack-forming bonds are responsible for the observed differences in activation energies and premature cracking in higher energy tilt boundaries. The pre-stress arising from the periodic tiling of disclination clusters in graphene tilt boundaries has been studied in depth by Wei et al.Wei2012 and is reported here for comparison. Figure 8 provides the computed activation energies with the disclination normalized pre-stress () in the critical carbon-carbon bond of each tilt boundary. Examination of the plotted data shows a remarkable correlation (R = 0.98) between activation energy and bond pre-stress. Furthermore, if the linear relation is extrapolated to = 0, a value of 4.74 eV is predicted, which deviates by only 4% from the expected bond dissociation energy of pristine graphene (4.93 eVBrenner2002 ). This finding shows that the bond pre-stress arising from interfacial structure has a critical role in determining the activation energies of crack formation processes in graphene. Analytically, the bond pre-stress serves to lower the energy barrier () from Eq. (1). Graphene samples with a low energy tilt boundary (e.g. 13) are therefore expected to have larger crack formation stresses and thus higher strength, whereas higher energy interfacial topologies are more prone to crack formation.
Extrapolation of the collected fitting results shows that kinematic effects become more pronounced as strain rates are reduced. For example, at a strain rate of 10/s and T = 300 K, MD results predict crack formation strengths of 90.5 and 95.2 GPa for 7 and 13 tilt boundaries, respectively. However, by extending Eq. (3) to strain rates typical of experimental indentation studies (e.g. 10/s) crack formation stresses of 47.3 ( 7) and 68.1 GPa ( 13) are predicted. A similar calculation performed on pristine graphene loaded in the armchair direction yields a crack formation stress of 84.2 GPa. These predictions thus approximately span the range of strengths experimentally measured by Rasool et al.Rasool2013 (48 to 83 GPa) and fall between the bounds reported by Ruiz-Vargas et al.Ruiz-Vargas2011 (35 GPa) and Lee et al.Lee2013 (98.5 GPa). Additionally, the results highlight the sensitivity of polycrystalline graphene to interfacial topology and provide a physical interpretation for the degree of weakening observed in experimental reports. Nonetheless, caution must be exercised when making direct comparisons to experiments as the precise topology of the indented tilt boundaries is unknown. Even so, the predictions presented here greatly improve on the existing theoretical estimates (e.g. 125 GPa in Ref. Cao2012b, ). The implication of these predictions is that the calculated activation energies may be used to estimate a conservative range for strengths in polycrystalline graphene. The current analysis also forecasts that in some tilt boundaries (e.g. 31) bond-breakage may occur spontaneously given sufficiently low loading rates and high enough temperatures. This result may be rationalized by considering the large tensile pre-stresses found in some interfacial topologies (Figure 7), but requires confirmation with experimental observations.
IV Conclusions
The impact of kinematic effects on the crack formation stress of graphene tilt boundaries were studied via MD simulation. Results of uniaxial tensile tests indicated that, contrary to previous studies, some tilt boundaries in graphene exhibit a large degree of strain rate sensitivity. Higher energy tilt boundaries such as the 31 were found to be the most sensitive to loading rate, whereas lower energy boundaries such as 13 were less sensitive. Based on MD data, an Arrhenius relationship was fit to tensile results to obtain activation energies for crack formation in the examined grain boundary configurations. The resultant activation energies were shown to correlate strongly to the degree of pre-stress in the critical interfacial bonds for each topological structure. Although most graphene tilt boundaries showed high strength at the relatively high strain rates applied in MD simulations, kinematic effects were found to become more pronounced when loading rates approached experimental ranges, leading to a considerable drop in crack formation stresses. In comparison to existing numerical studies, the conservative predictions of strength reported in the current study were found to be much closer to experimental observations. The range of activation energies calculated in this study highlights the importance of interfacial topology in determining the mechanical properties of graphene tilt boundaries and serves to rationalize the wide spectrum of experimentally reported strengths for polycrystalline graphene.
Acknowledgements.
The authors would like to acknowledge Dr. Tobin Filleter for useful discussions and the Natural Sciences and Engineering Research Council of Canada (NSERC) for providing funding for this work. Computations were performed on the GPC supercomputer at the SciNet HPC ConsortiumLoken2010 and the Briaree computing cluster under the administration of Calculquebec. SciNet is funded by: the Canada Foundation for Innovation under the auspices of Compute Canada; the Government of Ontario; Ontario Research Fund - Research Excellence; and the University of Toronto.References
- (1) C. Lee, X. Wei, J. W. Kysar, and J. Hone, Science 321, 385 (2008).
- (2) S. Stankovich, D. A. Dikin, G. H. B. Dommett, K. M. Kohlhaas, E. J. Zimney, E. A. Stach, R. D. Piner, S. T. Nguyen, and R. S. Ruoff, Nature 442, 282 (2006).
- (3) X. Li, W. Cai, J. An, S. Kim, J. Nah, D. Yang, R. Piner, A. Velamakanni, I. Jung, E. Tutuc, S. K. Banerjee, L. Colombo, and R. S. Ruoff, Science 324, 1312 (2009).
- (4) K. Kim, Z. Lee, W. Regan, and C. Kisielowski, ACS Nano 5, 2142 (2011).
- (5) C. S. Ruiz-Vargas, H. L. Zhuang, P. Y. Huang, A. M. van der Zande, S. Garg, P. L. McEuen, D. A. Muller, R. G. Hennig, and J. Park, Nano Letters 11, 2259 (2011).
- (6) G.-H. Lee, R. C. Cooper, S. J. An, S. Lee, A. van der Zande, N. Petrone, A. G. Hammerberg, C. Lee, B. Crawford, W. Oliver, J. W. Kysar, and J. Hone, Science 340, 1073 (2013).
- (7) H. I. Rasool, C. Ophus, W. S. Klug, A. Zettl, and J. K. Gimzewski, Nature Communications 4, 2811 (2013).
- (8) J. An, E. Voelkl, J. J. Suk, X. Li, C. W. C. Magnuson, L. Fu, P. Tiemeijer, M. Bischoff, B. Freitag, E. Popova, and R. S. Ruoff, ACS Nano 5, 2433 (2011).
- (9) P. Y. Huang, C. S. Ruiz-Vargas, A. M. van der Zande, W. S. Whitney, M. P. Levendorf, J. W. Kevek, S. Garg, J. S. Alden, C. J. Hustedt, Y. Zhu, J. Park, P. L. McEuen, and D. A. Muller, Nature 469, 389 (2011).
- (10) B. I. Yakobson and F. Ding, ACS Nano 5, 1569 (2011).
- (11) O. V. Yazyev and S. G. Louie, Physical Review B 81, 195420 (2010).
- (12) R. Grantab, V. V. B. Shenoy, and R. S. R. Ruoff, Science 330, 10 (2010).
- (13) Y. Wei, J. Wu, H. Yin, X. Shi, R. Yang, and M. Dresselhaus, Nature Materials 11, 1 (2012).
- (14) A. Cao and J. Qu, Applied Physics Letters 102, 071902 (2013).
- (15) A. Cao and J. Qu, Journal of Applied Physics 112, 043519 (2012).
- (16) A. Cao and Y. Yuan, Applied Physics Letters 100, 211912 (2012).
- (17) J. Zhang, J. Zhao, and J. Lu, ACS Nano 6, 2704 (2012).
- (18) Z. Song, V. I. Artyukhov, B. I. Yakobson, and Z. Xu, Nano Letters 13, 1829 (2013).
- (19) J. Kotakoski and J. C. Meyer, Physical Review B 85, 195447 (2012).
- (20) H. Zhang, Z. Duan, X. Zhang, C. Liu, J. Zhang, and J. Zhao, Physical Chemistry Chemical Physics 15, 11794 (2013).
- (21) L. Yi, Z. Yin, Y. Zhang, and T. Chang, Carbon 51, 373 (2013).
- (22) Y. I. Jhon, S.-E. Zhu, J.-H. Ahn, and M. S. Jhon, Carbon 50, 3708 (2012).
- (23) T. J. Booth, P. Blake, R. R. Nair, D. Jiang, E. W. Hill, U. Bangert, A. Bleloch, M. Gass, K. S. Novoselov, M. I. Katsnelson, and A. K. Geim, Nano letters 8, 2442 (2008).
- (24) S. Plimpton, Journal of Computational Physics 117, 1 (1995).
- (25) B. Akdim and R. Pachter, ACS Nano 5, 1769 (2011).
- (26) J. M. Carlsson, L. M. Ghiringhelli, and A. Fasolino, Physical Review B 84, 165423 (2011).
- (27) J. Li, Modelling and Simulation in Materials Science and … 0393, 173 (2003).
- (28) G. Halsey, H. J. White, and H. Eyring, Textile Research Journal 15, 295 (1945).
- (29) H. Zhao and N. R. Aluru, Journal of Applied Physics 108, 064321 (2010).
- (30) J. Bailey, The Glass Industry 20, 21 (1939).
- (31) D. W. Brenner, O. A. Shenderova, J. A. Harrison, S. J. Stuart, B. Ni, and S. B. Sinnott, Journal of Physics: Condensed Matter 14, 783 (2002).
- (32) See supplemental material at for results related to the energy barrier analysis of pristine graphene and a comparative energy barrier analysis of 7 at T = 450K.
- (33) S. N. Zhurkov, International Journal of Fracture Mechanics 1, 311 (1965).
- (34) C. Loken, D. Gruner, L. Groer, R. Peltier, N. Bunn, M. Craig, T. Henriques, J. Dempsey, C.-H. Yu, J. Chen, L. J. Dursi, J. Chong, S. Northrup, J. Pinto, N. Knecht, and R. V. Zon, Journal of Physics: Conference Series 256, 012026 (2010).
| Orientation | 111 is provided in brackets where applicable. | (Å) | |
|---|---|---|---|
| zigzag | 21.8 | 6.507 | 7 |
| zigzag | 13.2 | 10.721 | 19 |
| zigzag | 9.5 | 14.961 | 37 |
| armchair | 32.2 (27.8) | 8.868 | 13 |
| armchair | 38.2 (21.8) | 11.271 | 21 |
| armchair | 42.1 (17.9) | 13.693 | 31 |