TeV -ray observations of the young synchrotron-dominated SNRs G1.90.3 and G330.21.0 with H.E.S.S.
Abstract
The non-thermal nature of the X-ray emission from the shell-type supernova remnants (SNRs) G1.90.3 and G330.21.0 is an indication of intense particle acceleration in the shock fronts of both objects. This suggests that the SNRs are prime candidates for very-high-energy (VHE; TeV) -ray observations. G1.90.3, recently established as the youngest known SNR in the Galaxy, also offers a unique opportunity to study the earliest stages of SNR evolution in the VHE domain. The purpose of this work is to probe the level of VHE -ray emission from both SNRs and use this to constrain their physical properties. Observations were conducted with the H.E.S.S. (High Energy Stereoscopic System) Cherenkov telescope array over a more than six-year period spanning 2004–2010. The obtained data have effective livetimes of 67 h for G1.90.3 and 16 h for G330.21.0. The data are analyzed in the context of the multi-wavelength observations currently available and in the framework of both leptonic and hadronic particle acceleration scenarios. No significant -ray signal from G1.90.3 or G330.21.0 was detected. Upper limits (99% confidence level) to the TeV flux from G1.90.3 and G330.21.0 for the assumed spectral index were set at cm-2 s-1 above 0.26 TeV and cm-2 s-1 above 0.38 TeV, respectively. In a one-zone leptonic scenario, these upper limits imply lower limits on the interior magnetic field to G for G1.90.3 and to G for G330.21.0. In a hadronic scenario, the low ambient densities and the large distances to the SNRs result in very low predicted fluxes, for which the H.E.S.S. upper limits are not constraining.
keywords:
Gamma-rays: observations – SNR: individual: G1.90.3 – SNR: individual: G330.21.01 Introduction
Supernova remnants (SNRs) are believed to be sites of efficient particle acceleration and are expected to produce very-high-energy (VHE; TeV) -rays through the interaction of accelerated, high-energy particles with ambient medium and fields. TeV -ray emission is currently detected from a number of SNRs. Of particular interest are those SNRs whose X-ray spectra are dominated by non-thermal emission such as RX J17133946 (Aharonian et al. 2004b, 2006b, 2007a), RX J0852.04622 (Vela Jr.) (Aharonian et al. 2005, 2007b), and SN 1006 (Acero et al. 2010). Synchrotron emission from these SNRs reveals the existence of high-energy electrons which implies that intensive particle acceleration is occurring at their shock fronts. It makes these sources particularly interesting for -ray astronomy since high-energy particles accelerated at shock fronts can produce VHE -rays through the inverse Compton (IC) scattering of relativistic electrons on ambient photon fields, through Bremsstrahlung radiation of relativistic electrons, and through proton-nucleus interactions, and subsequent decay.
In this paper, the results of H.E.S.S. observations of two other SNRs with dominant non-thermal X-ray emission, G1.90.3 (Reynolds et al. 2008) and G330.21.0 (Torii et al. 2006), are presented.
The paper is organized as follows: In §2, the general properties of G1.90.3 and G330.21.0, based on radio and X-ray observations, are presented. The H.E.S.S. data analyses and results are described in §3. In §4, the non-detection of the SNRs is discussed in the context of leptonic and hadronic particle acceleration scenarios. Finally, the conclusions are summarized in §5.
| SNR | Observation period | Livetime | Median offset angle | Median zenith angle | Threshold energy |
|---|---|---|---|---|---|
| G1.90.3 | March 2004 – July 2010 | 67 h | 0.26 TeV | ||
| G330.21.0 | June 2005 – May 2009 | 16 h | 0.38 TeV |
2 The young SNRs G1.90.3 and G330.21.0
2.1 G1.90.3
In 1984, a radio survey using the Very Large Array (VLA) at 4.9 GHz led to the discovery of G1.90.3 (also G1.870.33), identified as an SNR based on its shell-like morphology and non-thermal radio emission (Green & Gull 1984). G1.90.3 had the smallest angular extent ever measured for a Galactic SNR (1.2′) suggesting a young age y and/or a large distance. Further evidence for the youth of G1.90.3 came from VLA observations at 1.5 GHz from 1985 (Green 2004) which clearly showed a circular symmetry, as observed in other young SNRs.
More recent observations at both X-ray (Reynolds et al. 2008) and radio (Green et al. 2008) wavelengths confirmed the young age of G1.90.3 by directly measuring the expansion of the SNR since earlier epochs. A spectral analysis of the Chandra X-ray data (Reynolds et al. 2008, 2009) revealed that the spatially integrated X-ray emission between 1.5 and 6 keV is well described as synchrotron emission from an electron distribution characterized by a power-law with an exponential cut-off. In the context of the srcut model 111The srcut model adopted by Reynolds et al. (2009) describes the synchrotron radiation from an electron distribution described by a power law with an exponential cut-off in a uniform magnetic field. taking into account the effects of dust scattering, a roll-off frequency Hz (errors represent 90% confidence limits), one of the highest values ever reported for an SNR, and a spectral index (90% confidence limits; flux density scales with frequency as Sν ) were obtained, as well as the absorption column density cm-2 (Reynolds et al. 2009). This fit was performed assuming a 1 GHz flux density of 1.17 Jy which is obtained by extrapolating the value at 1.5 GHz for the observed (Reynolds et al. 2009). The estimate of the column density, together with the angular proximity of G1.90.3 to the Galactic Center, suggests a distance of 8.5 kpc, which is assumed throughout this paper.
The Chandra image further revealed that the shell had significantly expanded (by 16%) to its present diameter of 1.7′ (Reynolds et al. 2008). An age 150 y was then derived by comparing radio observations from 1985 and Chandra observations from 2007 (Reynolds et al. 2008) and later confirmed using only radio observations from the VLA at two different epochs (Green et al. 2008; Murphy, Gaensler & Chatterjee 2008). These observations also imply a mean physical radius of 2 pc and a mean expansion velocity of 12 000 km s-1 at the assumed distance of 8.5 kpc (Green et al. 2008). The most recent X-ray measurements by Carlton et al. (2011) are in agreement, finding an age y assuming no deceleration has taken place, with a true age most likely being 110 y.
The combined radio / X-ray image (Reynolds et al. 2008) shows a bright, nearly circular ring with extensions (“ears”) extruding symmetrically from the East and West. However, the radio and X-ray morphologies differ significantly from each other; while the radio source exhibits its maximum brightness in the North, the X-ray source has a marked bilateral E-W symmetry which includes the aforementioned X-ray ”ears” not seen in at radio wavelengths. Interaction of the SNR shock front with a roughly uniform magnetic field B could explain the bilateral X-ray morphology, provided that the electron acceleration is dependent on the obliquity angle between the shock normal and B (Reynolds et al. 2009; Fulbright & Reynolds 1990), but suggests that the large-scale B may not be important for the radio emission (Green et al. 2008), which exhibits a markedly different morphology. An alternative explanation for the bilateral X-ray morphology is that the proton injection rate is dependent on the obliquity angle. This would result in magnetic field amplification being confined to the polar regions and is considered plausible for the related case of SNR SN 1006 which also features bilateral morphology (see e.g. Völk, Berezhko & Ksenofontov 2003). Recently, thermal X-ray emission was also discovered from the interior of the remnant and rim (Borkowski et al. 2010). The featureless, non-thermal, synchrotron-dominated, X-ray spectrum of the integrated emission (Reynolds et al. 2008, 2009) implies electrons are efficiently accelerated, reaching a maximum (cut-off) energy G)1/2 TeV.
For a sphere of radius 2.2 pc, a Type Ia SN explosion model with an exponential ejecta profile (Dwarkadas & Chevalier 1998) predicts an age of 100 y and an ISM number density of about 0.04 cm-3 (Reynolds et al. 2008). Ksenofontov, Völk & Berezhko (2010) derive slightly different values of the age (80 y) and number density (0.02 cm-3), assuming an expansion velocity of 14 000 km s-1 and radius of 2 pc in their diffusive shock acceleration (DSA) model. Studying the expansion of G1.90.3 by comparing Chandra X-ray images taken in 2007 and 2009, Carlton et al. (2011) derived an ISM density of 0.022 cm-3 in agreement with Ksenofontov, Völk & Berezhko (2010).
2.2 G330.21.0
The radio source G330.21.0 was identified as a Galactic SNR (Clark, Caswell & Green 1973, 1975) on the basis of its non-thermal spectrum and its proximity to the Galactic plane. Following observations at radio frequencies (Caswell et al. 1983) showed the clumpy, possibly distorted, shell-like structure of the remnant delineated by eight ”blobs” of elevated brightness. They also showed the existence of a gradient in the surface brightness, with intensity higher towards the plane. Whiteoak & Green (1996) classified G330.21.0 as a possible composite-type SNR. The size of the shell is 11′ in diameter (Caswell et al. 1983; Whiteoak & Green 1996).
Based on ASCA observations (Tanaka, Inoue & Holt 1994), Torii et al. (2006) discovered a featureless X-ray spectrum between 0.7 and 10 keV with a photon index and interstellar absorption cm-2. It was also fit with a power law with exponential cut-off (srcut model), deriving Hz and cm-2 (Torii et al. 2006) for the fixed observed radio spectral index and flux density at 1 GHz of 5 Jy deduced from the source spectrum (Green 2004). A general anti-correlation between radio and X-ray intensities was shown, explained by the different density of the interstellar medium (ISM) on the eastern and western sides of the remnant. Since the eastern shock is decelerating as it interacts with a denser ISM, electrons are accelerated to lower energies (GeV) than in the western shock. Conversely, the western shock is interacting with an ISM of lower density, resulting in acceleration to higher energies (TeV). As a result, the X-ray emission is stronger in the western part of the shell and radio emission in the eastern part (Torii et al. 2006). The lower limit on the distance kpc was calculated by McClure-Griffiths et al. (2001) using HI absorption measurement. The distance to G330.21.0 is assumed to be 5 kpc hereafter.
Subsequent Chandra and XMM-Newton observations (Park et al. 2006, 2009) revealed that the X-ray emission from G330.21.0 is dominated by a power-law continuum (–2.5) and comes primarily from thin filaments along the boundary of the shell. Measurements of the filament widths using Chandra images allow the downstream magnetic field and maximum (cut-off) electron energy to be estimated as – G and – TeV, respectively (Park et al. 2009). Park et al. (2006) also discovered a point-like source, CXOU J160103.1513353, at the center of the SNR, claiming it to be a candidate central compact object (CCO). Additionally, evidence of pulsations was found with a period of 7.5 s, although later XMM-Newton observations (Park et al. 2009) did not confirm this. Chandra and XMM-Newton observations also revealed faint, thermal X-ray emission in the eastern region of the shell of G330.21.0 (Park et al. 2009). Using the thermal emission, the ISM density was calculated and appears to be low ( cm-3). Assumptions on the ISM density and the distance to the SNR presented above lead to the estimation of the age of the remnant y according to the Sedov (1959) solution for the adiabatic stage of the hydrodynamical expansion of the SNR (Park et al. 2009).
| NON | NOFF | Excess | Significance | [cm-2 s-1] | ||
|---|---|---|---|---|---|---|
| for | ||||||
| G1.90.3 | 785 | 20537 | 0.038 | 6.4 | 0.2 | for |
| for | ||||||
| for | ||||||
| G330.21.0 | 874 | 10445 | 0.074 | 100.5 | 3.4 | for |
| for |
3 Observations and analysis
3.1 The H.E.S.S. telescopes
H.E.S.S. (High Energy Stereoscopic System) is an array of four, 13-m diameter, imaging atmospheric Cherenkov telescopes (IACTs) located in the Khomas Highland of Namibia at an altitude of 1800 m above sea level (Bernloehr et al. 2003; Funk et al. 2004). The telescopes have a nominal field-of-view (FoV) of 5∘ and are optimized for detecting -raysin the range 0.1 TeV to 30 TeV. The angular resolution of the system is 0.1∘ and the average energy resolution is 15% (Aharonian et al. 2006a). The H.E.S.S. array is capable of detecting point sources with a flux of 1% of the Crab Nebula flux at the significance of 5 in 10 h at low zenith angles (Ohm, van Eldik & Egberts 2009).
3.2 Data and analysis techniques
G1.90.3 is located 2∘ from the supermassive black hole Sgr A∗ at the Galactic Center (GC) and the TeV -ray source HESS J1745290 which is coincident with the position of both Sgr A∗ and the pulsar wind nebula G359.950.04 (Aharonian et al. 2004a). Analyses of the SNR therefore benefit from the deep H.E.S.S. exposure in the region. More than half of the observations used for the analysis are obtained from Sgr A∗ observations, while the remainder is from the H.E.S.S. Galactic Plane Survey (Aharonian et al. 2006c; Carrigan et al. 2013). In order to reduce the large exposure gradient towards the GC, only those observations centered within 1.5∘ from the G1.90.3 center were selected for the analysis. The observations which pass the standard H.E.S.S. data quality selection (Aharonian et al. 2006a) span a six-year period from 2004 until 2010, have a livetime of 67 h, and a median offset of from G1.90.3 (see Table 1). For optimal spectral reconstruction, the strict selection excludes observations taken during poor or variable weather conditions and includes only those where all four telescopes were in operation. The median zenith angle (ZA) is relatively low, , leading to a low-energy threshold of 0.20 TeV for individual -rays. The analysis is performed above the safe energy threshold of the cumulative -ray dataset (here, 0.26 TeV) to avoid known biases in the reconstructed energy close to the threshold (Aharonian et al. 2006a).
Since the SNR has a diameter of 1.7′ when observed at both radio and X-ray energies, and since the H.E.S.S. point spread function (PSF) (68% containment) is much larger (10′ diameter), the test region from which the signal is measured (ON region) was defined a priori as a circular region with a radius of 0.10∘, the standard size used to search for point-like sources with H.E.S.S. The test region is positioned at the center of G1.90.3 at , (Green & Gull 1984).
There is no other source present within the same H.E.S.S. FoV of G330.21.0 and it has less exposure than G1.90.3. All available data from 2005 through 2009 within 2.5∘ of the center of the remnant were used for the analysis. It results in 16 h of livetime using only data which passed standard H.E.S.S. quality selection and includes only those observations where at least three telescopes were in operation. The data were taken at a median ZA of ; the higher ZA results in a respectively higher energy threshold, 0.38 TeV, compared to G1.90.3. The median offset of the observations is . The datasets used for the analyses of both G1.90.3 and G330.21.0 are summarized in Table 1.
The size of G330.21.0 is similar to the H.E.S.S. PSF. Thus, in order to take into account all the emission from the remnant a bigger ON region as compared to G1.90.3 was chosen a priori, defined as a circle with radius . The test region is positioned at the center of the SNR at , .
The H.E.S.S. standard analysis222H.E.S.S. Analysis Package (HAP) version 11-02-pl07 (Aharonian et al. 2006a) was used for the processing of extensive air shower (EAS) data from both G1.90.3 and G330.21.0 observations. The boosted decision trees method (BDT), a decision-tree-based machine-learning algorithm (Ohm, van Eldik & Egberts 2009), was used for -hadron separation, i.e. to select -ray-like events while reducing the hadronic background component. The recorded EAS images were required to have integrated intensities per image of at least 80 photoelectrons (p.e.; standard cuts) in order to be included in the analysis. The relatively low cuts used on the EAS image intensities (compared to hard cuts at, e.g., 200 p.e.) allowed the inclusion of fainter EASs to probe the low-energy end of the VHE -ray spectra from both G1.90.3 and G330.21.0. Over the six-year observation period, the optical reflectivity of the H.E.S.S. telescope mirrors varied and the gains of the cameras’ photomultiplier tubes changed. This time-dependent optical response was taken into account in the spectral reconstructions by calibrating the energy of each event with EAS images of single muon rings passing close to the telescopes (Bolz 2004; The H.E.S.S. Collaboration 2007).
The reflected region background method (Berge, Funk & Hinton 2007) was used for background subtraction when measuring the VHE -ray flux from both SNRs. In this method, both ON and background (OFF) regions are identical in size and have identical offsets from the camera center, such that they are affected by the radially-varying acceptance in the same manner. Nearby regions with known VHE -ray emission, including the diffuse emission near the GC, were excluded from all OFF regions in order to avoid contaminating the background estimation.
Results were cross-checked using the alternative Model analysis technique333ParisAnalysis software version 0-8-18 (de Naurois & Rolland 2009) as well as an independent calibration of the raw data and quality selection criteria. The results obtained with these different analysis chains are consistent.
3.3 Flux upper limits
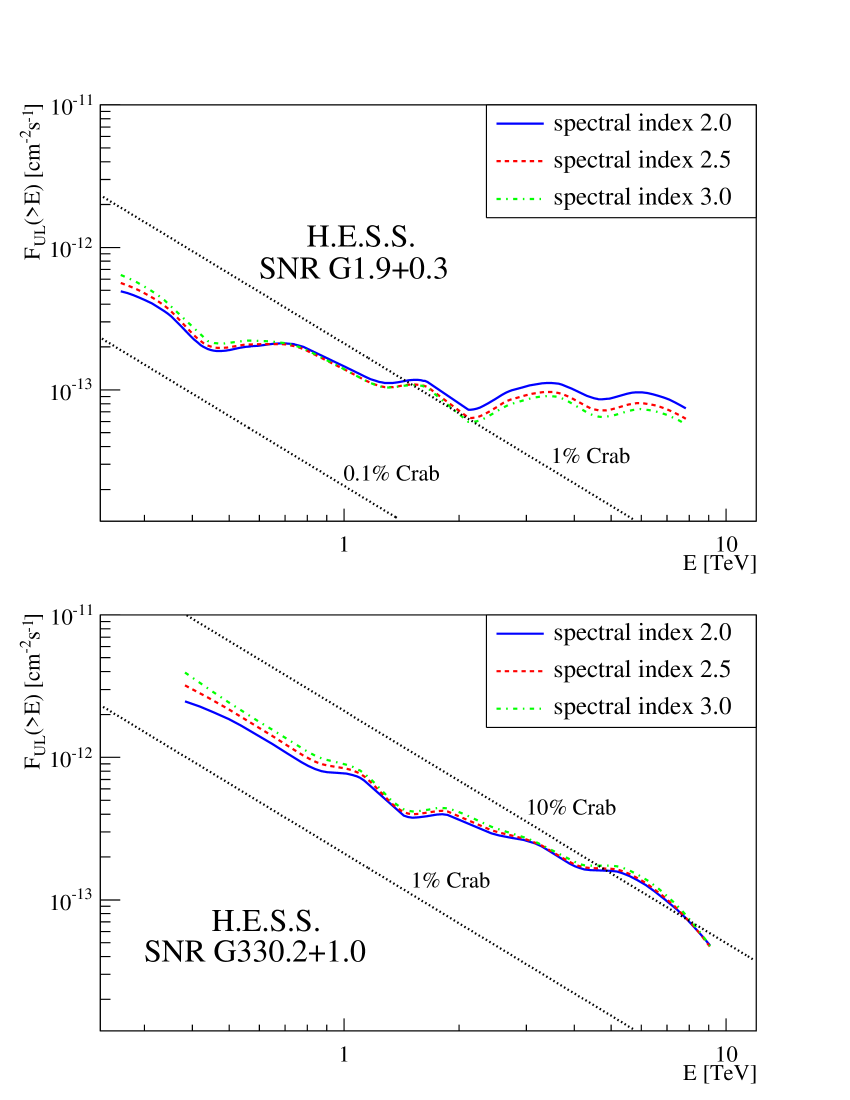
Despite relatively deep exposures with the H.E.S.S. telescopes, no significant VHE -ray signal was detected from G1.90.3 or G330.21.0. The upper limits (ULs; 99% confidence level) (Feldman & Cousins 1998) on the integral fluxes above the 0.26 TeV (G1.90.3) and 0.38 TeV (G330.21.0) energy thresholds were calculated for three assumed spectral indices, , 2.5 and 3.0. The event statistics and ULs are summarized in Table 2, where and are numbers of ON and OFF region events, respectively, and is the normalization factor between ON and OFF regions such that excess can be defined as . The dependence of the integral flux UL on the energy threshold can be seen in Fig. 1. Since the UL measurements are not strongly dependent on the value of , ULs with assumed spectral index are used hereafter in this paper.
4 Discussion
The synchrotron nature of the X-ray emission indicates that electrons in both SNRs are accelerated to very high (TeV) energies. For such high energies, the acceleration process should run very similarly for electrons and hadrons. Some important differences arise from the cut-off in the electron spectrum (due to electron radiation losses; see e.g. Reynolds & Keohane (1999)) and in the number of accelerated particles in each distribution. Nonetheless, the existence of high-energy electrons directly shows that there should also exist hadrons accelerated to energies at least as high.
This leads to the expectation of -ray emission from inverse Compton (IC) scattering of relativistic electrons on photon fields and/or from hadronic (e.g. proton-nucleus) interactions. The non-detection of this emission allows constraints to be placed on parameters such as the magnetic field strength, the ISM density, the distance and the cosmic-ray (CR) efficiency, the latter defined as the fraction of SN explosion energy that is transferred to the particle acceleration.
| SNR | ||||
| [G] | [TeV] | [erg] | ||
| Uncooled electron spectrum | ||||
| G1.90.3 | 2.2 | |||
| G330.21.0 | 2.2 | |||
| Dominating synchrotron losses | ||||
| G1.90.3 | 2.0 | – | ||
| G330.21.0 | 2.0 | – | ||
4.1 Leptonic scenario
Although the comparison of the X-ray and radio data reveals general anti-correlation for both SNRs indicating that radio and X-ray emitting electrons may not come from the same population, the one-zone leptonic model is used to obtain constraints on physical parameters of the remnants and ambient media. Assuming that the radio and X-ray emission are produced by the same electron population via synchrotron radiation, one can predict the -ray emission expected from the IC scattering of the same electrons on the cosmic microwave background (CMB) photons and other ambient photon fields. Although in the vicinity of the GC, the contribution of the infrared (IR) and optical photon fields to the resulting IC emission can be comparable to or even exceed the contribution from the CMB photons alone (Porter, Moskalenko & Strong 2006), it is very difficult to determine the interstellar radiation field at the location of a specific object. Therefore, in this paper, we first consider CMB photons alone, since it is possible that there is no significant source of target photons in the proximity of G1.90.3 and G330.21.0, but then also discuss a potential contribution of the IR and optical photon fields to the overall IC emission and its impact on the resulting constraints on magnetic field and electron population parameters.
| SNR | Optical photons | IR photons | ||
| energy density | energy density | |||
| [K] | [eV cm-3] | [K] | [eV cm-3] | |
| G1.90.3 | 4300 | 14.6 | 48 | 1.5 |
| G330.21.0 | 3500 | 2.4 | 39 | 1.4 |
The spectral energy distribution (SED) for G1.90.3 and G330.21.0 is calculated assuming the stationary case and the exponentially cut-off power-law distribution of the electron density with energies,
| (1) |
where is the electron Lorentz factor, is the normalization, is the spectral index, and is the cut-off Lorentz factor with the cut-off energy and the electron mass . The synchrotron emission is calculated according to Rybicki & Lightman (1979) assuming the isotropic magnetic field and the isotropical distribution of the electron velocities. The correct integration over angle between the electron velocity and the magnetic field is established using the function introduced by Aharonian, Kelner & Prosekin (2010). The IC emission is estimated according to Blumenthal & Gould (1970) using the Klein-Nishina cross section.
In Fig. 2, SED models for G1.90.3 and G330.21.0 are presented. The IC contribution to the SED is presented for two different assumed values of the magnetic field . The synchrotron contribution to the SED (black solid lines) is modeled with the electron spectral index on both cases, which represents the multi-wavelength (MWL) observational data quite well. This electron spectral index corresponds to the radio spectral index of . For G330.21.0, this value is very different from the observed spectral index of 0.3 reported by Clark, Caswell & Green (1975) based on two observed points: at 408 MHz (Molongo Cross Telescope) and 5000 MHz (Parkes 64m radio telescope). However, subsequent observations at 843 MHz with the Molongo Observatory Synthesis Telescope (Whiteoak & Green 1996) revealed a flux density which does not agree with such a low spectral index. The choice of in this work is motivated by the necessity of fitting the X-ray data, which cannot be explained for within this model.
Comparing the H.E.S.S. integral flux ULs on the TeV -ray emission above the safe energy threshold (see Table 2; for assumed ) to the predicted -ray flux above the same energy, within the context of the leptonic model presented above, one can calculate lower limits on the interior magnetic field strength . The lower limits are found to be 12.1 G for G1.90.3 and 8.0 G for G330.21.0. Lower limits on in turn allow ULs on the electron cut-off energy, , and the total energy in electrons, , to be determined (see Table 3).
Physical assumptions made in the model above are the same as in the srcut model for the synchrotron emission used to fit the X-ray data. Therefore, it might be useful to compare roll-off frequencies of the synchrotron spectrum of G1.90.3 and G330.21.0 implied from this work with those obtained in the srcut fits in earlier studies. It should be noted though, that the srcut model is an approximation and is exact only for the radio spectral index (corresponding to the electron index ). The estimate of the can differ from the real value by 20% depending on the spectral index, and will be lower (resp. higher) for (resp. ) 0.55. The roll-off frequency is the the characteristic frequency of the photon emitted by the electron with the energy and it is given by (Reynolds & Keohane 1999, with an error corrected)
| (2) |
For G1.90.3, the roll-off frequency obtained in this work, Hz, is consistent with the one obtained in Reynolds et al. (2009). In the case of G330.21.0, Hz is an order of magnitude higher than the one derived by Torii et al. (2006), which can be naturally explained by the different assumed spectral index: in Torii et al. (2006) the value of the radio spectral index was fixed to , while in this work the synchrotron emission from G330.21.0 is modeled for .
The electron spectrum of the form of the power law with the exponential cut-off is valid only if the energy losses due to the synchrotron emission can be neglected. This regime is plausible for both G330.21.0 and especially G1.90.3 due to their young age. The ”break” energy above which synchrotron cooling starts to play an important role is given by the expression (Blumenthal & Gould 1970)
| (3) |
For the estimated ages of the SNRs and derived lower limits of the magnetic field upper limits on the break energy can be calculated resulting in TeV for G1.90.3 and TeV for G330.21.0. However, the higher magnetic field would significantly decrease the estimate of the break energy, i.e. a synchrotron cooling can occur. Significant synchrotron cooling modifies the shape of the initial electron spectrum obtained from the acceleration process. The modified electron spectrum is steepened by one and features a super-exponential cut-off (Zirakashvili & Aharonian 2007):
| (4) |
Following a similar procedure as presented above for the case of the uncooled electron spectrum, the lower limit on the magnetic field and the upper limit on the cut-off energy can be estimated. The spectral index obtained in the particle acceleration is assumed to be and the radio data is not taken into account. In this scenario, the lower limits on magnetic field are G (29% difference) for G1.90.3 and G (46% difference) for G330.21.0. Upper limits on cut-off energies are 80 TeV (81% difference) and 56 TeV (167% difference) correspondingly.
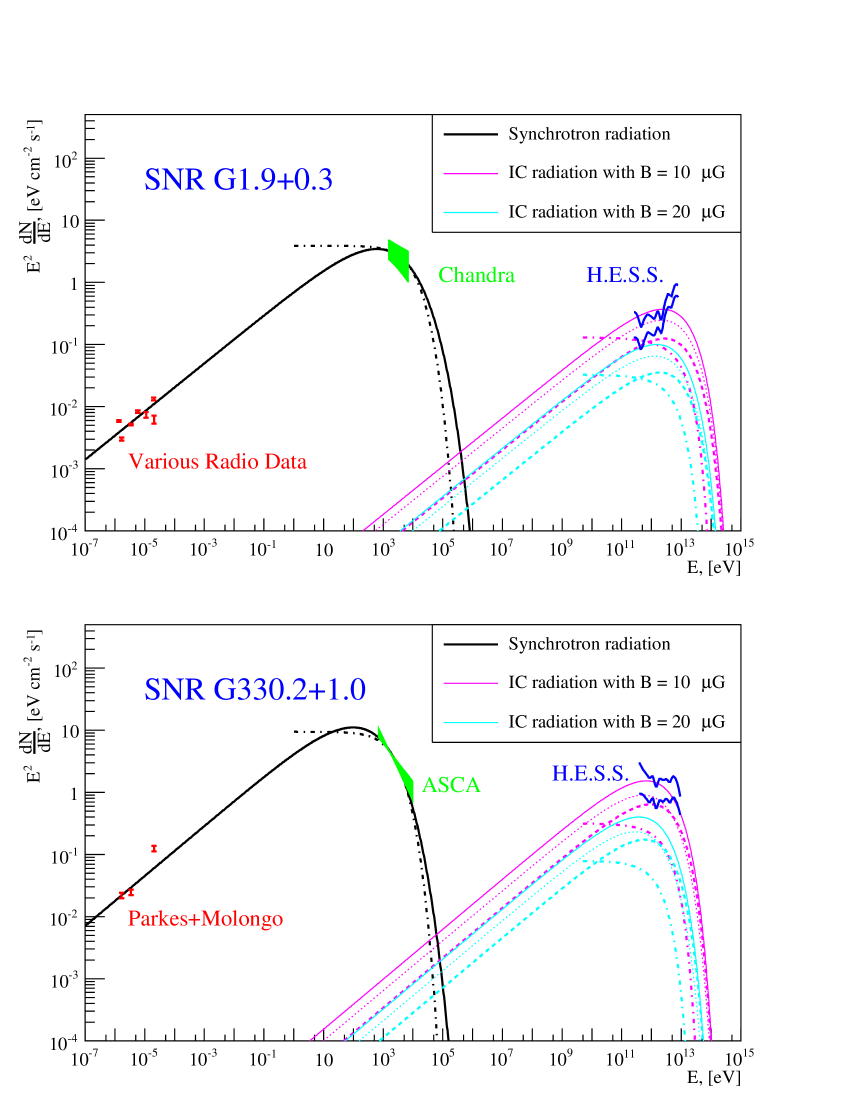
To calculate the contribution of optical and IR photon fields (see Table 4), the interstellar radiation field (ISRF) model of Porter, Moskalenko & Strong (2006) was used. To simplify calculations ISRF models were fit with Planck distributions for optical, IR and CMB photons. For G1.90.3, the adopted ISRF at kpc and kpc was used, where is the distance from the GC and is the height above the Galactic plane. For G330.21.0, the ISRF at kpc and kpc was adopted. The ISRF at kpc and kpc can be described with an optical radiation at a temperature K with an energy density of eV cm-3 and a contribution from IR radiation at a temperature K with an energy density of eV cm-3. Similarly, the ISRF at kpc and kpc can be fit with the contribution from optical radiation at a temperature K with an energy density of eV cm-3 and a contribution from IR radiation at a temperature K with an energy density of eV cm-3. The contribution of the optical photons to the IC emission appears to be less than 1% even in the relative vicinity of the GC and does not affect the derived constraints on the physical parameters presented in Table 3. In contrast, the inclusion of the IR photons in the modeling provide a significant effect on the results444An uncooled electron spectrum is assumed. In this case the lower limits on the magnetic field are estimated to be 15.1 G (25% difference) and 10.5 G (31% difference) for G1.90.3 and G330.21.0 respectively. The higher the limits are on the magnetic field, the stronger the constraints are on the cut-off energy and the total energy in electrons. For G1.90.3, TeV (10% difference) and erg (30 % difference) and for G330.21.0, TeV (14% difference) and erg (36% difference). In Fig. 2, the contribution of the IR photons to the overall IC emission SED is shown with dashed lines.
The leptonic model of the broadband emission from G1.90.3 presented in this paper is similar to the purely leptonic model (in the test particle limit) considered by Ksenofontov, Völk & Berezhko (2010). The main difference is that Ksenofontov, Völk & Berezhko (2010) assume a radio spectral index , i.e. electron spectral index , whereas in this paper the radio spectral index () was adopted based on radio observations. Taking into account this difference, the results obtained by the two models are compatible. Nevertheless, given the low value obtained for the lower limit on , the purely leptonic scenario, with an unmodified shock and without magnetic field amplification, cannot be ruled out, in contrast to what was suggested by Ksenofontov, Völk & Berezhko (2010).
4.2 Hadronic scenario
The H.E.S.S. ULs on the -ray flux from G1.90.3 and G330.21.0 can also be compared to predictions based on a hadronic scenario, where mesons would be created when CR ions accelerated in the supernova blast wave collide with the ambient thermal gas, producing -rays via decay. Since both SNRs exhibit synchrotron X-ray emission which reveals the existence of electrons with energies TeV, the maximum energy of accelerated hadrons should be at least 20 TeV. This suggests that the spectrum of -rays produced in proton-nucleus interactions extends up to at least a few TeV. The expected VHE flux from an SNR in a hadronic scenario can be then described, according to Drury, Aharonian & Völk (1994), as
| (5) | |||||
where is the -ray emissivity normalized to the CR energy density, is the spectral index of the relativistic protons distribution, is the CR acceleration efficiency, and is the SN explosion energy, is the distance to the SNR and is the ISM density. The emissivity also depends on (inversely proportional), and Drury, Aharonian & Völk (1994) have calculated for spectral indices 2.1–2.7 (see Table 1 in Drury, Aharonian & Völk 1994), taking into account the contribution of nuclei other than H by multiplying the pure proton contribution by a factor of 1.5. The values and are adopted to predict the highest possible flux. Furthermore, in this scenario, only emission from neutral pion decay is taken into account; charged pion decay will contribute IC and Bremsstrahlung emission but with a much smaller contribution to the energetics.
After fixing the spectral index and the CR production rate, four parameters remain free: , , and . Assuming the explosion energy released is erg and taking into account the estimated distance to the SNR, one can constrain the product of the CR efficiency and the ISM density using the H.E.S.S. UL. The resulting -ray spectrum should roughly follow the energy spectrum of protons. Since is assumed, the H.E.S.S. UL with the assumed index of 2.0 should be used for placing constraints as the closest to the modeled -ray spectrum.
The expected flux above 0.26 TeV from G1.90.3 assuming kpc is then
| (6) |
The H.E.S.S. UL on the flux above the same energy, , can be used to provide an UL on the product of the density and efficiency,
| (7) |
During the free expansion stage of the SNR’s evolution, which G1.90.3 is assumed to be in, the CR efficiency is expected to be very low, (Drury, Aharonian & Völk 1994). Ksenofontov, Völk & Berezhko (2010) show that at the age of 100 y, the CR efficiency for G1.90.3 should be about . The typical value of the CR efficiency during the adiabatic stage of SNR evolution can serve as ULs for the case of G1.90.3. Here, the range of values is considered. This leads to an UL on the ISM density cm-3 depending on the assumed . This UL is 2–3 orders of magnitude higher than the estimate based on the Type Ia SN model of Dwarkadas & Chevalier (1998) and the H.E.S.S. flux UL is therefore not constraining. On the other hand, assuming the density cm-3 (Reynolds et al. 2008), an UL on the CR efficiency can be obtained, . Since is defined only in the range 0–1, this limit is also not constraining.
For SNR G330.21.0, the expected flux above 0.38 TeV at the distance of 5 kpc is
| (8) |
The H.E.S.S. UL on the flux above this energy constrains the product of the CR efficiency and the density
| (9) |
It corresponds to an UL on the ISM density cm-3, assuming the typical value of the CR efficiency during the adiabatic stage of SNR evolution, , and to an UL on the CR efficiency assuming the Park et al. (2006) estimate on the ISM density cm-3. In the case of G330.21.0, ULs estimated within the hadronic scenario are also not strongly constraining. Estimates of the ULs on the product of the CR efficiency and the density of both G1.90.3 and G330.21.0 are within the range of estimates for a subset of 20 other SNRs recently studied by Bochow (2011).
Alternatively, with existing estimates of the ISM densities and assumptions on CR efficiencies, one can predict the expected fluxes from G1.90.3 and G330.21.0. For example, assuming cm-3 and , the expected VHE -ray flux from G1.90.3 above 0.26 TeV according to Eq. 6 is in the range of , 1–3 orders of magnitude lower than the H.E.S.S. UL. For G330.21.0, assuming cm-3 and according to Eq. 8 one can calculate the expected flux above 0.38 TeV of , 25 times lower than the UL.
Although the H.E.S.S. ULs for both SNRs do not constrain the predictions of this scenario, it should be noted that there exist non-negligible uncertainties in many of the model parameters. In particular, the expected -ray flux is very sensitive to the estimate of the distance to the source. According to Ksenofontov, Völk & Berezhko (2010), the dependence of the -ray flux on the distance for G1.90.3, taking into account the relations between the distance and the ISM density, SNR radius and shock velocity, is . Therefore, even a small decrease in the distance estimate would significantly increase the expected flux and consequently improve the constraints on the ISM density and the CR efficiency. Specifically, a reduction of the distance to G1.90.3 by to 4.6 kpc would increase the expected flux, calculated for the lowest assumed CR efficiency of , to the level of the H.E.S.S. UL. For G330.21.0, the expected flux scales simply as and would be compatible with the H.E.S.S. UL if the distance to the source were reduced by , to 3.8 kpc.
5 Summary
The SNRs G1.90.3 and G330.21.0 can serve as valuable astrophysical laboratories for investigating the MWL properties of young, shell-type SNRs whose emission is dominated by non-thermal synchrotron emission. Observations in different energy regimes can provide insight on the physical properties of this important subclass of SNRs. H.E.S.S. observations in particular can provide a unique probe at the highest energies, in the TeV -ray regime.
Despite relatively deep exposures, the H.E.S.S. data do not show any signs of significant TeV -ray emission from either SNR. Consequently, the 99% confidence level ULs on the TeV -ray flux from these sources were determined. For assumed power-law spectra with a spectral index , the obtained ULs are cm-2s-1 for G1.90.3 and cm-2s-1 for G330.21.0.
The ULs on the TeV -ray flux provide an opportunity to set constraints on the magnetic field in the context of a leptonic particle acceleration scenario and on the ISM density and CR efficiency in a hadronic scenario. Lower limits on the interior magnetic fields were estimated at 12 G for G1.90.3 and 8 G for G330.21.0. The obtained lower limits can be satisfied without requiring magnetic-field amplification beyond simple compression. In the case of the hadronic scenario, the ULs are two orders of magnitude greater than the flux prediction. Obtained ULs on the ISM densities are compatible with other estimates of the densities (from the thermal X-ray emission for G330.21.0 and from the expansion rate for G1.90.3). The CR efficiency, however, cannot be significantly constrained with the current dataset.
The non-detection of G1.90.3 and G330.21.0 in the TeV -ray domain can be understood by examining those characteristics which set them apart from other members of this subclass, notably Vela Jr., RX J17133946, and SN 1006, all of which have been previously detected by H.E.S.S. to emit TeV -rays. While most are situated at relatively near distances from the Sun ( kpc), G1.90.3 and G330.21.0 are both significantly farther away ( kpc). Their remoteness considerably reduces the -ray flux, particularly in hadronic scenarios. Higher ambient densities would also have increased the flux predictions in such a scenario. Finally, the relatively young ages of these remnants are problematic due to smaller population of high-energy particles, which results in lower -ray flux. In the leptonic scenario, this necessitates a low magnetic field to compensate and achieve a flux which is detectable with the current IACTs, and may even challenge next-generation instruments. G1.90.3 is also unique due to its exceptionally young age in comparison to the other SNRs. This could imply that, at least for G330.21.0, the age is not the main problem and that it could have been detected if it were closer.
G330.21.0 and G1.90.3 remain promising targets for -ray observations at TeV energies, in particular with the future generation of instruments, namely the Cherenkov Telescope Array (CTA) due to its times higher sensitivity (Actis et al. 2011).
Acknowledgements
We are very grateful to S. Reynolds for helpful discussions and for providing us with the power-law fit of the G1.90.3 X-ray data.
The support of the Namibian authorities and of the University of Namibia in facilitating the construction and operation of H.E.S.S. is gratefully acknowledged, as is the support by the German Ministry for Education and Research (BMBF), the Max Planck Society, the French Ministry for Research, the CNRS-IN2P3 and the Astroparticle Interdisciplinary Programme of the CNRS, the U.K. Particle Physics and Astronomy Research Council (PPARC), the IPNP of the Charles University, the South African Department of Science and Technology and National Research Foundation, and by the University of Namibia. We appreciate the excellent work of the technical support staff in Berlin, Durham, Hamburg, Heidelberg, Palaiseau, Paris, Saclay, and in Namibia in the construction and operation of the equipment.
References
- Acero et al. (2010) Acero F., Aharonian F., Akhperjanian A. G., Anton G., de Almeida U. B., Bazer-Bachi A. R., Becherini Y., et. al, 2010, A&A, 516, A62
- Actis et al. (2011) Actis M. et al., 2011, Experimental Astronomy, 32, 193
- Aharonian et al. (2004a) Aharonian F. et al., 2004a, A&A, 425, L13
- Aharonian et al. (2006a) Aharonian F. et al., 2006a, A&A, 457, 899
- Aharonian et al. (2006b) Aharonian F. et al., 2006b, A&A, 449, 223
- Aharonian et al. (2005) Aharonian F. et al., 2005, A&A, 437, L7
- Aharonian et al. (2006c) Aharonian F. et al., 2006c, ApJ, 636, 777
- Aharonian et al. (2007a) Aharonian F. et al., 2007a, A&A, 464, 235
- Aharonian et al. (2007b) Aharonian F. et al., 2007b, ApJ, 661, 236
- Aharonian et al. (2004b) Aharonian F. A. et al., 2004b, Nature, 432, 75
- Aharonian, Kelner & Prosekin (2010) Aharonian F. A., Kelner S. R., Prosekin A. Y., 2010, Phys. Rev. D, 82, 043002
- Arendt (1989) Arendt R. G., 1989, ApJS, 70, 181
- Berge, Funk & Hinton (2007) Berge D., Funk S., Hinton J., 2007, A&A, 466, 1219
- Bernloehr et al. (2003) Bernloehr K. et al., 2003, Astropart. Phys., 20, 111
- Blumenthal & Gould (1970) Blumenthal G. R., Gould R. J., 1970, Rev. Mod. Phys., 42, 237
- Bochow (2011) Bochow A., 2011, in International Cosmic Ray Conference, Vol. 7, International Cosmic Ray Conference, p. 110
- Bolz (2004) Bolz O., 2004, PhD in Physics, Ruprecht-Karls-Universität Heidelberg
- Borkowski et al. (2010) Borkowski K. J., Reynolds S. P., Green D. A., Hwang U., Petre R., Krishnamurthy K., Willett R., 2010, ApJL, 724, L161
- Carlton et al. (2011) Carlton A. K., Borkowski K. J., Reynolds S. P., Hwang U., Petre R., Green D. A., Krishnamurthy K., Willett R., 2011, ApJ, 737, L22
- Carrigan et al. (2013) Carrigan S., Brun F., Chaves R. C. G., Deil C., Gast H., Marandon V., for the H. E. S. S. collaboration, 2013, ArXiv e-prints
- Caswell et al. (1983) Caswell J. L., Haynes R. F., Milne D. K., Wellington K. J., 1983, MNRAS, 204, 915
- Clark, Caswell & Green (1973) Clark D. H., Caswell J. L., Green A. J., 1973, Nature, 246, 27
- Clark, Caswell & Green (1975) Clark D. H., Caswell J. L., Green A. J., 1975, Aust. J. Phys. Astrophys. Suppl., 37, 1
- de Naurois & Rolland (2009) de Naurois M., Rolland L., 2009, Astroparticle Physics, 32, 231
- Drury, Aharonian & Völk (1994) Drury L. O., Aharonian F. A., Völk H. J., 1994, A&A, 287, 959
- Dwarkadas & Chevalier (1998) Dwarkadas V. V., Chevalier R. A., 1998, ApJ, 497, 807
- Feldman & Cousins (1998) Feldman G. J., Cousins R. D., 1998, Phys.Rev.D, 57, 3873
- Fulbright & Reynolds (1990) Fulbright M. S., Reynolds S. P., 1990, ApJ, 357, 591
- Funk et al. (2004) Funk S. et al., 2004, Astropart. Phys., 22, 285
- Green (2004) Green D. A., 2004, BASI, 32, 335
- Green & Gull (1984) Green D. A., Gull S. F., 1984, Nature, 312, 527
- Green et al. (2008) Green D. A., Reynolds S. P., Borkowski K. J., Hwang U., Harrus I., 2008, MNRAS, 387, L54
- Ksenofontov, Völk & Berezhko (2010) Ksenofontov L. T., Völk H. J., Berezhko E. G., 2010, ApJ, 714, 1187
- McClure-Griffiths et al. (2001) McClure-Griffiths N. M., Green A. J., Dickey J. M., Gaensler B. M., Haynes R. F., Wieringa M. H., 2001, ApJ, 551, 394
- Murphy, Gaensler & Chatterjee (2008) Murphy T., Gaensler B. M., Chatterjee S., 2008, MNRAS, 389, L23
- Ohm, van Eldik & Egberts (2009) Ohm S., van Eldik C., Egberts K., 2009, Astroparticle Physics, 31, 383
- Park et al. (2009) Park S., Kargaltsev O., Pavlov G. G., Mori K., Slane P. O., Hughes J. P., Burrows D. N., Garmire G. P., 2009, ApJ, 695, 431
- Park et al. (2006) Park S., Mori K., Kargaltsev O., Slane P. O., Hughes J. P., Burrows D. N., Garmire G. P., Pavlov G. G., 2006, ApJ, 653, L37
- Porter, Moskalenko & Strong (2006) Porter T. A., Moskalenko I. V., Strong A. W., 2006, ApJ, 648, L29
- Reynolds et al. (2008) Reynolds S. P., Borkowski K. J., Green D. A., Hwang U., Harrus I., Petre R., 2008, ApJ, 680, L41
- Reynolds et al. (2009) Reynolds S. P., Borkowski K. J., Green D. A., Hwang U., Harrus I., Petre R., 2009, ApJ, 695, L149
- Reynolds & Keohane (1999) Reynolds S. P., Keohane J. W., 1999, ApJ, 525, 368
- Rybicki & Lightman (1979) Rybicki G. B., Lightman A. P., 1979, Radiative Processes in Astrophysics. Wiley, New York
- Sedov (1959) Sedov L. I., 1959, Similarity and Dimensional Methods in Mechanics. Academic Press, New York
- Tanaka, Inoue & Holt (1994) Tanaka Y., Inoue H., Holt S., 1994, PASJ, 46, L37
- The H.E.S.S. Collaboration (2007) The H.E.S.S. Collaboration, 2007, ArXiv:0710.4057
- Torii et al. (2006) Torii K., Uchida H., Hasuike K., Tsunemi H., 2006, PASJ, 58, L11
- Völk, Berezhko & Ksenofontov (2003) Völk H. J., Berezhko E. G., Ksenofontov L. T., 2003, A&A, 409, 563
- Whiteoak & Green (1996) Whiteoak J. B. Z., Green A. J., 1996, A&AS, 118, 329
- Zirakashvili & Aharonian (2007) Zirakashvili V. N., Aharonian F., 2007, A&A, 465, 695