Pursuing the Amplitude of Tensor Mode Power Spectrum in Light of BICEP2

Baorong Chang changbaorong@dlut.edu.cn    Lixin Xu Corresponding author: lxxu@dlut.edu.cn Institute of Theoretical Physics, School of Physics & Optoelectronic Technology, Dalian University of Technology, Dalian, 116024, P. R. China College of Advanced Science & Technology, Dalian University of Technology, Dalian, 116024, P. R. China State Key Laboratory of Theoretical Physics, Institute of Theoretical Physics, Chinese Academy of Sciences
Abstract

In this brief report, we try to constrain general parameterized forms of scalar and tensor mode power spectra, Ps(k)As(k/k0)ns1+12αsln(k/k0)subscript𝑃𝑠𝑘subscript𝐴𝑠superscript𝑘subscript𝑘0subscript𝑛𝑠112subscript𝛼𝑠𝑘subscript𝑘0P_{s}(k)\equiv A_{s}(k/k_{0})^{n_{s}-1+\frac{1}{2}\alpha_{s}\ln(k/k_{0})} and Pt(k)At(k/k0)nt+12αtln(k/k0)subscript𝑃𝑡𝑘subscript𝐴𝑡superscript𝑘subscript𝑘0subscript𝑛𝑡12subscript𝛼𝑡𝑘subscript𝑘0P_{t}(k)\equiv A_{t}(k/k_{0})^{n_{t}+\frac{1}{2}\alpha_{t}\ln(k/k_{0})} by the recently released BICEP2 data set plus Planck 2013, WMAP9 and BAO. We loosen the inflationary consistence relations, and take Assubscript𝐴𝑠A_{s}, nssubscript𝑛𝑠n_{s}, Atsubscript𝐴𝑡A_{t} and ntsubscript𝑛𝑡n_{t} as free model parameters, via the Markov chain Monte Carlo method, the interested model parameter space was investigated, we obtained marginalized 68%percent6868\% limits on the interested parameters are: ns=0.963390.00554+0.00560subscript𝑛𝑠superscriptsubscript0.963390.005540.00560n_{s}=0.96339_{-0.00554}^{+0.00560}, nt=1.704900.56979+0.56104subscript𝑛𝑡superscriptsubscript1.704900.569790.56104n_{t}=1.70490_{-0.56979}^{+0.56104}, ln(1010As)=3.086820.02614+0.02353lnsuperscript1010subscript𝐴𝑠superscriptsubscript3.086820.026140.02353{\rm{ln}}(10^{10}A_{s})=3.08682_{-0.02614}^{+0.02353} and ln(1010At)=3.983760.54885+0.86045lnsuperscript1010subscript𝐴𝑡superscriptsubscript3.983760.548850.86045{\rm{ln}}(10^{10}A_{t})=3.98376_{-0.54885}^{+0.86045}. The ratio of the amplitude at the scale k=0.002Mpc1𝑘0.002superscriptMpc1k=0.002\text{Mpc}^{-1} is r=0.016550.01655+0.00011𝑟superscriptsubscript0.016550.016550.00011r=0.01655_{-0.01655}^{+0.00011} which is consistent with the Planck 2013 result.

I Introduction

The BICEP2 experiment ref:BICEP21 ; ref:BICEP22 has detected the B-modes of polarization in the cosmic microwave background. And this observed B-modes power spectrum gives the constraint to the tensor-to-scalar ratio with r=0.200.05+0.07𝑟subscriptsuperscript0.200.070.05r=0.20^{+0.07}_{-0.05} at the 1σ1𝜎1\sigma level of the lensed-ΛΛ\LambdaCDM model ref:BICEP21 ; ref:BICEP22 . And the tensor spectral tilt ntsubscript𝑛𝑡n_{t} can be obtained, when the first oder consistency relation, nt=r/8subscript𝑛𝑡𝑟8n_{t}=-r/8, was respected. Also, relaxing this consistency relation by taking ntsubscript𝑛𝑡n_{t} as a free model parameter ref:Huang2014 , r0.002=0.210.10+0.04subscript𝑟0.002subscriptsuperscript0.210.040.10r_{0.002}=0.21^{+0.04}_{-0.10} and nt=0.060.23+0.25subscript𝑛𝑡subscriptsuperscript0.060.250.23n_{t}=-0.06^{+0.25}_{-0.23} were obtained by using BICEP2 only. By combining Planck, WMAP9 and BAO data, it was already found that a blue tilt is slightly favored, but it is still well consistent with flat or red tilt ref:Wu2014 . However, one can go further by taking generalized parameterized forms of scalar and tensor mode power spectra as

Ps(k)subscript𝑃𝑠𝑘\displaystyle P_{s}(k) \displaystyle\equiv As(k/k0)ns1+12αsln(k/k0),subscript𝐴𝑠superscript𝑘subscript𝑘0subscript𝑛𝑠112subscript𝛼𝑠𝑘subscript𝑘0\displaystyle A_{s}(k/k_{0})^{n_{s}-1+\frac{1}{2}\alpha_{s}\ln(k/k_{0})}, (1)
Pt(k)subscript𝑃𝑡𝑘\displaystyle P_{t}(k) \displaystyle\equiv At(k/k0)nt+12αtln(k/k0),subscript𝐴𝑡superscript𝑘subscript𝑘0subscript𝑛𝑡12subscript𝛼𝑡𝑘subscript𝑘0\displaystyle A_{t}(k/k_{0})^{n_{t}+\frac{1}{2}\alpha_{t}\ln(k/k_{0})}, (2)

without assuming any idea about inflation, in other words throwing away the consistence relations, just considering the possible deviation from the scale invariant power spectra, i.e. the Harrison-Zel’dovich-Peebles spectra. And how to interpreter it is another issue. Of course, one can relate it to the so-called inflation, where the consistence relations should be respected. And in this way, one can test the viability of inflation models. But, one can also explain it through the bounce expansion. Here ns1subscript𝑛𝑠1n_{s}-1 and ntsubscript𝑛𝑡n_{t} are tilts of power spectrum of scalar and tensor modes, k0=0.05Mpc1subscript𝑘00.05superscriptMpc1k_{0}=0.05\text{Mpc}^{-1} is the pivot scale, αs=dns/dlnksubscript𝛼𝑠𝑑subscript𝑛𝑠𝑑𝑘\alpha_{s}=dn_{s}/d\ln k and αt=dnt/dlnksubscript𝛼𝑡𝑑subscript𝑛𝑡𝑑𝑘\alpha_{t}=dn_{t}/d\ln k are the running of the scalar and tensor spectral tilts. The primordial tensor-to-scalar ratio is defined by rAt/As𝑟subscript𝐴𝑡subscript𝐴𝑠r\equiv A_{t}/A_{s} at different pivot scale, here, they are r0.05subscript𝑟0.05r_{0.05} defined at k0=0.05Mpc1subscript𝑘00.05superscriptMpc1k_{0}=0.05\text{Mpc}^{-1} and r0.002subscript𝑟0.002r_{0.002} defined at k0=0.002Mpc1subscript𝑘00.002superscriptMpc1k_{0}=0.002\text{Mpc}^{-1}. In this paper, without any other specification, r0.002subscript𝑟0.002r_{0.002} will be donated by r𝑟r. And we also denote At/Assubscript𝐴𝑡subscript𝐴𝑠A_{t}/A_{s} as the amplitude ratio of the tensor and scalar mode power spectrum at kk0𝑘subscript𝑘0k\equiv k_{0}, i.e. the scale independent tensor-to-scalar ratio. In our calculation, adiabatic initial conditions were assumed in this paper. Actually, if one wants to relate the parameterized primordial power spectra, the following relations, the so-called consistency relation should be respected ref:Mukhanov1999

r=8csnt,𝑟8subscript𝑐𝑠subscript𝑛𝑡r=-8c_{s}n_{t}, (3)

By taking these parameters, ntsubscript𝑛𝑡n_{t} and Atsubscript𝐴𝑡A_{t} as free ones, one can test these consistency relation by the recently released BICEP2 data.

Here, we are mainly focusing on the model parameters which are related to the primordial power spectra. Therefore, in this brief paper, by combing the following data sets, we report the constrained results on the interested parameters:

(i) The newly released BICEP2 CMB B-mode data ref:BICEP21 ; ref:BICEP22 .

(ii) The full information of CMB which include the recently released Planck data sets which include the high-l TT likelihood (CAMSpec) up to a maximum multipole number of lmax=2500subscript𝑙𝑚𝑎𝑥2500l_{max}=2500 from l=50𝑙50l=50, the low-l TT likelihood (lowl) up to l=49𝑙49l=49 and the low-l TE, EE, BB likelihood up to l=32𝑙32l=32 from WMAP9, the data sets are available on line ref:Planckdata .

(iii) For the BAO data points as ’standard ruler’, we use the measured ratio of DV/rssubscript𝐷𝑉subscript𝑟𝑠D_{V}/r_{s}, where rssubscript𝑟𝑠r_{s} is the co-moving sound horizon scale at the recombination epoch, DVsubscript𝐷𝑉D_{V} is the ’volume distance’ which is defined as

DV(z)=[(1+z)2DA2(z)cz/H(z)]1/3,subscript𝐷𝑉𝑧superscriptdelimited-[]superscript1𝑧2subscriptsuperscript𝐷2𝐴𝑧𝑐𝑧𝐻𝑧13D_{V}(z)=[(1+z)^{2}D^{2}_{A}(z)cz/H(z)]^{1/3}, (4)

where DAsubscript𝐷𝐴D_{A} is the angular diameter distance. The BAO data include DV(0.106)=456±27subscript𝐷𝑉0.106plus-or-minus45627D_{V}(0.106)=456\pm 27 [Mpc] from 6dF Galaxy Redshift Survey ref:BAO6dF ; DV(0.35)/rs=8.88±0.17subscript𝐷𝑉0.35subscript𝑟𝑠plus-or-minus8.880.17D_{V}(0.35)/r_{s}=8.88\pm 0.17 from SDSS DR7 data ref:BAOsdssdr7 ; DV(0.57)/rs=13.62±0.22subscript𝐷𝑉0.57subscript𝑟𝑠plus-or-minus13.620.22D_{V}(0.57)/r_{s}=13.62\pm 0.22 from BOSS DR9 data ref:sdssdr9 . Here the BAO measurements from WiggleZ are not included, as they come from the same galaxy sample as P(k)𝑃𝑘P(k) measurement.

We will present the method and obtained results in the next section II. Section III is the conclusion.

II Constrained Results

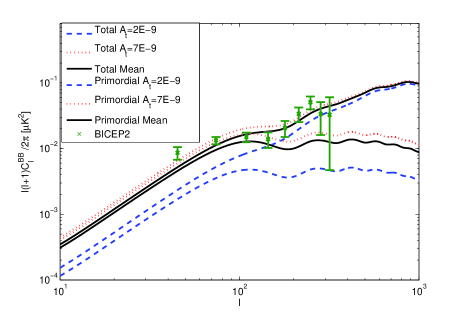
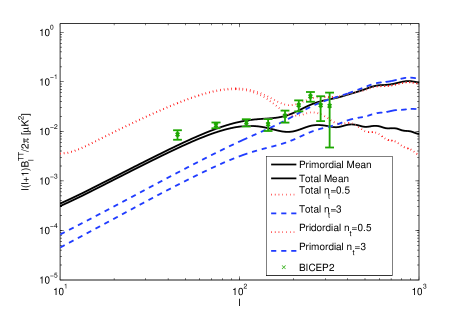
To study the effect of the spectral tilt ntsubscript𝑛𝑡n_{t} and the amplitude Atsubscript𝐴𝑡A_{t} to the B-mode of CMB power spectrum, we use the newest version of CAMB ref:CAMB code where the the running αssubscript𝛼𝑠\alpha_{s}, αtsubscript𝛼𝑡\alpha_{t} and amplitude Atsubscript𝐴𝑡A_{t} as free mdomel parameters have been included in the forms of the equations (1) and (2). By fixing the other relevant cosmological model parameters but varying ntsubscript𝑛𝑡n_{t} or Atsubscript𝐴𝑡A_{t}, we show the B-mode of CMB power spectrum in Figure 1 for different values of ntsubscript𝑛𝑡n_{t} and Atsubscript𝐴𝑡A_{t}, where the other relevant model parameters were fixed to their values obtained by Planck 2013 Collaboration group ref:Planck2013 .

One can clearly see that the variation of values of Atsubscript𝐴𝑡A_{t} corresponds to move the B-mode power spectrum along the vertical direction and almost keep the shape untouched. And larger values have large amplitude of the B-mode power spectrum as expected. On the contrast, the values of ntsubscript𝑛𝑡n_{t} manages the shapes at the low multipoles l<150𝑙150l<150. Large values of ntsubscript𝑛𝑡n_{t} will decrease the amplitude of the B-mode CMB power spectrum. And we should also notice the fact that the effects on the B-mode CMB power spectrum are truely independent on the consistency relations.

Refer to caption
Refer to caption
Figure 1: The simulated BB power spectrum for varying ntsubscript𝑛𝑡n_{t} or Atsubscript𝐴𝑡A_{t} where the other relevant model parameters are fixed to their best fit values obtained by Planck 2013 Collaboration group ref:Planck2013 . The left panel shows the B-mode CMB power spectrum for different values of At=2×109,3.98376×109,7×109subscript𝐴𝑡2superscript1093.98376superscript1097superscript109A_{t}=2\times 10^{-9},3.98376\times 10^{-9},7\times 10^{-9} respectively for the total lensed and primordial cases. The right panel is same as the left panel, but for varying nt=0.5,1.70490,3subscript𝑛𝑡0.51.704903n_{t}=0.5,1.70490,3 respectively.

To investigate the model parameter space,

P={Ωbh2,Ωch2,100θMC,τ,ns,nt,ln(1010As),ln(1010At)},𝑃subscriptΩ𝑏superscript2subscriptΩ𝑐superscript2100subscript𝜃𝑀𝐶𝜏subscript𝑛𝑠subscript𝑛𝑡lnsuperscript1010subscript𝐴𝑠lnsuperscript1010subscript𝐴𝑡P=\{\Omega_{b}h^{2},\Omega_{c}h^{2},100\theta_{MC},\tau,n_{s},n_{t},{\rm{ln}}(10^{10}A_{s}),{\rm{ln}}(10^{10}A_{t})\}, (5)

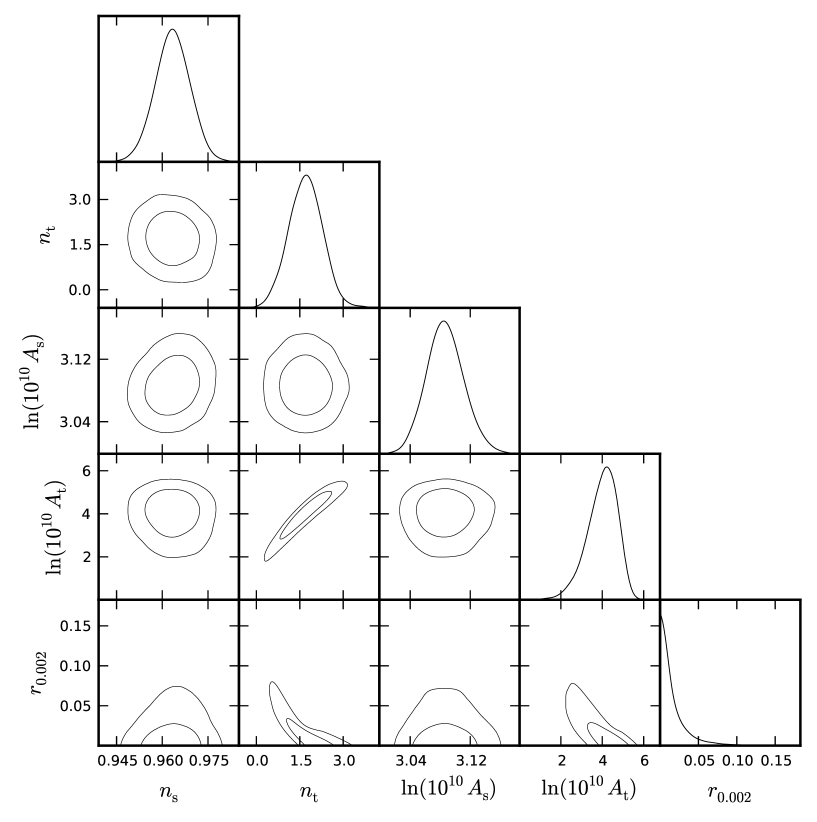
we performing a global fitting on the Computing Cluster for Cosmos by using the publicly available package CosmoMC ref:MCMC , which includes CAMB ref:CAMB to calculate the CMB power spectra that has been used to produce the BB power spectrum in Figure 1. The running was stopped when the Gelman & Rubin R1𝑅1R-1 parameter R10.01similar-to𝑅10.01R-1\sim 0.01 was arrived; that guarantees the accurate confidence limits. We set the inflation_consistency = F in the input params_CMB_defaults.ini file. The obtained results are shown in Table 1. The obtained contour plots are shown in Figure 2.

Parameters Priors Mean with errors Best fit
Ωbh2subscriptΩ𝑏superscript2\Omega_{b}h^{2} [0.005,0.1]0.0050.1[0.005,0.1] 0.022120.00024+0.00024superscriptsubscript0.022120.000240.000240.02212_{-0.00024}^{+0.00024} 0.022330.022330.02233
Ωch2subscriptΩ𝑐superscript2\Omega_{c}h^{2} [0.001,0.99]0.0010.99[0.001,0.99] 0.11850.0017+0.0017superscriptsubscript0.11850.00170.00170.1185_{-0.0017}^{+0.0017} 0.11880.11880.1188
100θMC100subscript𝜃𝑀𝐶100\theta_{MC} [0.5,10]0.510[0.5,10] 1.041430.00056+0.00057superscriptsubscript1.041430.000560.000571.04143_{-0.00056}^{+0.00057} 1.041581.041581.04158
τ𝜏\tau [0.01,0.81]0.010.81[0.01,0.81] 0.090600.01352+0.01184superscriptsubscript0.090600.013520.011840.09060_{-0.01352}^{+0.01184} 0.097390.097390.09739
nssubscript𝑛𝑠n_{s} [0.9,1.1]0.91.1[0.9,1.1] 0.963390.00554+0.00560superscriptsubscript0.963390.005540.005600.96339_{-0.00554}^{+0.00560} 0.964970.964970.96497
ntsubscript𝑛𝑡n_{t} [5,5]55[-5,5] 1.704900.56979+0.56104superscriptsubscript1.704900.569790.561041.70490_{-0.56979}^{+0.56104} 1.377221.377221.37722
ln(1010As)lnsuperscript1010subscript𝐴𝑠{\rm{ln}}(10^{10}A_{s}) [2.7,4]2.74[2.7,4] 3.086820.02614+0.02353superscriptsubscript3.086820.026140.023533.08682_{-0.02614}^{+0.02353} 3.103573.103573.10357
ln(1010At)lnsuperscript1010subscript𝐴𝑡{\rm{ln}}(10^{10}A_{t}) [0.01,10]0.0110[0.01,10] 3.983760.54885+0.86045superscriptsubscript3.983760.548850.860453.98376_{-0.54885}^{+0.86045} 3.660143.660143.66014
ΩΛsubscriptΩΛ\Omega_{\Lambda} ... 0.692920.01019+0.01016superscriptsubscript0.692920.010190.010160.69292_{-0.01019}^{+0.01016} 0.692860.692860.69286
ΩmsubscriptΩ𝑚\Omega_{m} ... 0.307080.01016+0.01019superscriptsubscript0.307080.010160.010190.30708_{-0.01016}^{+0.01019} 0.307140.307140.30714
zresubscript𝑧𝑟𝑒z_{re} ... 11.086811.05317+1.06072superscriptsubscript11.086811.053171.0607211.08681_{-1.05317}^{+1.06072} 11.6317711.6317711.63177
H0subscript𝐻0H_{0} ... 67.848860.77032+0.76690superscriptsubscript67.848860.770320.7669067.84886_{-0.77032}^{+0.76690} 67.9516667.9516667.95166
r𝑟r ... 0.016550.01655+0.00011superscriptsubscript0.016550.016550.000110.01655_{-0.01655}^{+0.00011} 0.018510.018510.01851
At/Assubscript𝐴𝑡subscript𝐴𝑠A_{t}/A_{s} ... 3.064062.55488+0.97924superscriptsubscript3.064062.554880.979243.06406_{-2.55488}^{+0.97924} 1.744681.744681.74468
Age/GyrAgeGyr{\rm{Age}}/{\rm{Gyr}} ... 13.801010.03741+0.03730superscriptsubscript13.801010.037410.0373013.80101_{-0.03741}^{+0.03730} 13.7766613.7766613.77666
Table 1: The mean values with 1σ1𝜎1\sigma errors and the best fit values of the model parameters and derived cosmological parameters, where the Planck 2013, WMAP9 and BICEP2 data sets were used.
Refer to caption
Figure 2: The 1D marginalized distribution and 2D contours for interested model parameters with 68%percent6868\% C.L., 95%percent9595\% C.L. by using Planck 2013, WMAP9 and BICEP2.

III Conclusion

In this brief paper, we loosen the inflation consistency relation constraint, and take the spectral tilts nssubscript𝑛𝑠n_{s}, ntsubscript𝑛𝑡n_{t}, Assubscript𝐴𝑠A_{s} and Atsubscript𝐴𝑡A_{t} as free model parameters. Combining the recently released BICEP2 data, Planck 2013, WMAP9 and BAO via the MCMC method, the model parameter space was scanned. We found that ns=0.963390.00554+0.00560subscript𝑛𝑠superscriptsubscript0.963390.005540.00560n_{s}=0.96339_{-0.00554}^{+0.00560}, nt=1.704900.56979+0.56104subscript𝑛𝑡superscriptsubscript1.704900.569790.56104n_{t}=1.70490_{-0.56979}^{+0.56104}, ln(1010As)=3.086820.02614+0.02353lnsuperscript1010subscript𝐴𝑠superscriptsubscript3.086820.026140.02353{\rm{ln}}(10^{10}A_{s})=3.08682_{-0.02614}^{+0.02353} and ln(1010At)=3.983760.54885+0.86045lnsuperscript1010subscript𝐴𝑡superscriptsubscript3.983760.548850.86045{\rm{ln}}(10^{10}A_{t})=3.98376_{-0.54885}^{+0.86045}. The ratio of the amplitude at the scale k=0.002Mpc1𝑘0.002superscriptMpc1k=0.002\text{Mpc}^{-1} is r=0.016550.01655+0.00011𝑟superscriptsubscript0.016550.016550.00011r=0.01655_{-0.01655}^{+0.00011} which is consistent with the Planck 2013 result. And a blue tensor tilt is favored at 1σ1𝜎1\sigma C.L.. And ntsubscript𝑛𝑡n_{t} is positive above 2σ2𝜎2\sigma C.L.. It implies the broken of consistency relation r=8csnt𝑟8subscript𝑐𝑠subscript𝑛𝑡r=-8c_{s}n_{t} at 2σ2𝜎2\sigma C.L., when the speed of sound cs>0subscript𝑐𝑠0c_{s}>0 is respected.

Acknowledgements.
This work is supported in part by NSFC under the Grants No. 11275035 and ”the Fundamental Research Funds for the Central Universities” under the Grants No. DUT13LK01.

References

  • (1) P. A. R. Ade, et al. (BICEP2 Collaboration) (2014), 1403.4302.
  • (2) P. A. R. Ade, et al. (BICEP2 Collaboration) (2014), 1403.3985.
  • (3) C. Cheng, Q.-G. Huang, arXiv:1403.5463; C. Cheng, Q.-G. Huang, arXiv: 1403.7173.
  • (4) F. Wu, Y. Li, Y. Lu, X. Chen, arXiv:1403.6462 [astro-ph.CO].
  • (5) J. Garriga, V. F. Mukhanov, Phys. Lett. B 458, 219(1999), arXiv:hep-th/9904176.
  • (6) P. A. R. Ade, et al, (Planck Collaboration), arXiv:1303.5076 [astro-ph.CO].
  • (7) http://pla.esac.esa.int/pla/aio/planckProducts.html.
  • (8) F. Beutler, et al., Mon. Not. Roy. Astron. Soc. 416, 3017 (2011), arXiv:1106.3366 [astro-ph.CO].
  • (9) N. Padmanabhan, et al., Mon. Not. Roy. Astron. Soc. 427, 2132 (2012), arXiv:1202.0090 [astro-ph.CO].
  • (10) L. Anderson, et al., Mon. Not. Roy. Astron. Soc. 428, 1036 (2013) arXiv:1203.6594 [astro-ph.CO].
  • (11) A. G. Riess, et al., ApJ, 730, 119 (2011), arXiv:1103.2976[astro-ph.CO].
  • (12) A. Lewis, A. Challinor, A. Lasenby, Astrophys. J. 538, 473(2000); http://camb.info.
  • (13) A. Lewis and S. Bridle, Phys. Rev. D 66, 103511 (2002); http://cosmologist.info/cosmomc/.